I. INTRODUCTION
Magnesium alloys are of great potential to be used in the aerospace, military, and automotive industries because of their low density, high specific strength, and excellent machinability.Reference Mordike and Ebert1,Reference Luo2 Mg–Al based cast components with moderate strength have been commercially used.Reference Carter, Melo, Savic, Hector and Krajewski3 However, their strength decreases sharply at elevated temperatures above 150 °C due to the instability of precipitates at higher temperature.Reference Hirai, Somekawa, Takigawa and Higashi4–Reference Mahmudi, Kabirian and Nematollahi6 The wrought magnesium alloys have higher manufacturing costs compare to the cast alloys and also are not suitable for the product of the part with asymmetric shape. For the aerospace parts or some industrial usage, most of the parts are not symmetry and needs to use the casting to product them.Reference Carter, Melo, Savic, Hector and Krajewski3,Reference Hono, Mendis, Sasaki and Oh-ishi7,Reference Antoniswamy, Taleff, Hector and Carter8 In the aerospace and military areas, components are usually required to serve for long time at ∼300 °C. Therefore, many attempts have been made to develop Mg alloys with stable structures at elevated temperatures.
Mg alloys containing rare earth elements (RE) have received considerable interest due to the high yield strength (YS) achieved through precipitation hardening and solution strengthening. Consequently, their microstructure, precipitation sequence, and mechanical properties have been extensively documented experimentally.Reference Nie and Muddle9–Reference Janik, Yin, Wang, He, Chen, Chen and Boehlert15 The very successful examples of commercial high-temperature Mg–RE alloys are the WE series (Mg–Y–RE–Zr) whose strength is better than commercial Mg–Al based alloys such as AZ91 and AZ31B alloys at elevated temperatures.Reference Mordike16 However, the strength of WE series (Mg–Y–RE–Zr) is also reported to be low at 200 °C.Reference Nie and Muddle9 Therefore, to develop high-performance Mg alloys for elevated-temperature application is of great interest. Recently, Mg–Gd–Y based alloys are found to exhibit outstanding mechanical properties and better creep resistance than conventional Al and WE alloys at both ambient temperature and elevated temperatures.Reference Anyanwu, Kamado and Kojima10,Reference Janik, Yin, Wang, He, Chen, Chen and Boehlert15,Reference Mordike16 Hence, they are expected to have promising applications in aerospace crafts.
Magnesium and RE are prone to oxidize rapidly during the smelting and casting process, which results in the loss of RE and formation of inclusions deteriorating the ductility, strength, and corrosion resistance of alloys.Reference Du, Wu, Nie, Su and Zuo17 Li et al. reported that shrinkage porosity reduces the tensile strength of a sand-cast Mg–Y–RE (WE54) alloy.Reference Li, Ma, Chen and Ke18 Wang found that inclusions deteriorate the mechanical properties of Mg–10Gd–3Y–0.5Zr alloy.Reference Wang, Huang, Wu, Wang, Sun and Ding19 Among the developed casting techniques, the low-pressure casting technique can considerably reduce the amount of defects. Liu et al. reported that the mechanical properties of the low-pressure sand-cast (LPSC) Mg–10Gd–3Y–0.5Zr alloy are improved after T6 heat treatment.Reference Liu, Jiang, Cao, Mei, Wu, Zhang, Xiao, Wang and Ding20 Moreover, LPSC is reported to be an appropriate technique to produce Mg components, especially those with thin-walls (2∼5 mm) and complex geometry.Reference Edler, Lagrené, Siepe and Kainer21 Consequently, this study employs the LPSC to prepare heat-resistant Mg–Gd–Y–Zr castings.
In the Mg–Gd–Y–Zr alloys, Gd,Reference Jafari Nodooshan, Liu, Wu, Rao, Zhou, He, Ding and Mahmudi22,Reference Liang, Guan, Tan, Chen and Tang23 YReference Wang, Meng, Zhang and Tang24–Reference Jiang, Liu, Wu and Ding26 and/or ZrReference Sun, Wu, Wang and Ding27,Reference Fang, Yi, Nie, Zhang, Wang and Xiao28 are important alloying elements which greatly influence the alloy microstructures and mechanical properties. The addition of RE (such as Gd, Y, Nd, Ce, Sm etc.,) elements leads to the formation of dense nano-sized precipitates during heat treatment,Reference Wang, Meng, Zhang and Tang24,Reference Chang, Guo, He, Fu, Ping and Ding29–Reference Li, Wang and Ding31 and the addition of Zr can strongly refine the grains of Al-free Mg alloys during solidification.Reference Qian and Das32 Previous researches were mainly related to their mechanical properties at room temperature, while the elevated-temperature mechanical properties, which are main parameters of these alloys are yet to be symmetrically clarified. Therefore, a good understanding of the relationship between compositions and mechanical performance at elevated temperature is necessary for Mg–Gd–Y–Zr alloys.
The present study aims to clarify the mechanical properties of Mg–Gd–Y–Zr alloys with various Gd and Zr additions at temperatures ranging from 25 to 300 °C (the service temperatures for aerospace components are generally below 300 °C). The present study will promote the development of heat-resistant Mg–Gd–Y–Zr magnesium alloys to some extent.
II. EXPERIMENTAL DETAILS
A. Materials
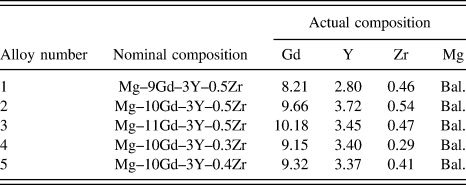
The magnesium alloys were prepared in a mild steel crucible in an electrical resistance furnace. Alloys with nominal compositions Mg–xGd–3Y–0.5Zr (x = 9, 10, and 11) (all compositions are in weight percentage unless stated otherwise) and Mg–10Gd–3Y–yZr (y = 0.3, 0.4, and 0.5) were prepared from high-purity magnesium ingot (≥99.9%), and Mg–25%Y, Mg–25%Gd, and Mg–30%Zr master alloys. The magnesium ingot was melted in the steel crucible, and then Mg–25%Y and Mg–25%Gd master alloys were added into the steel crucible when the melt temperature reached 730–750 °C followed by manual stirring for two min. The melt was subsequently held at 780 °C for 40 min to allow the RE to completely dissolve. The preheated Mg–30%Zr master alloy was introduced to the melt at 780–800 °C. After it was purified by 1.5% JDMJ flux, the melt was then held at 780 °C for 40 min before casting. About 250 kg of the melt was poured into the prepared no-bake resin sand mold using a low-pressure casting system. The details of the casting system and the casting shape were schematically shown in Fig. 1. The casting was divided into eight regions, marked as B1 to B4 and C1 to C4, and the corresponding ingate was placed at region C4. The actual chemical composition was determined by an inductively coupled plasma analyzer (ICP, Plasma-400, Perkin Elmer Inc., Waltham, MA) and listed in Table I. The component was solution treated at 525 °C for 12 h and cooled in air at 250 °C for 10 h, which was denoted as sand-cast-T6 treatment. The samples of cast-on bar for microstructure characterization observation and the mechanical properties tests were all cut from the region (B4, C2, and C3) of the T6 treated component.
A schematic of the low-pressure casting device and Mg casting used in this study: (a) low-pressure casting system, (b) simplified illustration of the sand casting.

Actual chemical compositions of the investigated Mg–Gd–Y–Zr alloys.
B. Analysis of microstructures and tensile tests
Samples for optical microscopy observations were mounted in a fast curing epoxy at room temperature, successively ground using 320, 1200, and 3000 grit grade SiC abrasive grinding paper, polished using 1 and 6 μm diamond suspensions, and then finally polished using 0.04 μm-MgO solution. Samples were then etched by a 4 vol% nital solution to reveal grain boundaries. The average grain size (d) was measured by analyzing the optical micrographs with the mean linear intercept technique (ASTM E112-96). At least 500 grain boundaries were counted for each alloy.
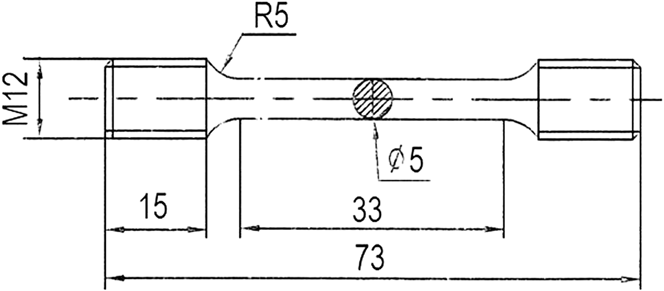
Phase analysis was carried out by x-ray diffraction (XRD; D/max 2550V, Rigaku Corporation, Tokyo, Japan) using Ni-filtered Cu Kα radiation. Hardness was tested by a Vickers tester with a load of 49 N and a holding time of 15 s, where at least eight points were measured for each alloy. Specimens for mechanical test were cut from the regions (B4, C2, and C3) of the sand-cast-T6 treated component and then machined with the load parallel to the cast block shape. Tensile properties of the tested alloys were performed at the initial strain rate of 5 × 10⁻⁴ s−1 referred to the relevant standard of ASTM: E8M-13 a using cylindrical specimen (see Fig. 2) with marked dimensions of 33 mm in gauge length and 5 mm in diameter on Zwick/Roell Z020 tensile machine (Zwick Roell Group, Ulm, Baden–Württemberg, Germany) at temperatures ranging from 25 to 300 °C. For tests at elevated temperatures, specimens were heated to the required temperature (actual error ±2 °C) within 15 min and held for 10 min before testing. An average of three measurements was used. The fracture surfaces were analyzed by a scanning electron microscope (SEM, FEI SIRION 200; FEI Company, Hillsboro, Oregon). Characterization of the precipitates was performed in a transmission electron microscope (TEM, JEOL-2010; JEOL Ltd., Tokyo, Japan) operating at 200 KV.
Dimension (mm) of the cylindrical tensile specimen.
III. RESULTS AND DISCUSSION
A. Microstructures
Figure 3 shows the XRD patterns of Mg–Gd–Y–Zr alloys. The as-cast Mg–Gd–Y–Zr alloys mainly consist of α-Mg and Mg24(Gd,Y)5 phase, which is consistent with previous reports on Mg–Gd–Y–Zr alloys.Reference Anyanwu, Kamado and Kojima10,Reference He, Zeng, Peng, Gao, Nie and Ding13,Reference Janik, Yin, Wang, He, Chen, Chen and Boehlert15 Typical optical micrographs of as-cast Mg–xGd–3Y–0.5Zr (x = 9, 10, 11) alloys and Mg–10Gd–3Y–yZr alloys (y = 0.3, 0.4, 0.5) are shown in Fig. 4. Two kinds of phases with different contrast, i.e., the white-equiaxed α-Mg matrix and gray network eutectic compounds distributed along the grain boundaries, can be well distinguished. As shown in Figs. 4(a)–4(c), the grain morphology and eutectic compounds in Mg–xGd–3Y–0.5Zr (x = 9, 10, 11) alloys are different. In the Mg–9Gd–3Y–0.5Zr alloy, grains are equiaxed dendrites, and the eutectic compounds have island and discontinuous network shape. After the addition of 10% Gd, the grain morphology is still fine equiaxed dendritic [Fig. 4(b)], while the morphology of eutectic compounds changes from semicontinuous to discontinuous along the grain boundaries, and some island or short-bar shaped eutectic can be observed in the matrix. Further increasing the addition level of Gd to 11%, the grain morphology changes to be partially coarse dendritic, and the eutectic compounds become semicontinuous network. Furthermore, the increase in Gd content leads to a remarkable increase in the amount of eutectic compounds from 4.7% to 12.4%. As seen from Mg–10Gd–3Y–yZr (y = 0.3, 0.4, 0.5) alloys in Figs. 4(d) and 4(e), the grain morphology is dendritic and eutectic compounds mainly form as quasicontinuous network [Fig. 4(d)]. As 0.4% Zr content is added, finer dendrites with smaller dendritic arm spacing can be observed, and most of the quasicontinuous networks are changed to be semicontinuous and some island-shaped eutectic distributed along grain boundaries. It can also be seen that increasing Zr content has a significant influence on the amount of eutectic compounds, and the volume fraction of eutectic of the above three alloys is measured to be 15.8, 9.7, and 5.9 vol%, respectively.
XRD patterns of the as-cast alloys: (a) Mg–11Gd–3Y–0.5Zr, (b) Mg–10Gd–3Y–0.5Zr, (c) Mg–9Gd–3Y–0.5Zr, (d) Mg–10Gd–3Y–0.4Zr, and (e) Mg–10Gd–3Y–0.3Zr.
Optical micrograph of the as-cast alloys: (a) Mg–9Gd–3Y–0.5Zr, (b) Mg–10Gd–3Y–0.5Zr, (c) Mg–11Gd–3Y–0.5Zr, (d) Mg–10Gd–3Y–0.3Zr, and (e) Mg–10Gd–3Y–0.4Zr.
Figure 5 shows the variation of average grain size with the Gd and Zr contents. The Gd content has a negligible effect on the grain size. The grain sizes of Mg–xGd–3Y–0.5Zr alloys were statistically equivalent and kept at ∼40 μm. In contrast, Zr has a remarkable influence on the grain size [Fig. 5(b)]. With increasing Zr content from 0.3% to 0.5%, the grain size decreases from 129 μm to 39 μm. The strong grain refinement effect of Zr on Mg alloy has been well documented,Reference Qian and Das32 i.e., the primary Zr particles serve as nucleation sites owing to the similarity of lattice parameters and crystal structure of Mg and Zr,Reference Emley33 and Zr solute contributes to grain refinement by the growth restriction effects.Reference Peng, Zhang, Chen, Xiao and Jiang34
Grain size of as-cast samples as a function of addition of: (a) Gd, (b) Zr.
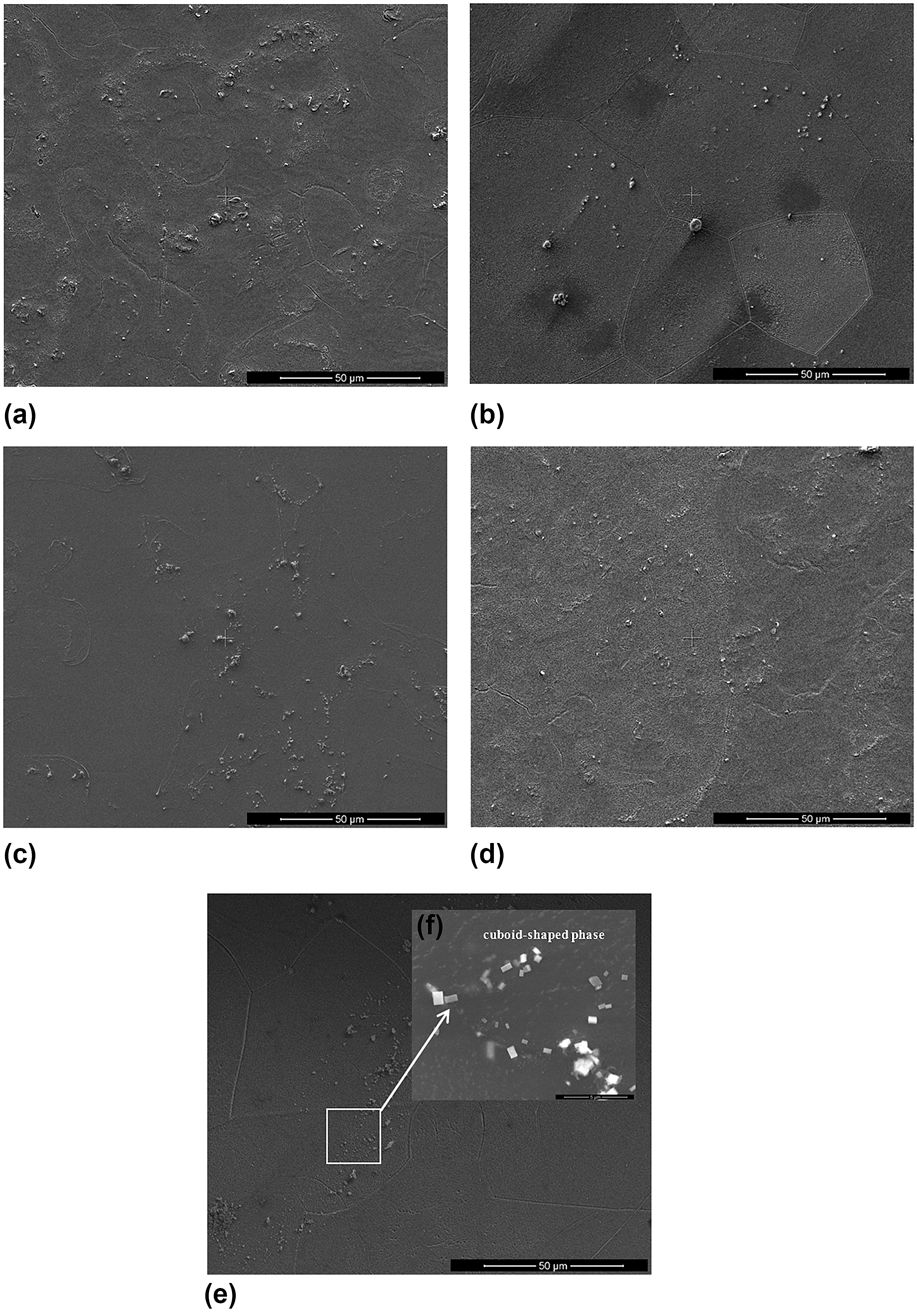
Figures 6 and 7 show the microstructures and XRD patterns of sand-cast-T6 Mg–Gd–Y–Zr alloys, respectively. T6 alloys mainly consist of α-Mg, Mg5(Gd,Y) phase and β′ phase, and the Mg24(Gd, Y)5 eutectic phase has dissolved into the matrix after heat treatment. A few small block-shaped particles were distributed along the grain boundaries and within the α-Mg matrix. This kind of block-shaped particles has been confirmed to be with face centered cubic-crystal structure.Reference He, Zeng, Peng, Gao, Nie and Ding13 Furthermore, some Zr cores are also observed within grains and distributed along grain boundaries. Figure 8 shows the SEM micrographs of the intermetallic particles in the T6 treated Mg–xGd–3Y–yZr alloys. Some cuboid-shaped particles with size of 0.5∼3 μm which were formed from the supersaturated matrix during aging process are found to unevenly distribute in the matrix. Furthermore, the number density of the cuboid-shaped particles increased with increasing Gd content.
Optical micrograph of the aged alloys: (a) Mg–9Gd–3Y–0.5Zr, (b) Mg–10Gd–3Y–0.5Zr, (c) Mg–11Gd–3Y–0.5Zr, (d) Mg–10Gd–3Y–0.3Zr, and (e) Mg–10Gd–3Y–0.4Zr.
XRD patterns of the age alloys: (a) Mg–11Gd–3Y–0.5Zr, (b) Mg–10Gd–3Y–0.5Zr, (c) Mg–9Gd–3Y–0.5Zr, (d) Mg–10Gd–3Y–0.4Zr, and (e) Mg–10Gd–3Y–0.3Zr.
SEM micrograph of Mg–Gd–Y–Zr alloys in sand-cast-T6 conditions: (a) Mg–9Gd–3Y–0.5Zr, (b) Mg–10Gd–3Y–0.5Zr, (c) Mg–11Gd–3Y–0.5Zr, (d) Mg–10Gd–3Y–0.3Zr, (e) Mg–10Gd–3Y–0.4Zr, and (f) enlarge magnification of cuboid-shaped phase.
B. Hardness and mechanical properties
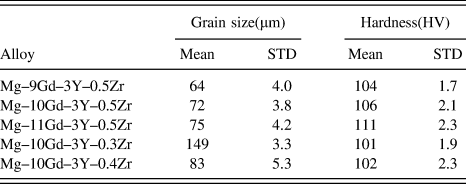
Table II shows the variation of hardness with the Gd and Zr contents. It is obvious that the hardness is slightly increased with increasing Gd content. Mg–11Gd–3Y–0.5Zr alloy has a hardness value of 111 HV, which is about 7 HV higher than that of Mg–9Gd–3Y–0.5Zr alloy. The increase of hardness is attributed to the increase in the number density of fine cuboid-shaped precipitates which distribute within the matrix when Gd content is increased as shown in Figs. 8(a)–8(c). In addition, the Zr content has a negligible influence on hardness.
Average grain size and Vickers hardness of sand-cast-T6 alloys.
STD refers to the standard deviation from the mean value.
Figure 9 presents the mechanical properties of sand-cast-T6 Mg–xGd–3Y–0.5Zr alloys at temperatures varying from 25 to 300 °C. When the temperature is 25 °C and Gd content is 9%, the ultimate tensile strength(UTS), YS, and EL are 334 MPa, 227 MPa, and 3.4%, respectively. With increasing the Gd content from 9 to 11%, the UTS and YS increase gradually from 334 to 350 MPa and from 227 to 251 MPa, respectively, while the elongation (EL) is greatly reduced from 3.4 to 1.8 %. When the test temperature is between 100 and 150 °C, similar changes are observed in the strength of Mg–xGd–3Y–0.5Zr alloys. Both UTS and YS of 11% Gd alloy achieve the peaks 365 MPa and 265 MPa at 150 °C, while the EL was greatly increased from 1.8% at room temperature to 8.2%. When the test temperature is 200 °C, the variation in Gd content from 9 to 11% does not lead to a significantly change in UTS and YS. When the temperature for tensile test is between 250 and 300 °C, both UTS and YS slightly decrease [Figs. 9(a) and 9(b)]. However, compared with the test at 200 °C, the EL increases gradually in the test temperature range of 250–300 °C.
Tensile properties of Mg–xGd–3Y–0.5Zr alloys at room and elevated temperatures: (a) UTS, (b) YS, and (c) EL.
With increasing Gd content from 9 to 11%, the mechanical properties of T6 treated Mg–xGd–3Y–0.5Zr alloys are significantly improved with the increase of tensile temperature. The improvement of tensile property is closely related to the precipitation strengthening of Mg–xGd–3Y–0.5Zr alloys.Reference Nie and Muddle9,Reference He, Zeng, Peng, Gao, Nie and Ding14,Reference Nie35,Reference Peng, Wu, Fang, Meng and Wang36 Additionally, because β′ is the major strengthening phase in Mg–Gd–Y alloys.Reference Nie and Muddle9–Reference He11,Reference Jafari Nodooshan, Liu, Wu, Rao, Zhou, He, Ding and Mahmudi22,Reference Wang, Meng, Zhang and Tang24,Reference Chang, Guo, He, Fu, Ping and Ding29,Reference Zheng, Dong, Zeng and Ding30 For experimental alloy, finely dispersed stable β′ precipitates (checked by XRD in Fig. 7) within the matrix strengthened the Mg matrix, and can effectively inhibit the grain deformation and dislocation glide.Reference APPs, Karimzadeh, King and Lorimer37 The β′ precipitates, which form on the prismatic planes of the matrix in a dense triangular arrangement, were vertical to basal plane of Mg and provide the effective obstacles to basal dislocation slip, leading to the strengthening of Mg–xGd–3Y–yZr alloys at room temperature. Meanwhile, some cuboid-shaped particles with size of 0.5∼3 μm which formed from the supersaturated matrix during aging process were found to unevenly distribute in the matrix and grain boundaries [Fig. 8]. Suitable quantities of cuboid-shaped precipitates can improve the strength of the alloy, but excessive precipitates can cause stress concentration near the grain boundary and act as nucleation sites for the crack initiation, leading to a decrease of EL. When increasing Gd content from 9 to 11%, the EL is greatly reduced from 3.4% in 9% Gd alloy to 1.8 % in 11% Gd alloy [Fig. 9(c)]. Our observations are in agreement with other reports on the Mg–Gd–Y–Zr alloy, which have shown that excessive cuboid-shaped precipitates can deteriorate mechanical properties.Reference Jafari Nodooshan, Liu, Wu, Rao, Zhou, He, Ding and Mahmudi22
Figure 10 shows the effect of Zr on the mechanical properties of Mg–10Gd–3Y–yZr alloys (y = 0.3, 0.4, 0.5) at different temperatures. When the temperature for tensile test is 25 °C, the UTS, YS, and EL are greatly improved by the increase of Zr content from 0.3 to 0.5%. The UTS, YS, and EL are increased by about 73 and 11 MPa, and two times, respectively. When the temperature for tensile test is between 100 °C and 150 °C, the UTS, YS, and EL of Mg–10Gd–3Y–yZr alloys increase gradually with the increase of Zr addition. Both UTS and YS of Mg–10Gd–3Y–yZr alloys achieve the peak strengths at 150 °C tensile test. It is worth noting that the alloys containing 0.5% Zr possesses higher UTS and YS (361 and 263 MPa) at 150 °C [Figs. 10(a) and 10(b)]. It is inferred that the variation of Zr content has a significantly effect on improving mechanical properties due to the refined microstructures. When the temperature for tensile test is 200 °C, the addition of Zr has little effect on the UTS or YS, i.e. the Mg–10Gd–3Y–yZr specimens tested at 200 °C have comparable strengths with those tested at 25 °C. When the temperature for tensile test is between 250 °C and 300 °C, the UTS and YS of Mg–10Gd–3Y–yZr alloys decrease rapidly. As mentioned above, the effect of Zr on the mechanical properties can be explained as follows:
Tensile properties of Mg–10Gd–3Y–yZr alloys at room and elevated temperatures: (a) UTS, (b) YS, and (c) EL.
The change of tensile mechanical property is closely related to the grain size of Mg–Gd–Y–yZr alloy, and thus the mechanical properties with the elevation of test temperature can be affected by this factor. It can be explained by the Hall–Petch equationReference Gao, Chen and Han25: σ = σ0 + kd−1/2 where σ is the YS, d is the grain size, and σ0 and k are parameters determined for the polycrystalline material. The results of the experiment demonstrated that the grain boundary strengthening contribution in the Mg–10Gd–3Y–0.5Zr alloy with a smaller grain size (∼72 μm) is higher than Mg–10Gd–3Y–0.3Zr alloy with a larger grain size (∼149 μm). Therefore, the Mg–10Gd–3Y–0.5Zr alloy shows the highest YS, as well as UTS and EL at test temperatures ranging from 25 to 300 °C. As seen from Fig. 10(c), it should be noted that the EL increase monotonically with an increase in temperature [Fig. 10(c)]. This suggests that the tensile property is not solely dependent on the grain boundary strengthening within the 25–300 °C range. There are other strengthening mechanisms which should be considered that can explain this strengthening behavior of Mg–10Gd–3Y–yZr alloys at elevated temperature. Recent computational work, based on first-principles calculations, has begun to establish a quantitative, theoretical basis to predict the effects of solutes on basal slip and the thermally activated basal to prismatic cross-slip behavior in Mg alloys.Reference Yasi, Hector and Trinkle38,Reference Yasi, Hector and Trinkle39 These studies further predicted that other solutes including Ca, Y, Zr, and Li lower the stress for cross-slip in Mg alloys.Reference Yasi, Hector and Trinkle40 Based on above prediction, it is reasonable to believe that the existence of Y and Zr solute atoms can lead to lower stress for thermally activated cross-slip during tensile test above room temperature, which consequently leads to an improved EL.
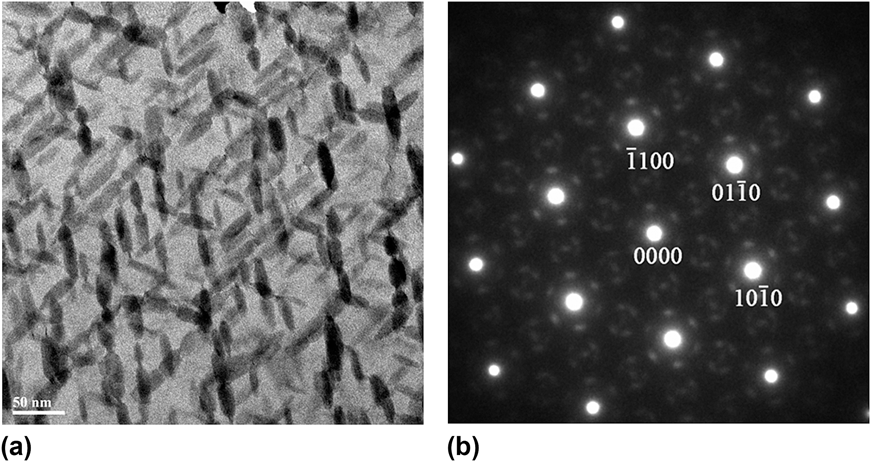
In this study, it is also worth noting that the UTS and YS of the T6 treated Mg–xGd–3Y–yZr alloys initially increase with increasing the tensile test temperature, and then sharply decrease with the temperature further increased. Both of UTS and YS of Mg–xGd–3Y–yZr alloys at 150 °C are higher than that at 25 °C. Figure 11 shows that the fine precipitates were formed in the Mg–10Gd–3Y–0.5Zr alloy aged at 250 °C for 10 h. The corresponding selected area electron diffraction (SAED) patterns indicate that the precipitates are β′ phase with a base centered orthorhombic structure as identified in Mg–Gd–Y based alloys.Reference Anyanwu, Kamado and Kojima10 The β′ precipitates are formed in the T6 treatment and remain stable during the subsequent tensile test at 150 °C, which indicates that the β′ precipitates in Mg matrix have a good thermal stable and could effectively prevent sliding of basal plane.Reference Zhang, Li, Li and Ma41 The plate-shaped β′ precipitates which are vertical to basal plane of α-Mg could effectively prevent the basal dislocation slip even at 250 °C.Reference He, Zeng, Peng, Gao, Nie and Ding13 When the temperature for tensile test is between 250 and 300 °C, the UTS and YS of Mg–xGd–3Y–yZr alloys decrease rapidly. The very sharp decrease in UTS and YS with increasing temperature above 250 °C can be explained by following factors. The magnesium has the hexagonal structure, and the basal and nonbasal slip systems operate simultaneously with increasing temperature.Reference Koike, Ohyama, Kobayashi, Suzuki and Maruyama42 In addition, the increasing temperature can also decrease the critical resolved shear stress of slip system. Moreover, the prismatic precipitates are thought to provide less effective obstacles to prevent nonbasal slip and cross-slip which is activated at 250 °C or above, because the prismatic precipitate plates are not perpendicular to the slip planes.Reference He, Zeng, Peng, Gao, Nie and Ding13 Furthermore, grain boundary sliding exists in Mg–xGd–3Y–yZr alloys and contributes to the significantly increase of EL at elevated temperature.Reference Yin, Wang, Gao, Chen and Zheng43 It is also observed that the Mg–11Gd–3Y–0.5Zr alloy has a lower UTS and YS than Mg–9Gd–3Y–0.5Zr alloy at temperatures between 250 and 300 °C. It should be due to the excessive cuboid-shaped particles separated from the matrix which results in micro-cracks initiation at elevated temperature.Reference Zhang, Li, Li and Ma41,Reference Gao, Chen and Han44 In addition, lots of cuboid particles can be found in Fig. 13(d). However, there may be other factors that have not been considered in this discussion, which will be studied in future.
(a) TEM bright field image recorded parallel to [0001]α showing precipitates in Mg–10Gd–3Y–0.5Zr specimen tensile test at 150 °C, and the corresponding SAED pattern: (b) [0001]α zone axis.
C. Fracture behavior
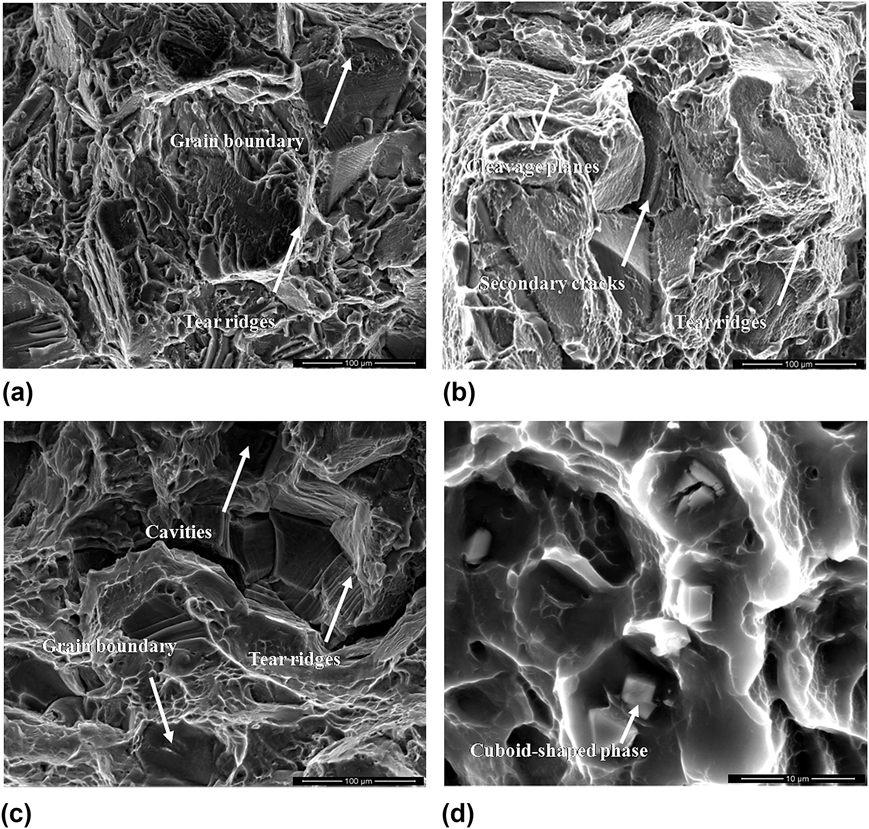
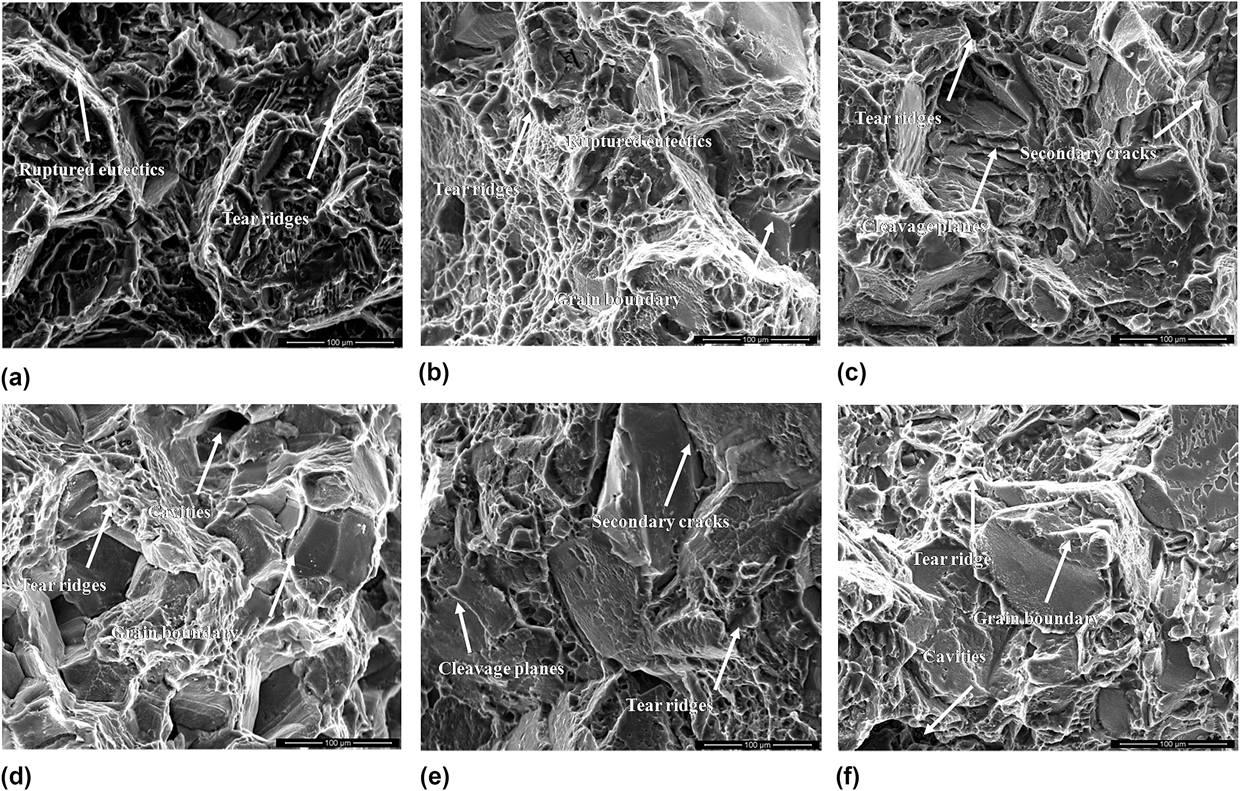
Figures 12 and 13 show the typical fracture surfaces of tensile specimens of the sand-cast-T6 treated Mg–xGd–3Y–0.5Zr (x = 9, 11) and Mg–10Gd–3Y–0.3Zr alloys tested within the 25–300 °C range, respectively. When the alloy is tested at 25 °C, the fracture surfaces show large cleavage planes, secondary cracks, and tear ridges [Figs. 12(a)–12(d) and 13(a)], and the fracture mode is transgranular cleavage fracture. Similar morphology of fracture surface of Mg–xGd–3Y–0.5Zr (x = 9, 11) alloys tested at 200 °C can be observed, and the fracture surface are characterized by transgranular cleavage fracture due to cleavage planes and tear ridges in large scale [Figs. 12(b)–12(e) and 13(b)]. The optical microstructure of the ruptured samples perpendicular to the fracture surface tested at 25–200 °C are exhibited in Figs. 14(a) and 14(b). It can be seen that secondary cracks and twining were produced near the fracture surfaces, and the cracks originate from the twins and propagate along the grain boundaries [Fig. 14]. Twinning is an especially important deformation behavior for Mg alloy. The  $\left\{ {10\bar 12} \right\}$$$$\left\langle {10\bar 10} \right\rangle$twinning, which gives extension along the c-axis in Mg alloys, can increase the uniform EL in tensile test.Reference Barnett45 Additionally, in the grains with few twins observed readily near the fracture, some individual twins were visible. The matrix and twin boundaries could also hinder the dislocation moving and cause crack initiation and propagation,Reference Shi, Luo, Sutton, Zeng, Wang, Zeng, Li and Ding46 and finally lead to transgranular cleavage fractures dominating at 25 and 200 °C. After the specimens are tested at 300 °C, the fracture surface shown in Figs. 12(c)–12(f) mainly consist of both tear ridges that surround at the triple points of grain boundary and a few of dimples. Figures 14(c)–14(e) shows the microstructure of longitudinal section of fracture surface for specimen tested at 300 °C. Most of deformed grains are not readily observed twins, including the grains with few twins. This is probably due to the activated number of slip systems with increasing temperature, as described by Anyanwu and Gao.Reference Anyanwu, Kamado and Kojima10,Reference Yin, Wang, Gao, Chen and Zheng43 Large cavities and cracks are also observed on grain boundaries perpendicular to the tensile direction. The secondary cracks are mostly formed along grain boundaries, indicating the fracture mode of alloys tested at 300 °C is microvoid coalescence fracture.
SEM of tensile fracture surface of sand-cast-T6 Mg–10Gd–3Y–0.3Zr alloys fractured at different temperature: (a) 25 °C, (b) 200 °C, (c) 300 °C, and (d) enlarge magnification of fracture surface.
Optical micrographs from longitudinal sections adjacent to tensile fracture surface of T6 treated Mg–xGd–3Y–0.5Zr alloys fractured at different temperature: Mg–11Gd–3Y–0.5Zr alloy fractured at (a) 25 °C, (b) 200 °C, (c) 300 °C; Mg–9Gd–3Y–0.5Zr alloy fractured at (d) 200 °C, (e) 300 °C.
SEM of tensile fracture surface of sand-cast-T6 Mg–xGd–3Y–0.5Zr alloys fractured at different temperature: Mg–9Gd–3Y–0.5Zr alloy fractured at (a) 25 °C, (b) 200 °C, and (c) 300 °C; Mg–11Gd–3Y–0.5Zr alloy fractured at (d) 25 °C, (e) 200 °C, and (f) 300 °C.
It can be concluded that the fracture mode changes from transgranular cleavage fracture to microvoid coalescence fracture when the temperature of tensile test is increased. Little difference in fracture mode is observed between specimens of 9 and 11% Gd. In addition, the fracture mode of Mg–10Gd–3Y–0.3Zr alloy is similar to that of Mg–xGd–3Y–0.5Zr alloy (x = 9, 11) tested within the 25 °C–300 °C range. As mentioned above, variation of Gd and Zr has no effect on the fracture mode, i.e. for all tested alloys with different Gd and Zr content, the transgranular cleavage fractures dominates at 25 °C and 200 °C, while the typical microvoid coalescence are observed at 300 °C.
IV. CONCLUSIONS
In the present study, the microstructures and high-temperature mechanical behavior of the T6 treated Mg–xGd–3Y–0.5Zr (x = 9, 10, 11) and Mg–10Gd–3Y–yZr (y = 0.3, 0.4, 0.5) alloys were investigated. The conclusions are drawn as follows:
(1) With Gd content increasing from 9 to 11%, the UTS and YS of the T6 treated Mg–xGd–3Y–0.5Zr alloys increased at same test temperatures. The Mg–11Gd–3Y–0.5Zr alloy exhibited higher UTS and YS values within the 25–300 °C range. However, the Mg–11Gd–3Y–0.5Zr alloy exhibited a lower EL of 1.84 and 4.2% at 25 and 100 °C, respectively.
(2) The increase of Zr content from 0.3 to 0.5% leads to dramatic grain refinement, and improved the tensile properties of T6 treated Mg–10Gd–3Y–yZr alloys at same tensile temperature. Meanwhile, the Mg–10Gd–3Y–0.5Zr alloy exhibited highest UTS and YS at both room and elevated temperatures.
(3) Variation of Gd and Zr has no effect on the fracture mode, and the fracture mode of T6-treated Mg–xGd–3Y–yZr alloys is mainly transgranular cleavage between 25 and 200 °C, while the typical microvoid coalescence is observed between 250 and 300 °C.
(4) EL of both Mg–xGd–3Y–0.5Zr and Mg–10Gd–3Y–yZr alloys increases monotonously with the increase of tensile temperature.
(5) Mg–10Gd–3Y–0.5Zr alloy has the optimal room temperature tensile property, i.e. UTS = 345 MPa, YS = 258 MPa, and EL = 3.5%, and can maintain its strength of more than 250 MPa up to 300 °C. The tensile testing assessment suggests that the Mg–10Gd–3Y–0.5Zr alloy is promising for structural applications at elevated temperatures.
ACKNOWLEDGMENTS
This project is sponsored by the National Natural Science Foundation of China (Nos. 51275295 and 51201102), the Shanghai Rising-Star Program (No. 14QB1403200), Research Fund for the Doctoral Program of Higher Education of China (Nos. 20120073120011 and 20130073110052).