Introduction
Neurocognitive impairment has long been recognized as a core feature of schizophrenia (Green, Reference Green1996) and is the focus of a multitude of studies. In contrast, the importance of cognitive problems in bipolar disorder (BPD) has only very recently been recognized, with the initial publications emerging in the late 1990s.
While there are considerable effects of mood state on cognition, with acutely manic or depressed patients demonstrating profound, global deficits (Daban et al. Reference Daban, Martinez-Aran, Torrent, Tabarés-Seisdedos, Balanzá-Martínez, Salazar-Fraile, Selva-Vera and Vieta2006), individuals with BPD also demonstrate persistent, trait-like, deficits during remission. Impairment is most notable in attention, verbal learning and executive function (Bora et al. Reference Bora, Yucel and Pantelis2009), with performance falling 0.5–1 s.d. below average. Moreover, as has been repeatedly shown in schizophrenia (Green, Reference Green1996; Ventura et al. Reference Ventura, Hellemann, Thames, Koellner and Nuechterlein2009; Shamsi et al. Reference Shamsi, Lau, Lencz, Burdick, DeRosse, Brenner, Lindenmayer and Malhotra2011), these cognitive deficits contribute significantly to functional disability in BPD (Martinez-Aran et al. Reference Martinez-Aran, Vieta, Torrent, Sanchez-Moreno, Goikolea, Salamero, Malhi, Gonzalez-Pinto, Daban, Alvarez-Grandi, Fountoulakis, Kaprinis, Tabares-Seisdedos and Ayuso-Mateos2007; Bowie et al. Reference Bowie, Depp, McGrath, Wolyniec, Mausbach, Thornquist, Luke, Patterson, Harvey and Pulver2010; Burdick et al. Reference Burdick, Goldberg and Harrow2010; Harvey et al. Reference Harvey, Wingo, Burdick and Baldessarini2010).
Although BPD has been characterized as an episodic illness with resultant functional recovery (Murray & Lopez, Reference Murray and Lopez1997), data emerging over the past several years have documented that neither complete symptomatic nor functional recovery is the norm (Tohen et al. Reference Tohen, Vieta, Calabrese, Ketter, Sachs, Bowden, Mitchell, Centorrino, Risser, Baker, Evans, Beymer, Dube, Tollefson and Breier2003). Early data suggest that, as in schizophrenia (Dion et al. Reference Dion, Tohen, Anthony and Waternaux1988; Abood et al. Reference Abood, Sharkey, Webb, Kelly and Gill2002; Kupfer et al. Reference Kupfer, Frank, Grochocinski, Cluss, Houck and Stapf2002), BPD patients' social, occupational and residential functioning is directly influenced by persistent symptomatology and cognitive dysfunction (Martinez-Aran et al. Reference Martinez-Aran, Vieta, Torrent, Sanchez-Moreno, Goikolea, Salamero, Malhi, Gonzalez-Pinto, Daban, Alvarez-Grandi, Fountoulakis, Kaprinis, Tabares-Seisdedos and Ayuso-Mateos2007; Bowie et al. Reference Bowie, Depp, McGrath, Wolyniec, Mausbach, Thornquist, Luke, Patterson, Harvey and Pulver2010; Burdick et al. Reference Burdick, Goldberg and Harrow2010; Depp et al. Reference Depp, Mausbach, Harmell, Savla, Bowie, Harvey and Patterson2012). These data strongly support the importance of cognitive problems in relation to quality of life in BPD and highlight the need for treatment and prevention efforts targeting cognition (Burdick et al. Reference Burdick, Braga, Goldberg and Malhotra2007). However, relatively little is known about the structure and causes of these deficits.
It is accepted that schizophrenia is characterized by some degree of cognitive heterogeneity, as demonstrated by the co-existence of a minority of cognitively unimpaired subgroup of subjects alongside the severe impairment characterizing the majority of schizophrenia subjects (Kremen et al. Reference Kremen, Seidman, Faraone, Toomey and Tsuang2000; Reichenberg et al. Reference Reichenberg, Harvey, Bowie, Mojtabai, Rabinowitz, Heaton and Bromet2009). Previous studies have reported variable performance on both specific cognitive tasks (Heinrichs & Awad, Reference Heinrichs and Awad1993; Goldstein et al. Reference Goldstein, Beers and Shemansky1996) and global measures (Seaton et al. Reference Seaton, Allen, Goldstein, Kelley and van Kammen1999; Hill et al. Reference Hill, Ragland, Gur and Gur2002). Generally, four subgroups have been described with two extreme subgroups, one with almost normal and one with profoundly impaired cognitive performance, and two intermediate subgroups, each with a moderate level of dysfunction across the cognitive domains (Goldstein et al. Reference Goldstein, Allen and Seaton1998; Seaton et al. Reference Seaton, Allen, Goldstein, Kelley and van Kammen1999; Hill et al. Reference Hill, Ragland, Gur and Gur2002). While these studies showed that cognitive heterogeneity is present in schizophrenia, relatively little is known about heterogeneity of cognitive functioning in BPD subjects.
When analysed at the group level, studies have confirmed that neurocognitive deficits are present in euthymic BPD patients but that they are significantly less severe than those reported in schizophrenia (Daban et al. Reference Daban, Martinez-Aran, Torrent, Tabarés-Seisdedos, Balanzá-Martínez, Salazar-Fraile, Selva-Vera and Vieta2006; Burdick et al. Reference Burdick, Goldberg, Cornblatt, Keefe, Gopin, Derosse, Braga and Malhotra2011). These data suggest the existence of a gradation of severity in cognitive functioning between schizophrenia and BPD along a continuum of severity, which implies that group differences in cognitive performance are quantitative rather than qualitative. The same continuum of severity may be present within each disorder; however, qualitatively distinct subgroups might also exist. Early data suggest that approximately 30–50% of BPD patients present as ‘neuropsychologically normal’ (performing similar to healthy controls) during periods of euthymia (Heinrichs & Awad, Reference Heinrichs and Awad1993; Goldstein et al. Reference Goldstein, Beers and Shemansky1996, Reference Goldstein, Allen and Seaton1998; Seaton et al. Reference Seaton, Allen, Goldstein, Kelley and van Kammen1999; Hill et al. Reference Hill, Ragland, Gur and Gur2002; Martino et al. Reference Martino, Strejilevich, Scápola, Igoa, Marengo, Ais and Perinot2008; Bora et al. Reference Bora, Yucel and Pantelis2009; Reichenberg et al. Reference Reichenberg, Harvey, Bowie, Mojtabai, Rabinowitz, Heaton and Bromet2009; Burdick et al. Reference Burdick, Goldberg, Cornblatt, Keefe, Gopin, Derosse, Braga and Malhotra2011).
A study by Altshuler et al. (Reference Altshuler, Ventura, van Gorp, Green, Theberge and Mintz2004) highlights this issue where schizophrenia patients (n = 20) were significantly impaired on nearly every cognitive task administered, while euthymic BPD patients (n = 40) had significant deficits on only two tasks: the Wisconsin Card Sorting Task (WCST) and the California Verbal Learning Test. The BPD subjects, as a group, performed intermediate between the schizophrenia and healthy controls; however, BPD patients' performance on the WCST showed a bimodal distribution, suggestive of two discrete subgroups – one with relatively normal and one with significantly impaired executive functioning (Altshuler et al. Reference Altshuler, Ventura, van Gorp, Green, Theberge and Mintz2004). This is a critical issue in understanding the etiology of cognitive impairment in BPD, yet very little is currently known about why some patients with BPD develop significant cognitive deficits while others remain cognitively intact.
Several clinical factors (i.e. bipolar subtype, history of psychosis, number of prior episodes, age at onset and duration of illness) appear to increase the likelihood of significant cognitive impairment (Martinez-Aran et al. Reference Martinez-Aran, Vieta, Torrent, Sanchez-Moreno, Goikolea, Salamero, Malhi, Gonzalez-Pinto, Daban, Alvarez-Grandi, Fountoulakis, Kaprinis, Tabares-Seisdedos and Ayuso-Mateos2007; Bora et al. Reference Bora, Yucel and Pantelis2009). Some studies indicate that BPD I patients may be more impaired than BPD II patients (Simonsen et al. Reference Simonsen, Sundet, Vaskinn, Birkenaes, Engh, Hansen, Jónsdóttir, Ringen, Opjordsmoen, Friis and Andreassen2008), yet others argue that they are similarly impaired (Dittman et al. Reference Dittmann, Hennig-Fast, Gerber, Seemüller, Riedel, Emanuel Severus, Langosch, Engel, Möller and Grunze2008; Rosa et al. Reference Rosa, Bonnín, Vázquez, Reinares, Solé, Tabarés-Seisdedos, Balanzá-Martínez, González-Pinto, Sánchez-Moreno and Vieta2010). This inconsistency may be due, in part, to psychosis in a subgroup of about 50% of BPD I patients v. much less frequent psychosis in BPD II (APA, 2000). Indeed, meta-analytic data suggest that BPD patients with psychosis perform worse than BPD patients who never experience psychosis, even during affective remission (Martinez-Aran et al. Reference Martinez-Aran, Torrent, Tabares-Seisdedos, Salamero, Daban, Balanza-Martinez, Sanchez-Moreno, Manuel Goikolea, Benabarre, Colom and Vieta2008; Bora et al. Reference Bora, Yucel and Pantelis2009). In addition the course of the illness varies considerably among BPD patients, particularly with regard to chronicity, and data suggest that more frequent severe episodes are associated with higher levels of cognitive dysfunction (Bora et al. Reference Bora, Yucel and Pantelis2009).
In the current study, we hypothesized that there would be evidence of discrete cognitive subgroups in BPD based on neurocognitive profiles. We were specifically interested in addressing this empirically to determine: (1) whether specific subgroups exist; (2) the optimal number of subgroups that explain the heterogeneity; (3) the qualitative neurocognitive profiles associated with these subgroups; and (4) the clinical and functional correlates associated with each subgroup.
Method
Participants
Patients
A total of 136 BPD out-patients were recruited at two sites: 113 from the Zucker Hillside Hospital (ZHH) – North Shore Long Island Jewish Health System; and 23 patients from the Icahn School of Medicine at Mount Sinai. Inclusion criteria were: (1) diagnosis of BPD I or BPD II; (2) age 18–65 years; (3) current affective stability [<12 on the Hamilton Rating Scale for Depression (HAMD; Hamilton, Reference Hamilton1960); and <8 on the Clinician-Administered Rating Scale for Mania (CARS-M; Altman et al. Reference Altman, Hedeker, Janicak, Peterson and Davis1994)]. Exclusion criteria were: (1) history of central nervous system (CNS) trauma, neurological disorder, or attention deficit hyperactivity disorder; (2) diagnosis of recent substance abuse/dependence (past 3 months); and (3) electroconvulsive therapy (ECT) in the past 12 months.
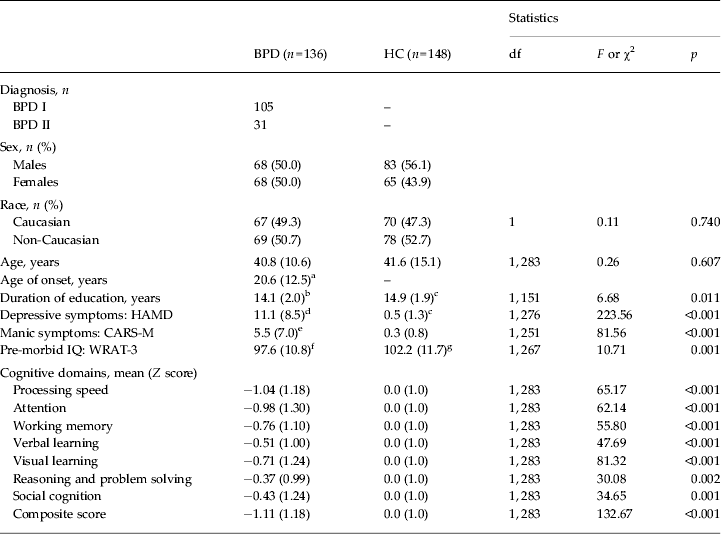
A total of 105 patients were diagnosed with BPD I [n = 60 (57.1%) with psychotic features] and 31 with BPD II [n = 9 (29%) with psychotic features] based upon the Structured Clinical Interview for DSM-IV (SCID) and confirmed by a consensus panel. The mean age at the time of the assessment was 40.8 (s.d. = 10.6) years, 50.0% (n = 68) were female, and 49.3% (n = 67) were Caucasian. The mean pre-morbid intelligence quotient (IQ) (Wide Range Achievement Test; WRAT-3; Wilkinson, Reference Wilkinson1993) was = 97.6 (s.d. = 10.8). The mean HAMD score (current depression) was 11.1 (s.d. = 8.5) and the mean CARS-M (current mania) was 5.5 (s.d. = 7.0), indicative of affective stability.
A total of 148 healthy controls (HCs) with no evidence of Axis I disorders (SCID) were recruited through advertisements at ZHH. Mean age was 41.58 (s.d. = 15.1) years, 43.9% (n = 65) were female, 47.3% (n = 70) were Caucasian, and the mean pre-morbid IQ was 102.16 (s.d. = 11.7). There were no significant differences between patients and controls (Table 1) in terms of age, sex or race (all p > 0.05), while a difference was detected for pre-morbid IQ (F 1,267 = 10.71, p = 0.001).
Demographic, clinical and cognitive characteristics of the BPD patients and HC subjects

Data are given as mean (standard deviation).
BPD, Bipolar disorder; HC, healthy control; df, degrees of freedom; HAMD, Hamilton Rating Scale for Depression; CARS-M, Clinician-Administered Rating Scale for Mania; IQ, intelligence quotient; WRAT-3, Wide Range Achievement Test.
a n = 109; b n = 84; c n = 68; d n = 129; e n = 104; f n = 121; g n = 147.
Measuring neurocognitive functioning
The MATRICS Consensus Cognitive Battery (MCCB; Nuechterlein et al. Reference Nuechterlein, Green, Kern, Baade, Barch, Cohen, Essock, Fenton, Frese, Gold, Goldberg, Heaton, Keefe, Kraemer, Mesholam-Gately, Seidman, Stover, Weinberger, Young, Zalcman and Marder2008; Matrics Assessment Inc., USA) was used to measure neurocognitive functioning. The MCCB was originally developed to be used in clinical trials targeting cognition in schizophrenia; however, recent studies demonstrated its suitability to effectively capture neurocognitive deficits in BPD patients (Yatham et al. Reference Yatham, Torres, Malhi, Frangou, Glahn, Bearden, Burdick, Martínez-Arán, Dittmann, Goldberg, Ozerdem, Aydemir and Chengappa2010; Burdick et al. Reference Burdick, Goldberg, Cornblatt, Keefe, Gopin, Derosse, Braga and Malhotra2011). The MCCB is composed of several individual tests that give rise to seven cognitive domains:
-
(1) Processing speed (Brief Assessment of Cognition in Schizophrenia and Trail Making Test-A);
-
(2) Attention/vigilance (Continuous Performance Test–Identical Pairs);
-
(3) Working memory (Wechsler Memory Scale: Spatial Span Letter-Number Span);
-
(4) Verbal learning (Hopkins Verbal Learning Test–Revised);
-
(5) Visual learning (Brief Visuospatial Memory Test–Revised);
-
(6) Reasoning and problem solving (Neuropsychological Assessment Battery Mazes);
-
(7) Social cognition (Mayer–Salovey–Caruso Emotional Intelligence Test).
The battery was completed in a single session of about 70 min.
Measuring clinical features and functional disability
For a subsample of patients (sample sizes in tables) data on current symptoms, history of psychosis, number of mood episodes and lifetime history of co-morbid substance use disorders were collected using the SCID interview and standardized mood ratings.
A comprehensive functional outcome evaluation was done using the Multidimensional Scale of Independent Functioning (MSIF; Jaeger et al. Reference Jaeger, Berns and Czobor2003) and the Social Adjustment Scale-II (SAS-II; Schooler et al. Reference Schooler, Hogarty, Weissman, Hargreaves, Attkisson and Sorenson1979). The MSIF is able to separate out the contribution of role position, level of support, and adequacy of performance, providing anchors for rating functioning in work and residential domains. The SAS-II assesses social functioning through use of a semi-structured interview, resulting in a social/leisure rating. Higher scores on each of these scales correspond to worse community functioning.
Statistical analysis
Initial analyses were carried out to compare demographic and clinical characteristics, and cognitive performance of the BPD patients and HCs using analysis of variance (ANOVA) and χ2 as appropriate (Table 1). All cognitive data were standardized to a Z-scale score with a mean of 0 and s.d. of 1, based upon the HCs' performance.
In order to identify homogeneous subgroups of BPD patients based on their cognitive performance, we conducted a hierarchical cluster analysis. Similarity between cases was computed with the squared Euclidian distance and the Ward linkage was selected as the agglomeration procedure. Since the variables (scores for each MCCB domain) had the same metrics (t-scores with a mean of 50 and s.d. of 10) no pre-standardization was necessary. The inspection of the dendogram was used as criterion to establish the appropriate number of clusters to retain. Therefore in a second step of the analysis the model was forced to include a meaningful number of clusters (deduced from the dendogram) and cluster membership was saved as a grouping variable. Stability of the clusters was ascertained by repeating the hierarchical cluster analysis in a split half of the sample. Then in order to test the validity of the clusters and to have a better understanding of the relationship between cognition and allocation of BPD patients into specific clusters, we conducted a discriminant function analysis (DFA). The DFA explored the predictive power of each of the seven MCCB domains in differentiating subjects into the discrete neurocognitive groups obtained from the hierarchical cluster analysis. The neurocognitive profiles of the BPD clusters and HCs were then compared using an ANOVA. Planned contrasts using the HC group as a comparison category was done to detect differences between groups and results were corrected for multiple comparisons with least significant difference (LSD) correction. We acknowledge that the clustering procedures were applied with the intent to separate the BPD sample into subgroups based on cognitive performance; therefore, it would follow that secondary testing for subgroup differences would be significant. The purpose of these analyses was not to prove that differences exist between the BPD subgroups. Rather, we carried out these analyses specifically in an effort to determine the degree of impairment versus HCs, to illustrate the qualitative differences among the BPD clusters, and to allow for a visualization of the profiles by subgroup.
Finally, to begin to understand the clinical and functional correlates of cluster membership, descriptive analyses (ANOVA and χ2 applied as appropriate) were carried out to investigate differences on demographic characteristics, clinical features, and functional disability between the identified BPD clusters.
Results
Results from the ANOVA revealed that BPD patients (full sample) had significantly worse performance than HCs on all seven of the MCCB domains and on the MCCB composite score (all p < 0.002; Table 1). These data are consistent with prior work from our group (Burdick et al. Reference Burdick, Braga, Goldberg and Malhotra2007) and others (Bora et al. Reference Bora, Yucel and Pantelis2009) and suggest that our BPD sample is representative of other samples in previous studies of neurocognition.
Clustering BPD patients
Results from the hierarchical cluster analysis showed that the 136 BPD patients are optimally clustered (according to MCCB performance) into three discrete subgroups. The first cluster included 54 subjects (39.7%), the second cluster included 43 individuals (31.6%) and the third cluster included 39 subjects (28.7%).
To test the validity of these clusters, approximately 50% of the 136 BPD patients (n = 65) from the original sample were randomly selected and hierarchical cluster analysis was repeated on the split-half sample. Results were consistent with the initial analysis with the emergence of three clusters in the split sample. The ANOVA revealed no statistically significant differences between the two split samples in term of age, sex, diagnosis and neurocognitive performance.
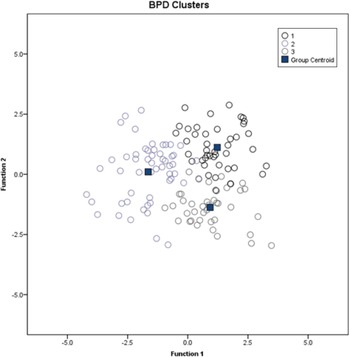
Results from the DFA using the three BPD clusters revealed the presence of two discriminant functions explaining 65.6% and 34.4% of the variance, respectively (Wilks' λ = 0.18, χ2 14 = 223.25, p < 0.001; after removal of the first function the Wilk's λ = 0.51, χ2 6 = 87.63, p < 0.001). Visual learning and working memory domains showed the strongest correlation coefficients (0.78 and 0.51, respectively), suggesting that they contributed more than the other cognitive domains to classify subjects into neurocognitive clusters. Subjects grouping into the three neurocognitive clusters are shown in Fig. 1.
Graphical agglomeration of bipolar disorder (BPD) subjects using discriminant function analysis. The figure represents the agglomeration of subjects using the three clusters emerged from the hierarchical cluster analysis. The centroids (■) are the mean score for each cluster. Cluster 1 is the global impairment group, cluster 2 is the selective impairment group and cluster 3 is the intact group (see text).

Comparison between BPD clusters and HCs on neurocognitive functioning
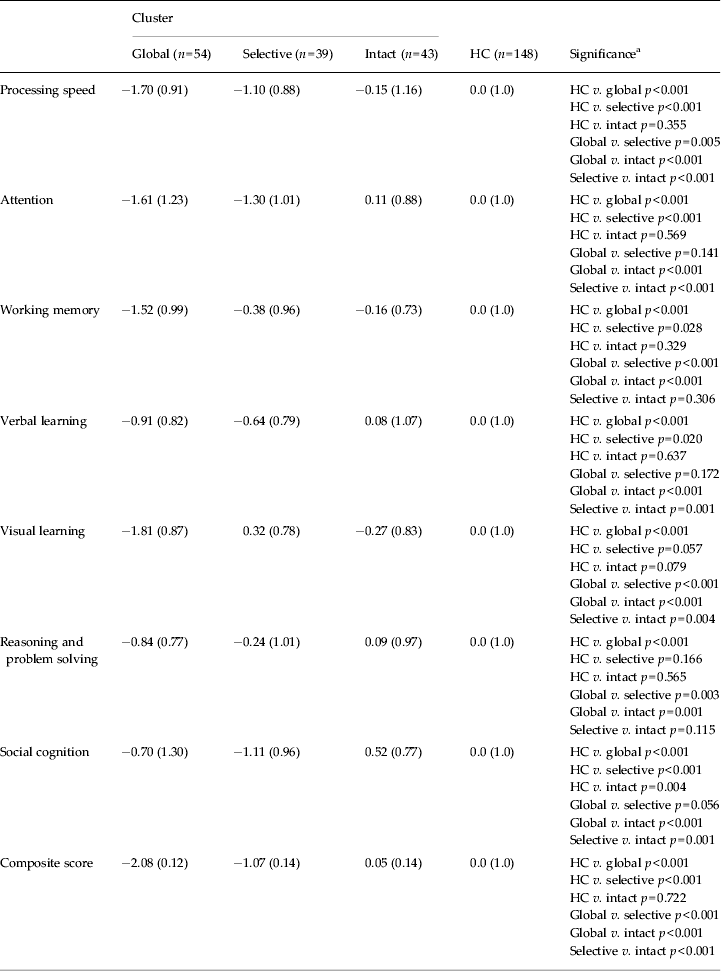
Multivariate ANOVA revealed a significant main effect of group when comparing the three BPD clusters and HCs (F 21,828 = 15.30, p < 0.001) (Table 2). Based on the level of cognitive impairment, the BPD clusters were labeled as follows:
Comparison between the three neurocognitive bipolar disorder clusters and HC subjects across cognitive domains (Z scores)

Data are given as mean (standard deviation).
HC, Healthy control.
a All p values are adjusted for multiple comparisons with least significant difference (LSD) correction.
Cluster 1, the global impairment group (global), presented with diffuse and severe cognitive dysfunction, with performance falling between 1 and 2 s.d.s below the HCs' mean;
Cluster 2, the selective impairment group (selective), presented with more modest deficits on specific domains, with performance ranging between normal and –1 s.d. below average;
Cluster 3, the intact group (intact), performed comparably to HCs on all domains (all p values > 0.07), with significantly superior performance v. HCs on social cognition (p = 0.004) (Table 2).
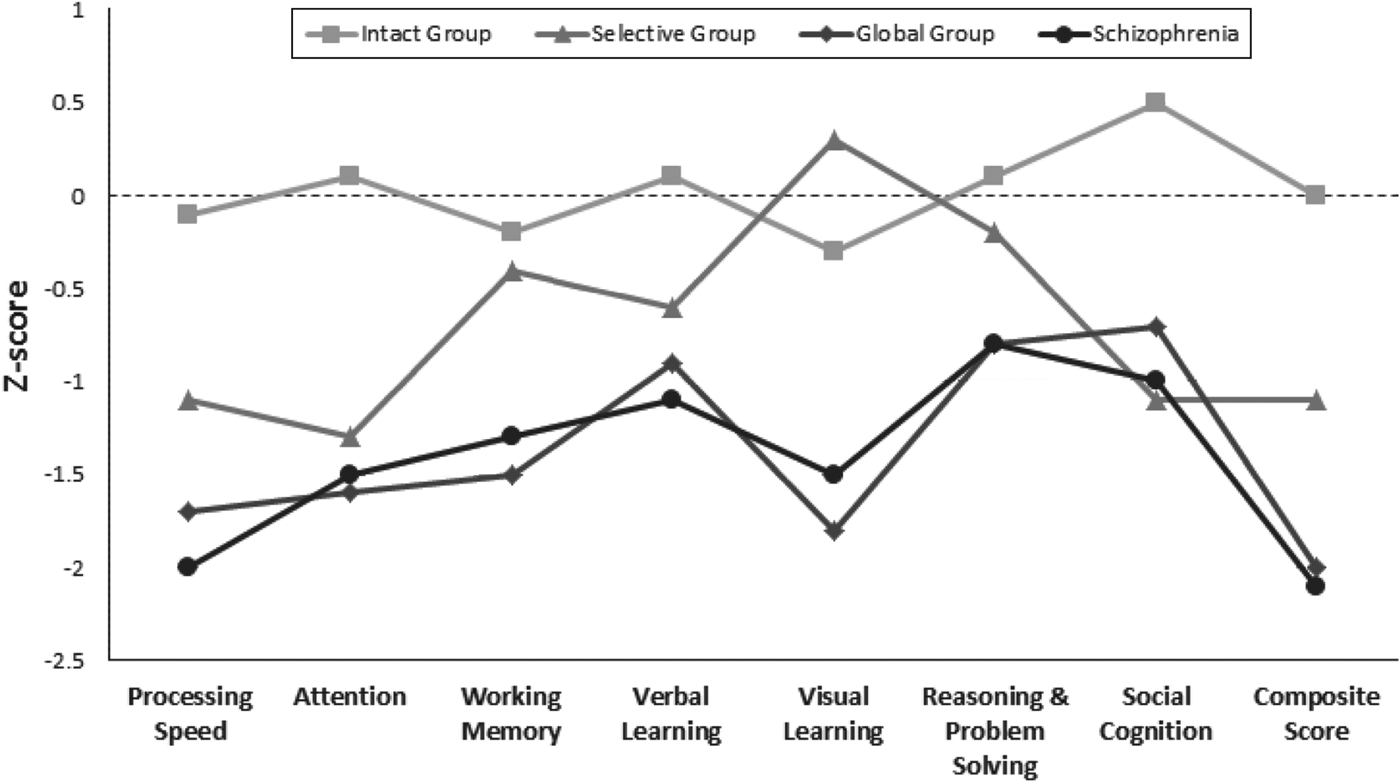
Fig. 2 illustrates the cognitive profiles of the three BPD clusters and the schizophrenia sample. Z scores were computed based upon our HC sample instead of using the MCCB normative sample, as our HCs were demographically matched to our BPD sample on demographic characteristics (see Table 1) than the community sample used for standardization of the MCCB battery (Kern et al. Reference Kern, Nuechterlein, Green, Baade, Fenton, Gold, Keefe, Mesholam-Gately, Mintz, Seidman, Stover and Marder2008).
Neurocognitive profiles of bipolar disorder clusters and the schizophrenia sample. The X-axis indicates the MATRICS Consensus Cognitive Battery (MCCB) domains. The Y-axis depicts a Z-scale score with a mean of 0 and a standard deviation of 1. Z scores were computed based upon the healthy control sample. Patients are divided into lines based on scoring for each cognitive domain. Statistical comparisons among groups are specified in Table 2.

After LSD correction for multiple testing, the global group performed significantly worse than HCs across all cognitive domains. The selective group performed significantly worse than HCs on all domains except for visual learning and reasoning and problem solving. The intact group performed within the normal range for all domains v. HCs, apart from social cognition (p = 0.004) where intact BPD subjects scored significantly higher than HCs (Table 2).
For purposes of reference to the severity of cognitive impairment noted in schizophrenia, we have included in Fig. 2 data from a sample of 185 schizophrenia patients ascertained at ZHH using the same recruitment procedures as were used for the BPD sample selection. The mean age at the time of the assessment was 42.9 years (s.d. = 1 0.1), mean age at onset was 19.5 years (s.d. = 8.7), and, on average, schizophrenia subjects had 12.7 years (s.d. = 2.8) of education. Of the subjects, 57 (31.5%) were female and 77 (42.5%) were Caucasian. The mean pre-morbid IQ (WRAT-3) was = 90.8 (s.d. = 12.7) and the mean depressive symptoms score (as measured by the HAMD) was 10.4 (s.d. = 7.0). Additional details regarding the schizophrenia sample have been previously described and published (Shamsi et al. Reference Shamsi, Lau, Lencz, Burdick, DeRosse, Brenner, Lindenmayer and Malhotra2011).
When comparing the global BPD group with the schizophrenia patients, the two groups did not differ on six of seven of the cognitive domains, nor did they differ on the MCCB composite score (all p < 0.09). The only exception was for social cognition where the BPD global group outperformed the schizophrenia group [mean −0.70 (s.d. = 1.30) v. −1.06 (s.d. = 1.16)].
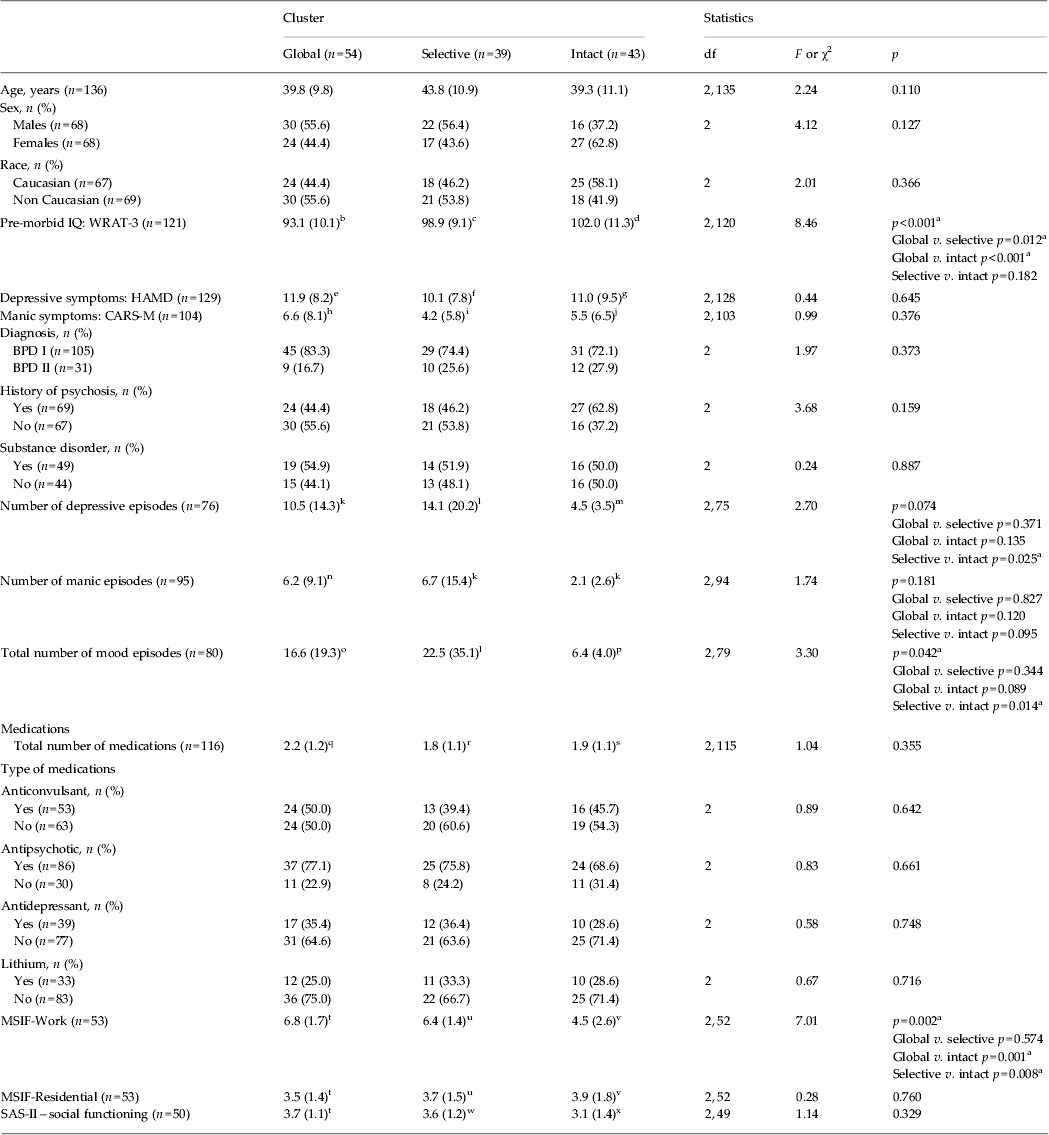
Non-cognitive characteristics of the three BPD clusters (Table 3)
The three clusters did not differ on age, sex or race distributions; however, there were significant group differences for pre-morbid-IQ (F 2,120 = 8.46, p < 0.001), with post-hoc tests indicating significant group differences between the global group and each of the other two clusters. There was no difference between the selective group and the intact group. As might be expected, subjects in the global group had the lowest pre-morbid IQ.
Demographic and clinical characteristics of BPD clusters

Data are given as mean (standard deviation).
BPD, Bipolar disorder; df, degrees of freedom; IQ, intelligence quotient; WRAT-3, Wide Range Achievement Test; HAMD, Hamilton Rating Scale for Depression; CARS-M, Clinician-Administered Rating Scale for Mania; MSIF, Multidimensional Scale of Independent Functioning; SAS-II, Social Adjustment Scale-II.
a p Values are adjusted for multiple comparisons with least significant difference (LSD) correction. b n = 47. c n = 36. d n = 38. e n = 49. f n = 37. g n = 38. h n = 38. i n = 30. j n = 36. k n = 29. l n = 23. m n = 24. n n = 37. o n = 31. p n = 26. q n = 48. r n = 33. s n = 35. t n = 20. u n = 15. v n = 18. w n = 13. x n = 17.
There were no significant differences for depressive or manic symptoms at the time of assessment. Diagnostic subtype distributions (BPD I v. BPD II) did not differ by cognitive group; nor did psychosis history (p = 0.373 and p = 0.159, respectively). There was no significant difference with regard to history of substance use disorder (inclusive of alcohol/drug abuse/dependence; p = 0.887).
There was a main effect of group on total number of prior episodes (including both depressive and manic; p = 0.042); post-hoc testing revealed significant differences between the intact and selective groups (p = 0.014) and a trend-level difference between the global and intact groups (p = 0.089). The selective group had the highest number of prior episodes but did not significantly differ from the global group (p = 0.344). Likewise, while there was no main effect of group with regard to total number of previous depressive episodes (p = 0.074), post-hoc results were significantly different between the intact and selective groups (p = 0.025), with selective group subjects reporting the highest number of prior depressive episodes. There was no main effect of group on prior number of manic episodes (p = 0.181) and no post-hoc group differences. There were no differences between the clusters on total number of medications or the types of medications prescribed.
When evaluating the influence of cluster membership on everyday functions, we found a significant main effect of group for MSIF occupational status (p = 0.002), with significant post-hoc differences: global v. intact (p = 0.001); selective v. intact (p = 0.008). There were no significant effects on independent living status or social functioning.
Discussion
A convergence of anecdotal and clinically based evidence suggests that there is substantial heterogeneity in neurocognition and functional capacity in BPD patients. In this paper, we provide empirical support for statistically discrete neurocognitive subgroups in BPD, characterizing the structure of this heterogeneity.
Previous work has consistently shown that, as a group, remitted BPD patients are impaired about 0.5 to 1 s.d. below average, particularly on attention, verbal learning and executive functioning (Bora et al. Reference Bora, Yucel and Pantelis2009). While this level of impairment is considered modest, particularly in light of considerably more severe deficits in schizophrenia, these data fail to account for the substantial cognitive heterogeneity in BPD. Early data suggest that only a small proportion of patients with schizophrenia are considered ‘neuropsychologically normal’ (Wilk et al. Reference Wilk, Gold, McMahon, Humber, Iannone and Buchanan2005; Kremen et al. Reference Kremen, Seidman, Faraone and Tsuang2008), while nearly half of all BPD patients function within the average range (Martino et al. Reference Martino, Strejilevich, Scápola, Igoa, Marengo, Ais and Perinot2008; Bora et al. Reference Bora, Yucel and Pantelis2009; Reichenberg et al. Reference Reichenberg, Harvey, Bowie, Mojtabai, Rabinowitz, Heaton and Bromet2009). Thus, prior group-based analyses comparing these two samples may have failed to capture the extent of the impairment that is present in a specific subgroup of BPD patients. Indeed, our data strongly support this notion.
Using hierarchical cluster analyses, we found evidence for three distinct, cognitively homogeneous subgroups in an unselected sample of 136 BPD patients. Specifically we found: (1) a cluster of BPD patients with normal cognitive functioning (intact group; 31.6% of the sample) who do not differ from demographically matched HCs; (2) a cluster of BPD patients whose cognitive profile is consistent with selective impairment (selective group 28.7% of the sample), with modest deficits on only a subset of the seven cognitive domains v. HCs; and (3) a cluster of BPD patients (global group; 39.7% of the sample) with severe impairment across all cognitive domains.
The emergence of an intact group is consistent with prior reports that used a −1 s.d. cut-off to define clinically significant impairment and found that approximately 40% of BPD patients were characterized as unimpaired (Reichenberg et al. Reference Reichenberg, Harvey, Bowie, Mojtabai, Rabinowitz, Heaton and Bromet2009). Our data expand upon this to show that there is a specific subgroup that not only fail to meet this threshold of impairment but indeed do not differ from HCs on any of the MCCB cognitive domains. Moreover, in line with the anecdotal evidence of a high-performing, socially savvy BPD subgroup, we found that the intact group was actually superior to our HCs on the MCCB social cognition domain. In addition, the global group performed better than the schizophrenia group on social cognition although their cognitive profiles were comparable across all the other domains. This result is consistent with a very recent study (Lee et al. Reference Lee, Altshuler, Glahn, Miklowitz, Ochsner and Green2013) showing that social cognition in BPD is relatively intact. Lee et al. (Reference Lee, Altshuler, Glahn, Miklowitz, Ochsner and Green2013) showed that BPD patients did not significantly differ from the comparison group on any social cognitive task and that BPD subjects performed significantly better on social compared with non-social domains, while the opposite pattern emerged in schizophrenia patients. Although our findings support the presence of less severe impairment in social cognition compared with other domains in BPD patients when considered at a group level, it might also suggest the potential for meaningful subgroups based upon social cognitive performance within BPD. Future studies including a more extensive social cognitive battery will be needed to expand upon these results in order to determine whether social cognition can be considered a key determinant of poor functional outcome for those subgroups of BPD patients showing very severe cognitive deficits.
Subjects who were clustered into the selective group were characterized by a profile similar to that which is commonly noted in BPD group-level data. Deficits were noted on some but not all cognitive domains (intact visual learning and reasoning and problem solving) and were generally in the mild to moderate range.
The globally impaired group (global group) showed a generalized pattern of impairment with significant deficits on all cognitive domains when compared with HCs. Deficits in the global group were severe, ranging from −1 to −2 s.d.s below the mean performance of a HC sample, directly comparable with the impairment in our schizophrenia cohort (Shamsi et al. Reference Shamsi, Lau, Lencz, Burdick, DeRosse, Brenner, Lindenmayer and Malhotra2011) (see Fig. 2) and in other samples of schizophrenia patients (Harvey & Serper, Reference Harvey and Serper1990; Heinrichs & Zakzanis, Reference Heinrichs and Zakzanis1998). This overlapping profile is of critical importance when considering recent data supporting shared molecular genetic risk factors for BPD and schizophrenia (Lichtenstein et al. Reference Lichtenstein, Yip, Björk, Pawitan, Cannon, Sullivan and Hultman2009; Williams et al. Reference Williams, Craddock, Russo, Hamshere, Moskvina, Dwyer, Smith, Green, Grozeva, Holmans, Owen and O'Donovan2011). As illustrated in Fig. 2 the global measure of cognition (MCCB composite score) would suggest a continuum of severity across the full range of major psychiatric disease, such that all patients, regardless of diagnosis, could be characterized by mild, moderate or severe impairment. The overlap between the global BPD group and patients with schizophrenia argues that BPD patients do not simply lie intermediate between HCs and schizophrenia on this cognitive continuum. Moreover, when taking into account the performance on specific domains, the presence of qualitative differences across the three BPD clusters supports the existence of meaningfully unique subgroups within the illness.
The three BPD clusters did not differ with regard to age, sex or race distribution; however, pre-morbid IQ estimates were significantly different by group. The global group had the lowest pre-morbid IQ and although it was still considered to be within the normal range, it was significantly lower than each of the other two BPD clusters and the HCs. The other two BPD clusters did not differ from one another, nor were they different from the HCs. This suggests that lower IQ prior to the onset of BPD might place a patient at increased risk for developing more severe and generalized neurocognitive deficits in the context of the illness. This is consistent with mild pre-morbid deficits seen in patients with schizophrenia (Woodberry et al. Reference Woodberry, Giuliano and Seidman2008) and could be conceptualized in reference to the cognitive reserve theory, where higher cognitive capacity could serve as protective against decline (Stern, Reference Stern2012). Longitudinal studies will be important to address this hypothesis.
Prior evidence suggests that diagnostic subtype within BPD may influence the extent of cognitive dysfunction; however, our data did not support this finding. The distribution of BPD I v. BPD II was comparable in all groups, as was the psychotic subtype of the illness. The lack of significant findings in our sample could be due to limited statistical power but it also speaks to the inconsistencies reported in previous studies (Dittmann et al. Reference Dittmann, Hennig-Fast, Gerber, Seemüller, Riedel, Emanuel Severus, Langosch, Engel, Möller and Grunze2008; Simonsen et al. Reference Simonsen, Sundet, Vaskinn, Birkenaes, Engh, Hansen, Jónsdóttir, Ringen, Opjordsmoen, Friis and Andreassen2008) and the relative paucity of data on neurocognitive functioning across the entire BPD spectrum (Sole et al. Reference Sole, Bonnin, Torrent, Martinez-Aran, Popovic, Tabarés-Seisdedos and Vieta2012). As has been shown in several previous studies, the total number of affective episodes was related to neurocognitive impairment in our sample. We found that the selective group had the highest number of total episodes, including both depressive and manic polarities, with the global group falling intermediate to the selective and intact groups. These data further support the deleterious and potentially cumulative effects of full-blown affective episodes on neurocognitive functioning in BPD (Bora et al. Reference Bora, Yucel and Pantelis2009).
Although data were only available in a subset of the sample, thereby limiting our interpretation of these findings, our data also suggest that there are meaningful group differences with regard to everyday functioning in the community. Specifically we found that BPD patients in the global group were significantly more occupationally disabled than patients who were either in the selective or intact groups. These data are consistent with several prior reports that indicate that neurocognitive impairment is an important predictor of functional disability across many psychiatric disorders (Bowie et al. Reference Bowie, Depp, McGrath, Wolyniec, Mausbach, Thornquist, Luke, Patterson, Harvey and Pulver2010) including BPD (Depp et al. Reference Depp, Mausbach, Harmell, Savla, Bowie, Harvey and Patterson2012; Martinez-Aran et al. Reference Martinez-Aran, Vieta, Torrent, Sanchez-Moreno, Goikolea, Salamero, Malhi, Gonzalez-Pinto, Daban, Alvarez-Grandi, Fountoulakis, Kaprinis, Tabares-Seisdedos and Ayuso-Mateos2007; Burdick et al. Reference Burdick, Goldberg and Harrow2010) and suggest that these clusters may have direct functional relevance.
As the MCCB was initially designed for assaying cognition in schizophrenia, the use of a more comprehensive, bipolar-specific, neurocognitive battery (e.g. Yatham et al. Reference Yatham, Torres, Malhi, Frangou, Glahn, Bearden, Burdick, Martínez-Arán, Dittmann, Goldberg, Ozerdem, Aydemir and Chengappa2010) may have resulted in the emergence of different subgroups. Future studies including a larger number of tasks and measures of affective processing will be important in establishing and refining these profiles.
This is the first study describing the presence of empirically derived neurocognitive subgroups in BPD. The potential downstream implications of our findings are two-fold. By subgrouping BPD patients based on neurocognitive profiles we can reduce the heterogeneity of the phenotype to allow for a more targeted assessment of clinical and biological predictors of cognitive impairment in BPD. The identification of specific biomarkers and clinical factors that are associated with specific neurocognitive profiles will allow for the tailoring of treatments to correct the cognitive dysfunction in BPD. Preventative and early intervention strategies might also be suggested based upon future studies utilizing this approach.
Acknowledgements
Financial support for this work included grants from the National Institute of Mental Health (NIMH) to K.E.B. (K23MH077807; R01MH100125) and to A.K.M. (R01MH079800).
Declaration of Interest
K.E.B. has served on an advisory board for Dainippon Sumitomo Pharma. A.K.M. has served as consultant or speaker for Bristol-Myers Squibb, Merck, AstraZeneca, Vanda Pharmaceuticals and Clinical Data Inc., and has received research support from Pfizer, Janssen Pharmaceuticals, Bristol-Myers Squibb and Eli Lilly. S.F. serves on advisory boards for Enzymotec and Janssen-Cilag.