I. INTRODUCTION
The demand for low optical loss transparent ceramics for applications such as laser-gain media,Reference Sanghera, Kim, Villalobos, Shaw, Baker, Frantz, Sadowski and Aggarwal1,Reference Richardson and Gaume2 scintillators,Reference Wang, Baldoni, Rhodes, Brecher, Shaha, Shirwadkara, Glodoa, Cherepyc and Payne3 and advanced optical componentsReference Krell, Klimke and Hutzler4,Reference Dericioglu, Boccaccini, Dlouhy and Kagawa5 requires the ability to control the phase composition of multinary materials along with their microstructures. In this respect, the problem of stoichiometry, or more accurately the problem of deviation from stoichiometry, is one of the most critical issues pertaining to the fabrication of high-grade transparent ceramics. Within the phase stability domain of a given multinary compound, departure from the nominal composition leads to the formation of point defects until the solid-solubility limit is exceeded and secondary phases start segregating. Point defects and precipitates not only control the sintering kinetics and final densification state of the ceramics but also affect their optical properties by introducing color centers, charge-carrier trapping sites,Reference Zhu, Zhang, Liu, Huang, Wang, Chen, Man and Zhao6,Reference Shluger, McKenna, Sushko, Munoz Ramo and Kimmel7 and scattering centers.Reference Boulesteix, Maître, Baumard, Rabinovitch and Reynaud8 The ‘inexplicable’ nonreproducibility of high-quality transparent ceramic fabrication, that one comes to experience with certain materials, is closely related to investigating the nature and effect of these intrinsic defects on the sintering behavior and optical properties and measuring small excess of major elements with accuracies better than 0.1 mol%. While modern analytical techniques are commonly used to determine impurity concentrations down to ppm or ppb levels, there is, at present, no simple and direct method in scientific practice for determining deviation from stoichiometry in insulator materials except for precision measurement of crystal lattice parameters by x-ray diffraction. In the case of the extensively studied yttrium aluminum garnet Y3Al5O12 (YAG) for example, this technique showed, in conjunction with atomistic modeling, that the phase stability domain extends ∼0.2 mol% on the Al2O3 side and ∼0.8 mol% on the Y2O3 side at a temperature of 1750 °C, a temperature corresponding to typical sintering conditions.Reference Patel, Stanek and Grimes9 The incorporation of excess Y2O3 or Al2O3 in the solid-solution domain proceeds by the formation of antisite defects according toReference Patel, Stanek and Grimes9,Reference Patel, Levy, Grimes, Gaume, Feigelson, McClellan and Stanek10
 $$4{{\rm{Y}}_2}{{\rm{O}}_3} + 5{\rm{Al}}_{{\rm{Al}}}^{\rm{X}} \leftrightarrow 5{\rm{Y}}_{{\rm{Al}},{\rm{a}}}^{\rm{X}} + {{\rm{Y}}_3}{\rm{A}}{{\rm{l}}_5}{{\rm{O}}_{12}}\quad ,$$
 $$4{\rm{A}}{{\rm{l}}_2}{{\rm{O}}_3} + 3{\rm{Y}}_{\rm{Y}}^{\rm{X}} \leftrightarrow 3{\rm{Al}}_{\rm{Y}}^{\rm{X}} + {{\rm{Y}}_3}{\rm{A}}{{\rm{l}}_5}{{\rm{O}}_{12}}\quad .$$
These antisite defects alter the phonon energy spectrum of the lattice, so that infrared (IR) and Raman spectroscopies would seem appropriate techniques to quantify any compositional changes associated to departure from stoichiometry. With 8 formula units per cell, YAG crystallizes with a cubic body-centered Ia-3d (Oh) space group. The yttrium ions occupy 24 c sites with dodecahedral coordination, and the aluminum ions occupy 16 a sites with octahedral coordination and 24 d sites with tetrahedral oxygen coordination. These 160 atoms per unit cell produce 18 phonon branches: 17 optical and 1 acoustic, all of which of T1u representation.Reference McDevitt11,Reference Hurrell, Porto, Chang, Mitra and Bauman12 Unfortunately, both IR and Raman techniques suffer from relatively poor signal-to-noise ratios at frequencies lower than a few terahertz (<150 cm−1), the spectral region mostly affected by antisite defects in YAG.Reference Goel, Mittal, Choudhury and Chaplot13
In this paper, we characterize the terahertz absorption of single crystals and optical ceramics of YAG in the range of 0.06–2.8 THz and investigate the potential of the time-domain terahertz spectroscopy (THz-TDS) technique for the direct analysis of YAG intrinsic defects. Despite several reports on the effect of extrinsic dopants on the terahertz absorption of rare-earth doped YAG single crystals,Reference Papagelis, Kanellis, Zorba, Ves and Kourouklis14–Reference Chiriu, Ricci, Carbonaro, Anedda, Aburish-Hmidat, Grosu, Lorrai and Fortin17 the effect of intrinsic point defects associated to nonstoichiometry in this region of the electromagnetic spectrum has never been specifically addressed, either theoretically or experimentally.
II. EXPERIMENTAL
A. Sample preparation
YAG ceramic samples with different compositions near stoichiometry were produced by blending raw aluminum oxide and yttrium oxide powders. Submicrometer α-Al2O3 and Y2O3 powders were used to prepare an initial yttria-deficient batch. The powders were homogenized by wet ball milling in ethanol in a polyethylene bottle for 8 h with 5 mm diameter alumina balls. Tetraethoxysilane was added to the slurry 0.5 wt% to serve as a sintering aid. After ball milling, the slurry was dried and the powder was stored for a week in an oven at 80 °C. Aliquots of this mixture 4 g were then sampled, mixed, and ground with different and carefully controlled quantities of Y2O3 to ensure a series of 20 samples with exact compositions ranging from +0.96 to −0.62 mol% Y2O3 above and below the garnet stoichiometry. The samples were uniaxially pressed into 12.7 mm diameter pellets at 20 MPa, and cold isostatically pressed at 200 MPa. The pellets were then sintered in a vacuum tungsten-mesh heated furnace at 1750 °C under 10−6 Torr and then hot isostatically pressed at 1700 °C for 2 h. The samples were annealed in air at 1400 °C for 3 h. All the cooling rates used were faster than 15 °C/min to minimize the precipitation of secondary phases. Finally, the samples were thinned down to 1 mm and surfaces were polished using SiC abrasive media, followed by polishing with a diamond-impregnated polymer film to achieve an optical grade surface finish. All ceramic samples were translucent to transparent, at stoichiometry, with optical attenuations better than 2 cm−1.
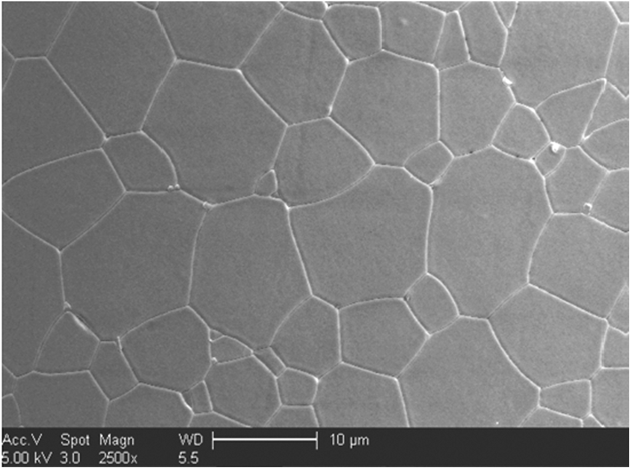
The ceramic samples have a uniform microstructure with an average grain size of 10 ± 2 µm, determined by scanning electron microscopy (SEM) analysis using the American Society for Testing and Materials (ASTM) E112 standard protocol. For comparison purposes, 1-mm-thick undoped and 1 at.% Nd doped YAG single crystals (Scientific Materials Co.) were added to the set of samples analyzed in this study (Fig. 1).
SEM micrograph of the polished and etched YAG ceramic.

B. THz-TDS
All samples were characterized using a THz-TDS (TPS Spectra 3000, Teraview, Cambridge, UK), which has an 8-F configuration and a useable bandwidth extending from 0.06 to 4 THz. The samples were attached to a mechanical holder with a 3.5-mm-diameter optical aperture, while another identical clear hole was used as a reference. Both sample and reference were centered over the 3.5 mm THz beam waist alternatively to ensure the entire frequency component passing through the sample and reference. The measurement chamber was purged with a 5 L/min flow of dry nitrogen until the disappearance of terahertz water vapor absorption lines. Absorption measurements as a function of temperature were carried out in a temperature-controlled cell in which the samples were held under vacuum. A 60-min thermal equilibration time was allowed before all measurements. The transmitted electric field of the pulses through the sample and of the reference was recorded in time domain and the corresponding frequency spectra were obtained by numerical Fourier transform.Reference Lee18 Due to the limited thickness of the samples, the main transmitted terahertz pulse through the sample is trailed by multiple-reflected pulses in time domain. However, the clean separation between the main transmitted terahertz pulse and the first internal reflection enabled us to perform data analysis on the main pulse only. To increase the signal-to-noise ratio, every pulse curve is the average of five individual measurements from which the complex dielectric function and the absorbance of the samples were deduced. The complex spectrum of the transmitted sample pulse E s can be expressed in terms of the reference spectrum E ref and the transmission asReference Zhang, Azad and Grischkowsky19
 $${E_{\rm{s}}}\left( \omega \right) = {E_{{\rm{ref}}}}\left( \omega \right){t_{12}}{t_{21}}{e^{iL\left( {k - {k_0}} \right)}}{e^{ - \alpha {L \mathord{\left/ {\vphantom {L 2}} \right. \kern-\nulldelimiterspace} 2}}}\quad ,$$
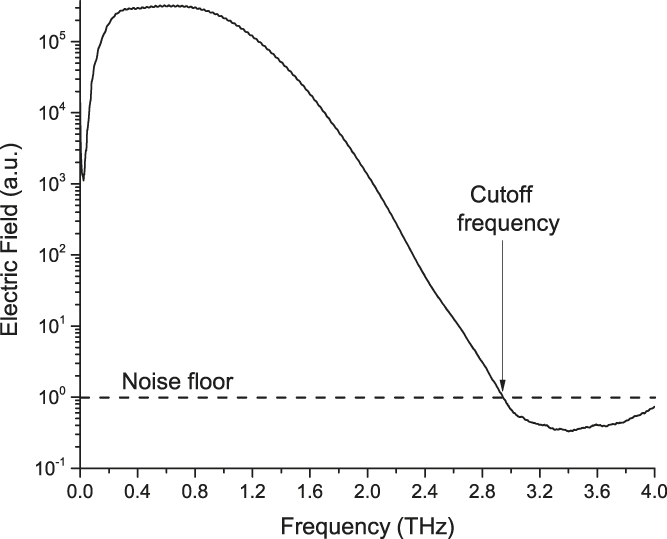
where t 12 and t 21 are the frequency-dependent complex Fresnel transmission coefficients, L is the thickness of the sample, α is the power absorption, and k = 2πn/λ and k 0 = 2π/λ are the propagation wave vectors. Based on this relation, the frequency-dependent dielectric function, refractive index n(ω), and the absorbance values α(ω) of the samples can be determined. However, due to the attenuation of the terahertz signal in the samples, the intensity of the transmitted beam decreases to a point where, at a certain frequency, it becomes indistinguishable from the noise measured by the terahertz spectrometer.Reference Jepsen and Fischer20,Reference Jepsen, Cooke and Koch21 Beyond this cutoff frequency, the low signal-to-noise ratio prevents the accurate determination of the sample dielectric properties. In the present work, we selected a spectral range falling below 2.8 THz, the lowest common cutoff frequency value of all samples, so that valid data could be compared between samples. A representative terahertz frequency spectrum of a YAG ceramic is shown in Fig. 2.
Determination of the noise floor in a THz-TDS spectrum of a YAG ceramic sample.
III. RESULTS AND DISCUSSIONS
A. Terahertz absorption spectrum of YAG single crystals
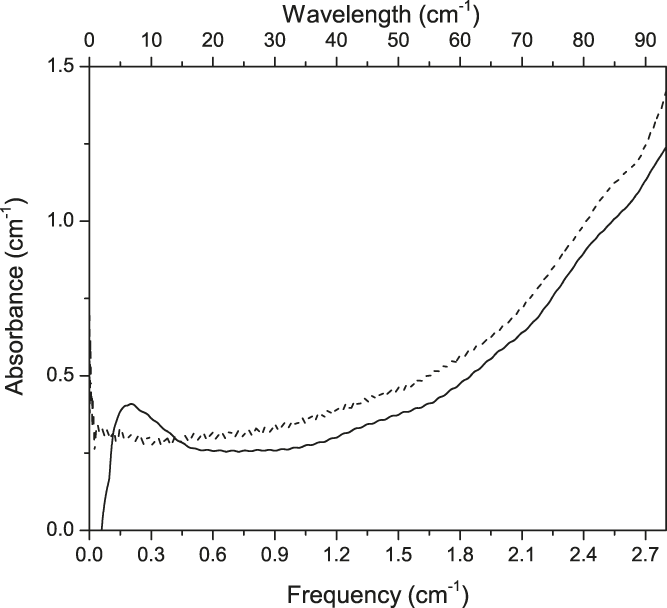
Figure 3 shows the terahertz absorption spectrum of the undoped and Nd3+-doped YAG single crystals. Both spectra show an increased absorption with frequency, with an overall higher absorption in the case of the doped crystal. This increase in absorption lies at a lower energy than the lowest polar mode identified in this crystal (3.5 THz) and that corresponds to the asymmetric stretching of the AlO4 tetrahedra (T mode) and to the translation of yttrium on their dodecahedral sites (Td mode).Reference McDevitt11,Reference Hurrell, Porto, Chang, Mitra and Bauman12,Reference Hofmeister and Campbell22 To our knowledge, this low energy pedestal does not seem to have ever been reported in previous studies however. Its position to the left of the least energetic polar mode expected in the YAG lattice suggests that it might arise from a phonon-difference process.
Terahertz absorption spectra of an undoped YAG single crystal (solid line) and of a 1 at.% Nd:YAG single crystal (dotted line) at room temperature.
B. Effect of temperature on terahertz absorption
To further investigate the possibility of terahertz absorption via a phonon-difference process, the spectrum of undoped YAG was measured as a function of temperature from 20 to 220 °C. The result is shown in Fig. 4. The absorption at low frequency is temperature independent while the contribution of the main band increases with temperature. The absorbance of terahertz radiation can be explained by the product of three terms. The first one is the matrix element of the coupling term between the phonons involved in the process. It is nonzero only for specific phonon combinations determined by selection rules derived from symmetry considerations. The second one describes the temperature dependence of the phonon occupation number of the phonon states involved in the process and the third is related to the phonon density of state. Specifically, the net probability of optical absorption by a solid is proportional to the difference between stimulated phonon generation and absorption rates, W n, n + 1 and W n, n − 1 respectively:Reference Ziman23
 $${W_{n,n + 1}} = {\left| {\left\langle {{\psi _{n + 1,N}}\left| {H\left| {{\psi _{n,N'}}} \right\rangle } \right.} \right.} \right|^2}\∼n + 1\quad ,$$
 $${W_{n,n - 1}} = {\left| {\left\langle {{\psi _{n,N}}\left| {H\left| {{\psi _{n - 1,N'}}} \right\rangle } \right.} \right.} \right|^2}\∼n\quad ,$$
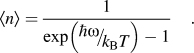 $$\left\langle n \right\rangle = {1 \over {\exp \left( {{\raise0.7ex\hbox{${\hbar \omega }$} \!\mathord{\left/ {\vphantom {{\hbar \omega } {k_{\rm{B}} T}}}\right.\kern-\nulldelimiterspace}\!\lower0.7ex\hbox{${k_{\rm{B}} T}$}}} \right) - 1}}\quad .$$
where H is the interaction Hamiltonian, n is the occupation state of the phonon and N is the quantum number of the terahertz photon field. <n> is the average phonon population density at a temperature T. A terahertz absorption process with generation of a single phonon (k = 0) is thus proportional to
 $$\left[ {\bar n\left( \omega \right) + 1} \right] - \bar n\left( \omega \right) = 1\quad ,$$
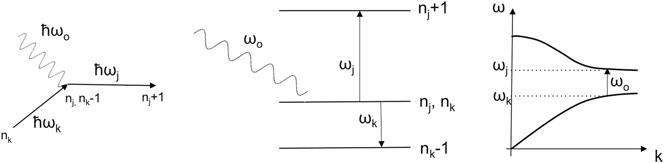
and, consequently, its amplitude is independent of temperature. To account for the temperature dependency of the main absorption band, one must invoke an optical absorption mediated by higher order photon-lattice interactions.Reference Ziman23,Reference Burnstein and Bak24 In compound crystals, such as YAG, such mechanisms are either induced by (i) second and higher order terms in the electric moment, or by (ii) the anharmonic coupling between phonons, arising from third and higher order terms in the potential energy. In process (i), where the first-order dipole moment can be zero, the photon couples directly with two phonons, the first one producing the asymmetry in the electronic charge distribution, which is then displaced by the second phonon. In process (ii), the anharmonic mechanism has been described by the coupling of a photon with a TO phonon, which subsequently couples with two other phonons. In either case, the net result can be the creation of two phonons (summation process) or the creation of one phonon and the annihilation of the other (difference process). The centrosymmetry of the YAG lattice further implies that the two-phonon combinations must originate from two different branches and that overtones are forbidden. Here, because νo = 3.5 THz corresponds to the lowest polar mode of the YAG lattice, only a high-order, two-phonon difference (2PD) process, involving mechanism (i) can explain the absorbance below 3.5 THz (Fig. 5).
Terahertz absorption spectrum of an undoped YAG single crystal at various temperatures.
Terahertz absorption mediated by a phonon-difference process.
Similarly to (1), the temperature dependency of the 2PD process shown in Fig. 5 can be explicated by
 $$\left( {{{\bar n}_j}\left( {{\omega _{\rm{j}}}} \right) + 1} \right){\bar n_k}\left( {{\omega _k}} \right) - {\bar n_j}\left( {{\omega _{\rm{j}}}} \right)\left( {{{\bar n}_k}\left( {{\omega _k}} \right) + 1} \right) = {\bar n_k}\left( {{\omega _k}} \right) - {\bar n_j}\left( {{\omega _{\rm{j}}}} \right)\quad .$$
In the high-temperature limit (k BT » ħωk), the absorbance is found to depend linearly with the temperature:Reference Lengfellner and Ren25–Reference Stolen29
 $${\bar n_k}\left( {{\omega _k}} \right) - {\bar n_j}\left( {{\omega _{\rm{j}}}} \right) \approx {{{\omega _{\rm{o}}}} \over {{\omega _{\rm{j}}}}} \cdot {{{k_{\rm{B}}}T} \over {{\omega _{\rm{j}}} + {\omega _{\rm{o}}}}}\quad ,$$
where ωo and ωj are the frequencies of the incident terahertz photon and of the acoustic phonon, respectively. Above 350 K, the absorbance in the 1.5–2.8 THz spectral range follows a linear dependency with temperature (Fig. 6), confirming that the broad asymmetric absorption band arises from a 2PD process.
Temperature-dependence of the absorbance at various frequencies.
C. Effect of doping and nonstoichiometry on terahertz absorption
Energy and momentum conservation in a terahertz absorption event mediated by a 2PD process implies that the phonons are the short wave length phonons at the edge of the Brillouin zone (BZ) for which the nearest-neighbor atomic motion is more asymmetric than those at the center of the BZ. For this reason, the anharmonic coupling and 2PD processes are particularly sensitive to local disorder induced by doping and nonstoichiometry. A doped crystal possesses a reduced translational symmetry compared with a perfect crystal and the coupling of a terahertz field with multimode lattice vibrations is favored. This leads to a stronger mode damping. Hence, increased point-defect concentration broadens the peak absorption width in comparison to the single crystal. In addition, one would expect an increased number of active polar modes in the presence of defects, and therefore an increase in overall terahertz absorption. These two effects can be readily seen in Fig. 3 where the Nd:YAG single crystal has a stronger and broader 2PD absorption band than the undoped crystal. Similarly, Figs. 7(a) and 7(b) show the room temperature of terahertz absorption spectra of ceramics with compositions ranging from +0.86 to −0.2 mol% Y2O3 above and below the garnet stoichiometry. Figure 7(a) shows a pronounced increase in overall absorption intensity for the yttrium-rich compositions. In the case of Al-rich samples, Fig. 7(b) shows that the absorbance increases with increasing amounts of alumina until it saturates for compositions −0.09 mol% yttria deficient. This saturation point is likely due to the solubility limit of alumina in the YAG lattice. By comparing the trends obtained for yttria- and alumina-rich compositions, we find that the THz-TDS is a sensitive technique, which can resolve nonstoichiometric YAG compositions <0.1 mol% apart.
(a) Comparison of the terahertz spectra of a YAG single crystal and of nonstoichiometric YAG ceramics with increased amounts of yttria. (b) Comparison of the terahertz spectra of a YAG single crystal and of nonstoichiometric YAG ceramics with increased amounts of alumina.
IV. CONCLUSION
The far-IR absorption properties of undoped, 1 at.% Nd3+-doped YAG single crystals and of undoped transparent ceramics of YAG with intentional intrinsic doping have been experimentally measured using terahertz time-domain spectroscopy. In the frequency range of 0.06–2.8 THz, the measured power absorption is dominated by a broad asymmetric two-phonon difference absorption peak. The width and intensity of this band increase with yttrium or aluminum defect concentration. We attribute this effect to the increase in the effective number of terahertz-active modes due to the breakdown of translational symmetry in the defective lattice. Although further work will be needed to improve on the technique, this preliminary study shows that THz-TDS offers sufficient resolution in assessing the composition of YAG ceramics within the stability domain of the garnet phase.
ACKNOWLEDGMENTS
Romain Gaume wishes to thank the College of Optics and Photonics (CREOL), the Townes Laser Institute, and the Nano-Science Technology Center at UCF for providing funding. S.K. Sundaram acknowledges the support of Inamori Professorship by Kyocera Corporation.