Political economists have long studied the role of central banks and central bankers in the governance structure of modern countries. Despite their specialty, central banks share similarities with many other political institutions. For example, in the United States, a small committee of individuals set interest rate policy according to majority rule. Because central bank committees often take roll-call votes during committee meetings like in legislatures, researchers commonly apply spatial voting models to help understand central bank decisionmaking. With informative voting, researchers can locate central bankers on a single common dimension, based on the correlations in their voting behavior (see e.g., Chappell, Havrilesky and Roy McGregor Reference Chappell, Havrilesky and McGregor2000; Chang Reference Chang2003; Gerlach-Kristen and Meade Reference Gerlach-Kristen and Meade2010; Hix, Høyland, and Vivyan Reference Hix, Høyland and Vivyan2010; Adolph Reference Adolph2013; Ainsley Reference Ainsley2017; Eijffinger, Mahieu, and Raes Reference Eijffinger, Mahieu and Raes2018).
Previous research has presented some possible problems with applying spatial voting models to central bank decisionmaking. First, committee members often vote according to consensus and consensus voting seems to describe most central bank policy outputs irrespective of how the committee is organized; this makes computation of members’ preferences difficult because of invariant or sparse data (Riboni and Ruge-Murcia Reference Riboni and Ruge-Murcia2010). Second, the status of committee members, such as duration of tenure on the committee, whether the member is appointed by the president or elected by his or her district, and whether a member has dissented before, is shown to predict whether a member will dissent or not (Meade Reference Meade2005; Meade and Sheets Reference Meade and Sheets2005); this makes it hard to distinguish members’ preferences from member hierarchy. Worse, any willingness to cast a dissenting vote is made harder by a dominant committee Chair (Crawford and Haller Reference Crawford and Haller1990; Shapiro and Varian Reference Shapiro and Varian2013) as well as tendencies towards “group-think” due to members’ socialization, such as education and vocation, that may lead members to draw similar conclusions (Johnson Reference Johnson2016; Kaplan Reference Kaplan2017; Hallerberg and Wehner Reference Hallerberg and Wehner2018). In short, sparse data and differences across individuals in their ability and willingness to dissent makes spatial methods designed for estimating preferences from roll-call votes particularly challenging for studying central banking.
Instead of using voting data to estimate committee members’ relative preferences, we use a method that combines topic modeling and positional analysis based on a textual interpretation of a theoretical model called the Taylor rule. We use Federal Open Market Committee (FOMC) meeting transcripts between 2005 and 2008 to estimate committee members’ preferences using the relative emphasis on policy topics that US central bankers are mandated to consider: inflation and unemployment/output.
Our main contribution is to provide a strategy for estimating central bankers’ preferences using what policymakers say in meetings rather than how they vote in roll-calls. Instead of using real-time economic data such as committee members’ economic forecasts to infer relative emphasis (El-Shagi and Jung Reference El-Shagi and Jung2015), we compute relative positions by using how much a member emphasizes inflation relative to output and unemployment in a policy meeting. Methodologically, our approach highlights the value in explicitly including speech data and human judgment to assist in the interpretation of unsupervised learning approaches increasingly common in political science (see also Roberts et al. Reference Roberts, Stewart, Tingley, Lucas, Leder-Luis, Gadarian, Albertson and Rand2014; Lucas et al. Reference Lucas, Nielsen, Roberts, Stewart, Storer and Tingley2015). An unusual aspect of our application is to leverage common understanding of the micro-foundations of FOMC deliberation, enshrined in the Fed’s dual mandate, to focus an unsupervised and often hard to interpret machine learning model (Chang et al. Reference Chang, Boyd-Graber, Gerrish, Wang and Blei2009).
Our results have several important implications for the politics of committee decisionmaking and political economy. First, we show that despite their consensus voting, central bankers express much larger variation in policy positions in speech than they do in votes. This is important as a shift in FOMC preferences has implications not only for the US economy and its citizens, but, due to the prominence of the United States in the global financial system, that can dramatically shape international markets as well. Second, the fact that we find greater variation in speech data than in voting data speaks to the similarity that central bank committees have with other political institutions. Our findings add to mounting evidence in other contexts, such as legislatures and political parties, where political actors similarly express greater diversity in speech opinions than they do in formal voting behavior (Proksch and Slapin Reference Proksch and Slapin2012; Schwarz, Traber, and Benoit Reference Schwarz, Traber and Benoit2017). Third, market actors increasingly use speech data to forecast future FOMC behavior. CNN, for example, recently reported that Minutes from the Federal Open Market Committee meeting in September show that a December interest rate hike is likely, providing qualitative analysis of committee members’ inflation preferences derived from committee meeting minutes. As markets increasingly turn to what members say in addition to how they vote, the need to understand similarities and differences in members’ revealed preferences during policy deliberations is all the more pressing.Footnote 1
Central bank preferences
The individuals who sit on the FOMC are mandated by the US Congress to fulfill three goals: maximize employment, stabilize prices, and keep long-term interest rates steady. Although all members on the FOMC share the same mandate, committee members have different preferences. A useful ranking of central bank preferences is based on their inflation preferences—or how sensitive policymakers are to increases in inflation risks. Borrowing terms used to describe individuals’ appetites for war, those that worry relatively more about inflation risks are called Inflation Hawks whereas those that worry relatively less about inflation risks are called Inflation Doves. Ordering individual central bank committee members according to their preferences along a single common dimension, “how much do I care about inflation risks relative to output and unemployment risks,” is important as it allows researchers to compare preferences across actors and over time and to test theories about committee decisionmaking. Indeed members themselves talk about inflation this way: in January 31, 2007, Bank President Geithner (New York) reported his inflation concern strictly using such terms, “We see somewhat less downside risk to growth and somewhat less upside risk to inflation than we did, but the overall balance of risks in our view is still weighted toward inflation.” The fact that committee members have such a mandate and talk in these terms provides an unusual theoretical consensus on a low dimensional structure to understand members’ preferences over a wide variety of apparently disparate policy topics.
If members of the FOMC are all tasked with the same objective, why would central bankers have different preferences? First, a member’s characteristics may affect their appetite for inflation, such as who appoints them (Havrilesky and Gildea Reference Havrilesky and Gildea1991, Reference Havrilesky and Gildea1995; Chappell, Havrilesky and McGregor Reference Chappell, Havrilesky and McGregor1993; Chappell, Havrilesky, and McGregor Reference Chappell, Havrilesky and McGregor1995; Tootell Reference Tootell1996; Chang Reference Chang2003; Meade and Sheets Reference Meade and Nathan Sheets2005) and their educational training (Johnson Reference Johnson2016; Kaplan Reference Kaplan2017; Hallerberg and Wehner Reference Hallerberg and Wehner2018). Second, central bankers have their own career histories, goals, and objectives (Havrilesky and Gildea Reference Havrilesky and Gildea1991; Adolph Reference Adolph2013; Eichler and Lähner Reference Eichler and Lähner2014) and we expect their career incentives to influence their policymaking. Inter-committee politics may also affect their behavior. Schonhardt-Bailey (Reference Schonhardt-Bailey2013) shows that hallway conversations as well as explicit deliberation allows central bankers to influence and persuade their colleagues.
Previous measures of central bank preferences predominately depended on analyzing voting behavior (see e.g., Chappell, Havrilesky and Roy McGregor Reference Chappell, Havrilesky and McGregor2000; Chang Reference Chang2003; Gerlach-Kristen and Meade Reference Gerlach-Kristen and Meade2010; Hix, Høyland, and Vivyan Reference Hix, Høyland and Vivyan2010; Adolph Reference Adolph2013; Ainsley Reference Ainsley2017; Eijffinger, Mahieu, and Raes Reference Eijffinger, Mahieu and Raes2017; Bennani, Farvaque, and Stanek Reference Bennani, Farvaque and Stanek2018). Following the roll-call voting literature (Poole and Rosenthal Reference Poole and Rosenthal1997; Clinton, Jackman, and Rivers Reference Clinton, Jackman and Rivers2004; Carroll et al. Reference Carroll, Lewis, Lo, Poole and Rosenthal2009), scholars use committee votes to help infer committee members’ policy preferences. For example, Chappell, Havrilesky and Roy McGregor (Reference Chappell, Havrilesky and McGregor2000) estimate monetary policy reaction functions for individual FOMC members using expressed preferences in the transcripts as their data source. These authors code member preferences into three categories: favoring interest rate tightening, favoring interest rate easing, or consenting to the proposed policy rate (Chappell, Havrilesky and Roy McGregor Reference Chappell, Havrilesky and McGregor2000, 72).
However, while it seems natural to characterize central bankers as inflation “Hawks” who vote in favor of interest rate tightening and “Doves” who vote for loosening, this behavior may be a better measure of whether and to what extent policymakers coordinate, rather than their preference similarity or dissimilarity (Schelling Reference Schelling1978). This is especially likely because in central bank decisionmaking, public consensus outcomes are partly determined by actors’ desire to minimize apparent divergences of opinion to avoid economic uncertainty and to stabilize expectations (Woodford Reference Woodford2005; Rosa and Verga Reference Rosa and Verga2007). Similarly, members willingness to cooperate often depends on others in the group and especially on the willingness of the committee Chair to allow for public dissent in the first place (Crawford and Haller Reference Crawford and Haller1990; Riboni and Ruge-Murcia Reference Riboni and Ruge-Murcia2010; Shapiro and Varian Reference Shapiro and Varian2013).
Consequently, we observe very little variation in central bank voting behavior, which makes identifying individual committee member preferences statistically challenging. This is especially so in the United States. For example, between 1948 and 2014, FOMC members cast on average only one dissenting vote per meeting, which is less than 10 percent of all votes cast (Thornton and Wheelock Reference Thornton and Wheelock2014). Between 2005 and 2008, the period that we consider in this paper, there were just seven official dissenting votes out of 255 official roll-call votes, about two percent of all votes cast. Finally, dissenting votes are also only cast by a select subset of the committee members. Indeed one member, Bank President Lacker (Richmond), cast four out of the seven dissenting votes between 2005 and 2008. Figure 1 shows the small number of dissents over the period we examine in this paper, demonstrating little variation to actually estimate preferences. For those cases where there is enough variation to estimate members’ preferences, or for those cases where members’ expressed preferences in deliberations prior to the roll-call are used to supplement the data, the recovered estimates arguably remain sensitive to information provided by those rare events when a committee member dissents. Thus, while each committee member has the right to vote according to his or her own preferences (or the preferences of his/her underlying constituency), official central bank decisionmaking, at least as it is reported by official voting, most often confirms the status quo policy rate and likely reflects policy coordination as well as committee members’ preferences.Footnote 2
Voting on the Federal Open Market Committee (FOMC) between 2005 and 2008

To avoid such problems with vote data, we construct estimates for FOMC members by using a relative-position, textual interpretation of interest rate policy-setting based on a monetary policy rule called the “Taylor rule.” If central bankers’ policy decisions are based on an expressed trade-off between higher values of inflation and lower values of unemployment/output, then we can use the relative amount of time central bankers spend talking about each topic to develop measures of FOMC members’ preferences.
As a first step, we measure topics using a version of Latent Dirichlet Allocation (LDA) augmented to capture topical phrases as well as single words. We then apply human judgment to identify only those topics that policymakers are mandated to care about (inflation, unemployment/output). Finally, we use the expressed topic mentions of inflation and output and unemployment to scale actors’ relative positions on a single dimension measuring inflation aversion. While other scholars have applied topic models, or similar approaches, using FOMC transcript data, to our knowledge, this paper is the first to start from a theoretical model of topic emphasis and then to combine the results from expressed topic emphasis with scaling models common in the political science literature.Footnote 3
Estimating Central Bank Preferences
The Taylor rule is a simple approximation or guideline for what central bankers ought to do given changes in the economy developed by Stanford economist John Taylor. The original rule provides an aggregate policy recommendation for changing the federal funds rate as output and inflation change over time (Taylor Reference Taylor1993). Importantly, the Taylor rule represents an explicit reaction function for the monetary policy committee; it shows how the federal funds rate should change in a response to changes in inflation (deviations from target) and changes in output (the output gap).Footnote 4
 $$r{\equals}\pi {\plus}{1 \over 2}(y){\plus}{1 \over 2}(\pi {\minus}2){\plus}2,$$
The outcome variable r is the desired federal funds rate, π the rate of inflation over the previous four quarters, and y is the percent deviation of real gross domestic product (GDP) to target GDP. We assume that members are stating their beliefs about forward inflation and output/unemployment in their speeches, and that the topics members emphasize are consistent with their preferences, because they are all using something resembling the Taylor rule to guide them.
Importantly, the Taylor rule, or some derivation of the Taylor rule, is used as a guideline in most central banks around the world. The Board of Governors and the research staff at regional Federal Reserve Banks consult with FOMC members about projections from Taylor rule estimates and policymakers are equipped with economic projections from different Taylor rule specifications. For example, Appendix B in the 2008 “Bluebook” presents six scenarios of the future economy, three of which are based on some derivative of the Taylor rule.Footnote 5 Even when there is uncertainty about the true model of the economy, the Taylor rule is expected to deliver good outcomes in a variety of models. A version of the Taylor rule has been used, for example, to estimate interest rate decisions by the European Central Bank’s Governing Council (Hayo and Méon Reference Hayo and Méon2013) and in the United States (Plosser Reference Plosser2014; Blinder et al. Reference Blinder and Reis2005).
The Taylor rule expresses a linear trade-off between inflation and output/unemployment, of the form $r{\equals}\beta _{0} {\plus}\beta _{1} \pi {\plus}\beta _{2} y$ where, according to the weights of equation (1), $\beta _{0} {\equals}1$
 , $\beta _{1} {\equals}1.5$
 and $\beta _{2} {\equals}0.5$
 . The original Taylor rule is an aggregate policy rule and does not envisage that each individual member will have a different inflation sensitivity. But if we allow for such individual variation we can then estimate rather than stipulate β 1 and β 2 for each member. Expressed as a trade-off between inflation and output concerns, we can represent the balance of an individual member’s considerations built into the rule by ${\rm log}{{\beta _{1} } \over {\beta _{2} }}$
 . Again, for illustration, consider the original specification, ${\rm log}{{\beta _{1} } \over {\beta _{2} }}{\equals}{\rm log}{{1.5} \over {0.5}}\,\approx\,1$
 . The interpretation is that an individual has a uniquely preferred proportional emphasis of inflation versus output sensitivity. In order to be consistent with the ideal point literature, where point predictions are scaled on a single left-right dimension, we use inflation sensitivity β 1 as the numerator and β 2 as the denominator. This naturally scales members that are more sensitive to inflation risks to the right of zero position as “Inflation Hawks” and those to the left of the zero position as “Inflation Doves.” This allows us to systematically locate “Inflation Doves” on the left of the scale, “Inflation Hawks” on the right, and to locate other actors between.
The different sensitivity of FOMC committee members to inflation and output risks are, of course, unobserved. With informative voting, we might be able to infer positions (Clinton, Jackman, and Rivers Reference Clinton, Jackman and Rivers2004; Lauderdale and Clark Reference Lauderdale and Clark2014), but because votes are relatively uninformative in the context of FOMC committee meetings, we need to look elsewhere for information. We show how to get relative emphasis from the amounts of words members deploy on inflation topics versus output topics. We model the counts of words and phrases in the inflation and output topics ($c_{1}$ and $c_{2}$
 ), respectively, as:
 $$[c_{1}, c_{2} ]\,\sim\,{\rm Binomial}(p_{i}, N),$$
 $$p_{i} {\equals}P(c_{1} \,\mid\,N),$$
 $$N{\equals}c_{1} {\plus}c_{2}.$$
Topics not related to inflation or output can be ignored because they give no information about $\beta _{1} \,/\,\beta _{2} $ .
Clearly, there are other systematic determinants of the proportion ($p_{i}$ ) of inflation-related speech, so while more elaborate multidimensional models are certainly possible, we limit our attention to the mandated topics as those are the specified parameters in our Taylor rule. In order to account for other (time varying) concerns, we include meeting random effects $m_{t} $
 . We also assume that speakers’ positions are exchangeable and model them as draws from a population of committee members. These effects provide our position estimates.
 $${\rm log}{{p_{{i,t}} } \over {1{\minus}p_{{i,t}} }}{\equals}a{\plus}s_{i} {\plus}m_{t}. $$
Interpreting unobserved terms in the logistic regression model can be motivated either directly, as a form of “logit scaling” from policy position scaling (Lowe et al. Reference Lowe, Benoit, Laver and Mikhaylov2011), or indirectly, by noting that that these quantities are rescaled versions of the positions that would be estimated from automated text scaling (Slapin and Proksch Reference Slapin and Proksch2008) using an association model (Goodman Reference Goodman1985).
Measurement
In theory, we could estimate ideal points using historical transcript data starting in 1993, when the speakers became aware that their meetings were being recorded. However, text-based ideal point estimation implicitly depends on a stable mapping between words and phrases, and the topics they indicate. Because economic and political changes over such a long period make this unlikely, we take a conservative approach. For example, Acosta and Meade (Reference Acosta and Meade2015) argue that the FOMC’s December 2008 meeting represents a semantic break from previous statements because of changes in the federal funds rate and the unique discussion of the asset purchases program. We restrict the sample time period to the three most recent years for which transcripts are available, leading up to but not including the US financial crisis.
Our unit of analysis is the speaker-meeting. We construct a speaker-meeting “document” by concatenating each individual’s speech contributions within each FOMC meeting for the meetings in our sample (2005–2008). Meetings are held approximately every six weeks or eight times a year, leading to a total of 24 meetings, which span two days. Each speaker speaks an average of 1020 words per meeting across all meetings. In this paper we focus on actors that have a formal policy-making role and remove speeches made by staff members and other meeting participants that are either (1) not members of the Board of Governors or (2) not Bank Presidents. We do include in the sample members’ speech contributions even when they are not “on schedule to vote” in the roll-call.Footnote 6
To estimate topic prevalence we use the topical n-grams model (Wang, McCallum, and Wei Reference Wang, McCallum and Wei2007) to identify those topics that central bankers talk about in FOMC meetings and to count how often language associated with a given topic is used.Footnote 7 The n-gram topic model is an extension of traditional LDA (Blei, Ng, and Jordan Reference Blei, Ng and Jordan2003) topic model that allows for both words and phrases to be associated with each other within topics. Specifically, the model posits an unobserved variable “between” tokens indicating whether any two tokens should be treated as a phrase in one of the topics. This allows us to account for economic phrases such as price elasticity, which would otherwise be returned as price, and elasticity. Because many of the topics that FOMC members discuss reference underlying economic theories and concepts with associated jargon, the use of topic phrases is particularly helpful for organizing and classifying topics. It also allows us to infer phrases of arbitrary length (i.e., inflation-expectations and consumer price index (CPI) are of length two and three) and is flexible enough such that word pairs and phrases in one topic are not necessarily present in other topics (i.e. price-elasticity can belong to topic 1 and price to topic 2).
The Gibbs sampler used to fit the model draws from the posterior distribution of topic assignments within each document.Footnote 8 We use the posterior samples from the Gibbs sampler directly to provide our counts. The use of actual topic counts rather than normalized counts is relevant because it allows us to be more certain (or less certain) of the topic balance—and therefore position—of a speaker-meeting document depending on its length; while the relative emphasis on inflation in a speaker-meeting “document” with 75 inflation-related and 25 output/unemployment-related terms is the same as one with 15 inflation-related and five output-related terms, we are more certain in the first case than the second case.
Once we have an estimate of our topic words and topic phrases, we use the topic words and phrases generated by the n-gram topic model to identify by hand our topics of interest. The remaining topics are discarded. In this data the most prevalent topic is inflation, with the word inflation itself used 2924 times whereas the words unemployment and output are used 245 and 260 times. The word inflation alone as a word (without its related phrases such as core inflation, headline inflation, and inflation expectations) accounts for 22 percent of the top topic words. Perhaps unsurprisingly, even Dovish central bankers on the FOMC spend most of their time talking about inflation. Table A.1 in the Supplementary Appendix shows the top topic words and their counts for all topics.
In order to make sure that the results from the n-gram model that we use to extract topics are robust to different model choices, we run the n-gram model for different numbers of topics. Running the topic model for $\{ 5,10,25,50\}$ topics, we find that $K{\equals}25$
 topics are sufficient to identify the topics at a suitable granularity. From our estimated 25 topics, we only keep three covering different aspects of output and unemployment and one topic on inflation. Allowing n-grams to be generated by topics provides considerable help for experts attempting to identify which concept is captured by a topic. This is also helped by the fact that FOMC members work with a shared technical vocabulary. The benefit is a model that distinguishes between federal reserve, federal funds rate, and federal government, which would alternatively be returned as federal, reserve, government, funds, rate with uni-grams, which are more ambiguous and therefore, more threatening to topic identification.Footnote 9
Results and discussion
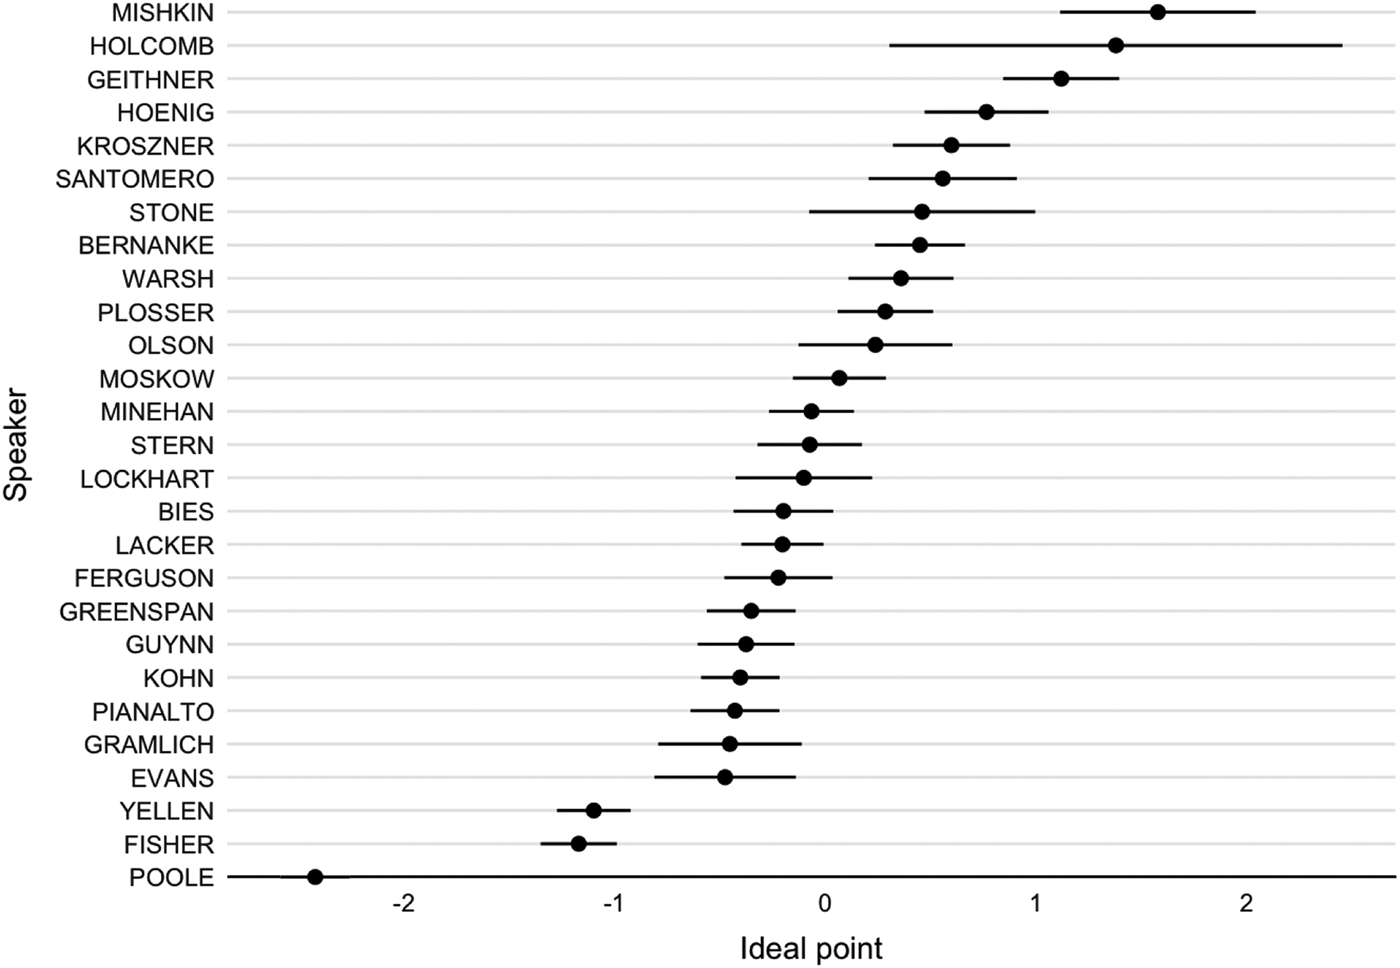
Figure 2 shows the computed average estimates for each FOMC members’ ideal point across the sample period, including meeting random effects.Footnote 10 Each individual’s estimate is a point prediction of their relative inflation preferences from a mixed model treating speakers as a draw from a wider population of central bankers, each with their own intercept. Thus we estimate member specific reaction functions based on inflation versus employment and output emphasis. This is different from previous studies that estimate each member’s implied desired federal funds rate using a fixed-effect model from implied voting decisions (Chappell, Havrilesky and Roy McGregor Reference Chappell, Havrilesky and McGregor2000; Bennani, Farvaque and Stanek Reference Bennani, Farvaque and Stanek2018) or a spatial model based on voting decisions (Eijffinger, Mahieu and Raes Reference Eijffinger, Mahieu and Raes2018). The position of each speaker’s intercept on the x-axis measures the degree of inflation aversion: that is, how willing a central banker is to forgo an increase in economic activity (output and jobs) for a reduction in inflation, with those scaled on the left hand side being relatively more Inflation Dovish than those Inflation Hawkish types located on the right-hand side.
Estimated fixed ideal points from full transcripts with meeting random effects. Dovish members are those occupying the left hand side of the scale and Hawkish members are those on the right hand side.

The results are interesting in that they confirm previous studies while offering some important new insights. The first, and perhaps most obviously, dissenting Bank President Lacker (Richmond) is estimated as having more moderate inflation preferences compared to expectations based on his interest-rate tightening, dissenting, voting behavior. Lacker expressed official dissent to proposed changes to the federal funds rate a number of times during his tenure at the Fed. In 2006, for example, during our sample period, Lacker dissented in the August, September, October, and December meetings. In these meetings, the FOMC agreed to keep interest rates at the status quo rate whereas Lacker voted for additional interest rate tightening. According to vote-based measures, his persistent dissents (four times) and the call for rising rates would push him toward to the extreme on Hawkishness. Estimates for Lacker based on implied voting, for example, have him the farthest right on the scale for 2007 (Eijffinger, Mahieu and Raes Reference Eijffinger, Mahieu and Raes2018). Using our method, while we find Lacker to be Hawkish when we restrict the sample to 2007, his estimated preferences over the three years place him much closer to the median.
What might explain this discrepancy? In reading the texts of the transcripts, we see that Lacker appeals to his reputation for inflation Hawkishness to discuss output and unemployment more freely in his speech. In the December 12, 2006 meeting, for example, which is the period right before he dissents, he says: “In past meetings I have expressed misgivings about whether our strategy is going to bring inflation down fast enough. So I won’t belabor those again today.” His next topic is one that expresses concern about output and unemployment in his home district. By examining voting decisions alone, countervailing concerns, such as concerns about the economy in a member’s home district, are subsumed by the rarity (and therefore power) of dissenting votes.
Another interesting finding is that Bank President Geithner (New York) is estimated by our method as very Hawkish, significantly more Hawkish than both President Lacker and Chairman Greenspan, despite never casting a dissenting vote. This is important for two reasons. First, as President of the New York Fed, Geithner is perhaps most likely to represent the interests of the financial sector than other Bank Presidents; his Hawkishness may suggest that constituency effects matter. Second, President Geithner had a career in government before and after being on the FOMC board. His vocational expectations may also shape his preferences on inflation (Adolph Reference Adolph2013; Eichler and Lähner Reference Eichler and Lähner2014). As the representative of the largest district, the New York Federal Reserve Bank President always votes on the FOMC. If Geithner is a hawk, and more hawkish than the average Bank President on the FOMC, this means that during his tenure at the FOMC, the bias of Bank Presidents voting on the FOMC committee was likely to be skewed rightwards even though inflation was close to or at the target rate of 2 percent.
Lastly, Chairman Greenspan straddles the middle position when compared against his two successors, Chairman Bernanke and Chair Yellen. Surprisingly, Bernanke is estimated as relatively more inflation adverse than either Greenspan or Yellen, whereas unsurprisingly, Yellen is estimated as more Dovish. Table A.2 in the Supplementary Appendix reports the full set of static ideal point estimates for FOMC members.
Convergent validity
Do these relative positions really uncover noticeable differences in members’ inflation preferences as expressed in FOMC meetings? How do our measures compare with other measures in the literature? In order to assess the validity of our measures, we first compare our measures with a subset of “expert rankings” published in the newspaper, the Financial Times (FT) in 2009.Footnote 11 Because the ranking is from 2009, the FT rankings are out of sample (recall that our data ends in 2008). We then select and rank FOMC members on an ordered categorical scale from 1 to 5 according to their FT labels: “Strong Dove,” “Dove,” “Center,” “Hawk,” or “Strong Hawk.” The categories are mutually exclusive. Figure 3 shows our ordering for the eight committee members that match across the two samples. We find a positive relationship between our measure and the expert ranking (correlation 0.50). Both President Lacker (Richmond) and President Fisher (Dallas) are located more to the left and mid-point in our sample compared to the FT. Another difference is that we estimate Chair Bernanke as being more Hawkish than the expert ranking, who locate him closer to the midpoint.
Comparing estimated fixed ideal points from text with expert placement in Financial Times

The main point of departure between our estimate and the expert placement is with President Fisher, and so we discuss him further. President Fisher is one of the few members of the FOMC that dissents during his tenure on the FOMC committee, although he does not dissent during our sample but the following year, five times from January to May 2008, which is behavior likely incorporated in the FT ranking. Fisher again dissents twice in 2011 (Thornton and Wheelock Reference Thornton and Wheelock2014). In terms of understanding the validity of our measures for those individuals that dissent, there are two possible scenarios: (1) our model ignores dissenters’ positions (i.e. puts no weight on members’ voting behavior) and therefore suffers from underfitting or (2) alternatively, the expert ranking over-estimates members’ positions (i.e. puts too much weight on voting behavior) and therefore suffers from overfitting. Because our method can estimate members’ position irrespective of whether or not a member is on schedule to vote, our model is more likely to accurately capture the regularities in the data and generalize well to unseen data. This coupled with the fact very few members dissent and do so rarely (recall that in our data the percentage of dissents is 2 and 10 percent historically) suggests that our method is valid for uncovering most members positions on the FOMC most of the time. That being said, our estimate for President Fisher does little to suggest that he will cast a series of interest-rate tightening votes that go against the consensus of the committee the following year. As mentioned in the introduction, further theoretical and empirical research explaining why we observe stark variations in how members speak and how they vote is an interesting avenue worth exploring.
How do our measure compare with estimates from statistical models in the literature rather than the expert rankings by the FT? Figure 4 presents our estimates (column 1) alongside estimates of ideal points based on implied voting behavior by Eijffinger, Mahieu and Raes (Reference Eijffinger, Mahieu and Raes2017) (column 2) and estimated interest-rates by Bennani, Farvaque and Stanek (Reference Bennani, Farvaque and Stanek2018) (column 3), only this time ordered according to our measure; the remaining people are those members not included in the FT ranking but estimated in the other papers.
Comparing ideal points from text, implied voting and preferred interest rate measures. Column (1) estimated preferences from text, column (2) estimated preferences from votes, and column (3) estimated interest rate preferences

The most striking feature of our data compared to the other measures is that using textual information gives us significantly more variation across members than what is uncovered using voting information. This is perhaps unsurprising as the alternative measures use voting information and central bank voting is relatively invariant. The impact of a limited number of official dissents on estimated ideal points (in this case, the preferred interest rate) is most stark in column 3, where members are, more or less, indistinguishable from one another. To compute these measures, the authors derive members’ policy differentials, “or the difference between the desired interest rate and the Fed’s actual policy rate.”Footnote 12 The estimates are based on a sample of members’ voting decisions, between 1994 and 2008 (Bennani, Farvaque and Stanek Reference Bennani, Farvaque and Stanek2018). Unfortunately, their data set does not include estimates for Fisher and Lacker, making it difficult to compare those individuals across all measures. President Yellen (San Francisco) is estimated as relatively more hawkish than expected.
Column 2 presents estimates by Eijffinger, Mahieu and Raes (Reference Eijffinger, Mahieu and Raes2018), who use actual and implied votes as coded from the transcripts and a Bayesian static spatial voting model over the period 1989–2007. Because it is Bayesian, the estimated uncertainty bounds are 95 percent credible intervals rather than confidence intervals and the midpoint estimate are not necessarily located in the middle.Footnote 13 Comparing these estimates with column 3, one sees the utility in including additional information in implied votes. The uncertainty on some (but not all) of the members shrink as a consequence of more dissents. The estimate for Yellen in column 2 compared to column 3, for example, is also much more similar to our estimate and to the expert placement. None of the measures are well correlated, however. Our measure (column 1) is uncorrelated with the vote based (column 2) measure (−0.06) and negatively correlated with the interest-rate measure (column 3) (−0.48). The two vote-based measures (columns 2 and 3) are also uncorrelated (0.04). What about if we examine the correlation with the ranking by the FT as well? Here we see greater consistency, at least across the measures in columns 1 and 2. The correlation with the FT and our text-based measure (column 1) is (0.50) and with the implied vote measure (column 2) (0.72). Meanwhile, the interest-rate measure (column 3) is also uncorrelated with the FT expert ranking (0.00).
Predictive validity
Evaluating regional economic performance
One possible explanation for why central bankers have different preferences is they hold preferences related to their home-districts and that their home districts have different economic conditions (see e.g., Chappell, Havrilesky and RoyMcGregor Reference Chappell, Havrilesky and McGregor2000; Meade and Sheets Reference Meade and Nathan Sheets2005; Bennani, Farvaque and Stanek Reference Bennani, Farvaque and Stanek2018). A related literature also examines whether members’ personal incentives, such as career motivations, are an important predictor of members’ policy decisions. Adolph (Reference Adolph2013), for example, examines how FOMC members might make decisions today to position themselves for future employment in the financial sector. Consequently, members that anticipate future links with finance have incentives to express more Hawkish tones while policymakers on the FOMC (see also Eichler and Lähner Reference Eichler and Lähner2014).
To the best of our knowledge, while evidence for regional and professional biases have been linked to members’ voting decisions, to date, scholars have not tested such theories using speech data. As a first application, we replicate these findings by (1) examining the correlation between the topics that FOMC members talk about and regional level economic data and (2) examining whether or not members express views consistent with lenders or borrowers in their region.
As before, the unit of analysis is speaker-meeting contributions. One way that the sample is different from that above, however, is that we have to restrict the sample to include only regional district banks and the Bank Presidents who preside over these districts.Footnote 14 To assess whether or not regional level unemployment is correlated with how much a member talks about unemployment and output, we collect information for the regional unemployment rate in the member’s district at the current period. As a second measure of unemployment, we also examine one year ahead forecast unemployment. The projections are unemployment rates as reported in the Federal Reserve Greenbook, which are published two weeks before the FOMC meeting. Importantly, the inclusion of forecasts from the FOMC meeting means that we use real-time (as opposed to revised) data, which is the same as what the members themselves had at the time of the meeting.
Next, we also collect real-time current estimates of national inflation, measured according to CPI and personal consumption expenditures (PCE). Second, and like the unemployment rate, we collect CPE and PCE inflation forecasts for the current period and for one year ahead. The examination of future conditions is especially important as monetary policy has an eight to twelve month lag and so committee members may base their topics of speech today on expectations of future movements in the economy (Gordon and Leeper Reference Gordon and Leeper1994).
Further, to reexamine the link between the financial sector and the predicted “Hawkishness” of a committee member, we use the logged dollar amount of non-performing loans in a member’s district as a proxy for the size of the financial sector. We think that this particular indicator is a good test as there are countervailing expectations about the size of debt and predicted Hawkishness of the Bank President. On the one hand, high levels of non-performing loans may make Bank Presidents more “Dovish.” This is because an increase in inflation lowers the real (as opposed to nominal) value of outstanding loans. If the amount of non-performing loans is negatively related to inflation talk, we might expect that Bank Presidents lean toward representing borrowers rather than lenders in their districts. Alternatively, if the amount of non-performing loans is negatively related (or unrelated) to Bank Presidents’ inflation talk, we might expect that Presidents with larger financial sectors are more likely to be Hawkish, which is more in line with the interests of lenders. Another benefit of using this particular measure is that the measure is behavioral, or dependent on the actions of financial actors located in the members’ district, rather than a policy measure, such as interest rates, that the Presidents themselves have control over.
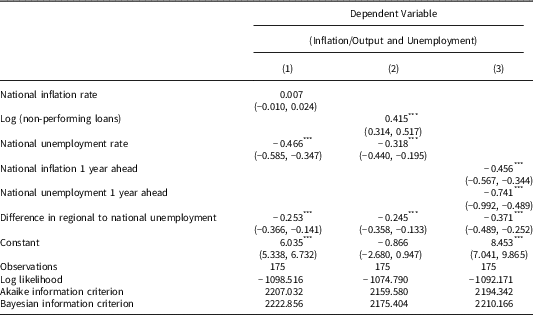
Table 1 presents our regression results. The dependent variable is the share of inflation talk over output and unemployment talk. The independent variables, as discussed above, are (a) current-period national inflation; (b) current-period national unemployment; (c) the difference between district-level unemployment and national level unemployment in the current-period; (d) the log of the current level of non-performing loans; (e) one year ahead projected national inflation; and (f) one year ahead projected national unemployment. The projections are made by staff members at the Board of Governors two weeks before the FOMC meeting and are given to the meeting participants. The statistical model used is a mixed-effects logistic regression model where the dependent variable is the proportion of the raw counts expressed by each speaker at every meeting he or she attends.
Regression Results for Federal Open Market Committee (FOMC) Bank Presidents and District-Level Economic Information

Note: *p<0.1, **p<0.05, ***p<0.01.
Model (1) confirms that national-level inflation is positively related to a greater share of inflation talk. Meanwhile, national unemployment is negatively related to more inflation talk, also as expected. Similarly, a rise in the gap between unemployment at the district level and at the national level is negatively related to inflation; this confirms that district representatives are sensitive to both the national economy and also their districts. In sum, model (1) shows that when unemployment conditions move higher, either nationally or regionally, inflation talk declines.
What about when we examine the role of non-performing loans on inflation and output/unemployment speech? Here we find that district Bank Presidents talk more about inflation when the level of non-performing loans in their district is higher. In other words, there is a positive correlation between district-level debt and inflation talk. If the level of non-performing loans is a good proxy for the size of the financial sector, such a result might imply that Bank Presidents are more likely to represent creditor rather than debtor interests in their districts. Like in model (1), model (2) continues to show that unemployment is negatively related to inflation talk. Taken together, this model provides further evidence that FOMC Bank Presidents act as if governed by a Textual Taylor Rule.
Finally, model (3) examines forward looking projections of the economy rather than conditions on the ground at the time of the FOMC meeting. In this model, we find that while not only is the regional unemployment gap and projected unemployment negatively related with inflation talk, so too is projected future inflation. This is particularly puzzling as why would projected inflation be negatively related to talk about inflation today if monetary policy works only with a lag? Interestingly, the mean level of current period inflation is significantly higher than the four quarter ahead forecast. This is true irrespective of whether or not we examine CPI or PCE inflation values. On average, the current CPI inflation average over the series (3.01) is similar to the actual average (3.4; 3.2; 2.8) reported by the Bureau of Labor Statistics,Footnote 15 yet, the projected one year ahead forecast is substantively lower than the current inflation values almost all of the time. The fact that future inflation is systematically predicted as being lower than current inflation is likely what is generating the negative relationship between future inflation and inflation talk in model (3).
In summary, previous studies have examined the role of district-economic performance and financial-sector connectivity as possible predictors of central bank preferences. As with most of the previous literature, such studies omit members’ speeches. In this application, we show how inflation and unemployment are related to members speech in accordance with a Textual Taylor Rule; members speak more about inflation when unemployment goes down as well as the reverse. We also find that district Bank Presidents are more likely to favor inflation speech when debts in their region are increasing. Such a finding suggests that Bank Presidents may better represent the interests of creditors rather than debtors in their districts.
When do members’ dissent?
At any given time, the total number of FOMC committee members officially included in the roll-call vote is 12. These 12 people include seven members of the Board of Governors of the Federal Reserve System; the President of the Federal Reserve Bank of New York; and four of the remaining 11 Reserve Bank Presidents. The four Bank Presidents serve one-year terms and voting rotates according to an agreed calendar (i.e. members do not select themselves into any given meeting). Despite lacking voting privileges at some (but not all) meetings, the remaining Reserve Bank Presidents attend meetings, make economic assessment of the economy, and express their individual policy positions for both the policy rate and the official policy statement in the transcripts prior to the roll-call.
Using a natural experiment to analyze the effect of transparency on members’ incentives to dissent, Meade and Stasavage (Reference Meade and Stasavage2008) find evidence that voting members are much less likely to dissent than non-voting members. We retest this finding using our data, taking into account a member’s estimated ideal point from text as well as whether the member is on schedule to vote or not. If we find that members behave differently with their speech and with their votes when on schedule to vote, we can assume that voting and non-voting members have different audiences. Recall that while voting decisions are made readily available, publication of transcripts are with a five-year lag.
Following the procedure by Meade and Stasavage (Reference Meade and Stasavage2008), using the transcripts, we code dissent as a binary measure based on whether a policymaker voiced disagreement with the Chair’s policy proposal during the policy debate before the formal roll-call vote. Further, to take a more generous measure of “dissent,” we code a member as dissenting even if the member expresses dissent only in speech and not in the roll-call; this gives us a larger number of dissents to work with (32 versus 7). Furthermore, instead of just looking at dissenting votes that protest changes in the policy interest rate, we also examine whether members propose changes to the official policy statement which is publicized after the decision; this includes an even larger number of dissents (118 out of 425 total). Following Meade and Stasavage (Reference Meade and Stasavage2008), we expect a negative relationship between those members on rotation to vote and expressing a dissenting opinion, regardless of their policy position. The rationale is that consent is more likely expressed by voting members due to strategic incentives to minimize economic and policy uncertainty that results from dissenting opinions.
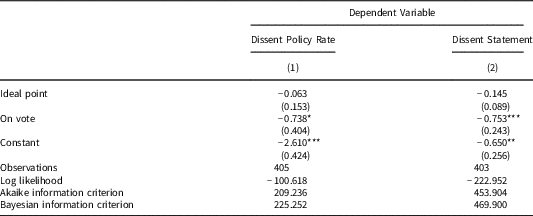
We test this hypothesis by regressing dissent on member ideal points and voting status, with meeting random effects to control for over-time changes in the economy. The results are shown in Table 2. Model (1) predicts dissent over the policy interest rate, and model (2) predicts dissent over the text of the official policy statement.
Predicting Dissents in Policy Rates and Policy Statements with Ideal Points and Voting Status

Note: *p<0.1, **p<0.05, ***p<0.01.
We find evidence in support of the hypothesis that the rotation system engenders consensus opinion among those members on schedule to vote. This confirms theories arguing that official voting behavior likely reflects strategic behavior toward coordination in addition to the expression of policy positions. Our findings suggest that being on schedule to vote makes you less likely to dissent across both categories. According to these results, members’ voting position (on rotation or off rotation) helps predict whether or not a member will dissent, even when we account for members' preferences, thus suggesting strategic rather than sincere voting.
Conclusion
This article shows the usefulness in combining topic and scaling methods to estimate central bank preferences. We develop a new way to estimate central bank preferences on the FOMC based on topics that committee members are mandated to talk about. We extract topic-counts from committee meeting transcripts and compute relative topic emphasis to help identify differences in actors’ policy positions. Our main contribution is that we offer an estimate of FOMC members’ preferences based on private policy deliberations that occur before members agree (or disagree) to coordinate their policy actions by roll-call voting and we do so for all members, irrespective if they are on cycle to vote or not. By using textual information as data to help uncover each members’ relative inflation emphasis, we offer ideal-point estimates based on a members’ professed inflation aversion.
We show greater variation in FOMC members’ preferences than what we see in voting behaviors. This supports recent evidence in other research areas where researchers also uncover greater variation in speech than in votes. We also find that by only analyzing voting data, researchers likely overemphasize a dissenter’s dissimilarity with his or her colleagues. This latter point is especially important because both researchers and market participants use voting behavior to predict changes in key interest rates. One fruitful item for further research, therefore, is to examine whether there exists a similar relationship between dissents in speech and votes and changes to key interest rates. It is not clear whether the pathway of expressed dissent goes from speech to votes or if these two currently policy behaviors are independent. Do committee members start off making verbal protests in private only to build up to official dissent or do policymakers use these two behaviors so as to satisfy different goals?
Finally, our results also provide important policy implications. The Bank of England recently changed its procedures and will make permanent recordings and transcripts of Monetary Policy Committee meetings (Warsh Reference Warsh2014). While some have warned that by doing so, committee members may stifle their debate, our findings suggest that publication of the meetings need not stifle diversity in deliberations among members.
Moving away from the FOMC and central banking, our approach also provides an important tool for researchers that are interested in estimating actors’ preferences in political institutions where expressed dissents are rare. As we show in this paper, matching human judgment with unsupervised learning techniques allows us to estimate members’ preferences despite the fact that institutional norms encourage consensus decisions. Our approach can be directly applied to any type of political institution with a dual mandate. For example, those interested in bureaucratic politics might look to specific agencies, such as the US Housing and Urban Development, and determine how the agency prioritizes low-income housing versus mortgage insurance. At the international level, another application might be the Stability and Growth Pact, where Member States commit themselves to staying within certain debt and deficit spending limits. Here one might examine whether different EU Member States prioritize one fiscal limit over the other.
Supplementary material
To view supplementary material for this article, please visit https://doi.org/10.1017/psrm.2018.31
Acknowledgments
The authors would also like to thank Miguel Acosta, David Bearce, Thomas Bruce, Cheryl Schonhardt-Bailey, Dominik Duell, Ellen Meade Thomas Gschwend, James Lo, Louis Raes, Jon Slapin, and Jakob Willisch for thoughtful comments and criticism. The authors also thank Alyssa Taylor, Jakob Willisch, Elisa Wirsching, and Kelsey Worboys for excellent research assistance. The authors thank the DFG for Funding under the SFB 884 Political Economy of Reforms C4 project and three anonymous reviewers for helpful comments.