Introduction
The study of societal crises has become urgent in recent years due to increasing turbulence of many contemporary societies associated with the interconnected threats of environmental breakdown, rampant economic and social inequality, migration, and polarization, among other forces. Efforts to explain why crises occur and how they impact historical trajectories have been the focus of much previous scholarship concerned with macrohistory, secular cycles, polity lifespans, and social complexity. Although many efforts have been made to explain why crises occur and why some result in more severe consequences than others, no clear consensus has emerged. At present, there is not even a widely agreed-upon definition of what a crisis actually is or how to identify when one strikes. When, for instance, can any particular crisis be said to truly start or end? How devastating must the impacts be to count as a “crisis” rather than just an adverse event? How can we understand different crises that occur over varying timescales? Indeed, why is the blanket term “crisis” applied to seemingly quite disparate types of events that occur across a wide range of geographical and complexity scales? From those covering major global threats to challenges faced by states, to the stresses experienced by sub-national groups, or even very local communities, and likewise the specific disasters that arise from such crises, which represent a multitude of events, from worldwide macroeconomic shocks or major pandemics to the threat of interstate warfare to the immiseration of specific social groups from, for example, a lack of access to food, healthcare, or affordable housing.
To help resolve some of these lingering questions, here we describe our extensive, systematically collected, cross-cultural dataset cataloging instances of crisis in the past: the Crisis Database (CrisisDB). In this article, we detail the methods undertaken in developing this sample of past crises and present the results of several analyses performed on these data. These analyses seek to uncover potential patterns in the experience of crisis among societies in widely different times and places, while exploring potential correlates identified in previous work as shaping the course taken both during and after a crisis takes root. We close with a discussion highlighting the importance of our findings for understanding the dynamics of crises more generally and point to future research required to understand some of the interesting patterns suggested by our dataset. In support of this, we make the dataset explored here openly available, inviting other scholars to bring novel analyses to bear on these questions and to continue building the empirical record by adding new crisis cases to our data collection. A description of the full scope and aims of the CrisisDB program is available in the Supplementary material.
Prior approaches to understanding crises and their outcomes
For clarity, we must note here our own working definition of “crisis” and how it has been applied in creating the CrisisDB. The introduction touches on the fact that understanding precisely what a “crisis” is — or what it entails — has not been universally pinned down, but regardless of how the term is used by different researchers, there is broad agreement that it can be characterized as an acute and/or growing risk that manifests into a disaster with adverse consequences. The Cascade Institute offers a prominent and useful definition, noting that crises occur when forces “push [a] system out of its established equilibrium and into a state of disequilibrium or instability,” which in turn “generates harmful outcomes, such as loss of income or deaths and injuries from violent conflict, malnutrition, starvation, or disease” (Lawrence et al. Reference Lawrence, Thomas Homer-Dixon, Rockström, Renn and Donges2024, 13–15). Mark et al. (Reference Mark, Holder, Hoyer, Schoonover and Aldrich2025) expand on this further by viewing crisis as a period of heightened and ongoing risks and their realized states, namely, adverse outcomes of different types and degrees of severity. In addition, it has been argued that the manifestation of any crisis and the extent of its consequences are also affected directly by factors specific to a society, such as state resilience, public well-being, civil unrest, or ecological stresses, to name a few, which means that the same crisis may be felt entirely differently across countries or even among social groups within the same country (Hoyer et al. Reference Hoyer, Bennett, Reddish, Holder, Howard, Benam, Levine, Ludlow, Feinman and Turchin2023). From a functionalist perspective, in which social institutions are thought to contribute harmoniously to the reproduction of the social order (Elster Reference Elster, Matravers and Pike2003; Sciortino Reference Sciortino and Bryan2008), crises are difficult to explain at all. Crises often represent major breaks in that functioning, sometimes also marking thresholds or transition phases during regime change.
Taking all of this into consideration, we therefore work here with the understanding that crises exist as part of a spectrum and that not all crises have characteristics or consequences of an identical nature or magnitude (Holder et al., Reference Holder, Ainsworth, Aldrich, Bennett, Feinman, Mark, Orlandi, Preiser-Kapeller, Reddish, Schoonover, Turchin and Hoyerforthcoming). They can range from “clearly one-off, mono-systemic, locally constrained turmoil to multi-systemic and recurrent disasters to macroregional social and ecological distress to the deep causal entanglements of our present age” (Mark et al. Reference Mark, Holder, Hoyer, Schoonover and Aldrich2025, 20). Crises, then, can be varied in their traits, taking different forms, levels of severity, and resulting consequences, which may in turn all be felt differently by specific groups depending on their existing resilience and responses to the crisis. But the characteristics that all crises do share is that they inflict difficulty or danger for a population or state and require decisions to be made in response to the challenges and potential outcomes that they pose. As we will see in our analysis, this has been true of historical crises as much as it is apparent today.
While definitions of crisis may differ in some of the specific details, the subject has received a great deal of attention, particularly from scholars looking to uncover why and how societies experience disasters, social unrest, civil turmoil, and even societal collapse (for a review of approaches to these critical topics in historical work, see Hoyer et al. Reference Hoyer, Bennett, Reddish, Holder, Howard, Benam, Levine, Ludlow, Feinman and Turchin2023). The majority of work detailing crises in specific historical contexts aims not to identify general patterns but to expose the forces and “inciting incidents” that drove particular periods of unrest in the societies under question. The Taiping Rebellion (1850–1864), for instance, represents a major crisis during the latter stages of the Qing Dynasty rule in China, considered the bloodiest civil war in history, which led to the deaths of an estimated 20–30 million people. The Qing dynasty was ultimately victorious, eventually able to suppress the rebellion, although they were severely weakened and collapsed just fifty years later. Different scholars have pointed to various stresses leading to the crisis— from unrest among frustrated scholarly elite unable to find top positions, to economic stress from the Qing’s growing trade imbalances, to pressure from external enemies in Britain, Japan, and elsewhere, to the disruptions caused by recurrent ecological stress coming at the tail end of the Little Ice Age period (for a review of these points, see Orlandi et al. Reference Orlandi, Hoyer, Zhao, Bennett, Benam, Kohn and Turchin2023). The seventeenth-century crisis in the Ottoman Empire similarly saw violent uprisings, assassinations of rulers, and repeated ecological disasters, including major epidemic outbreaks, which have been cited as both the drivers of crisis and prolonged unrest, as well as being the features that characterized the impact that the crisis had in different parts of the empire (Tezcan Reference Tezcan2009; White Reference White2010). In other societies, crises were largely confined to elite families vying for control during contested royal succession, such as those documented in the fourteenth-century Chagatai Khanate, in the Inca empire at the end of the fifteenth century, and in Big Island Hawai’i in the late sixteenth century. Recent work by Broadberry and Wallis (Reference Broadberry and Wallis2025) looks at the relationship between long-run economic changes and the types of regime change experienced across varying countries, arguing that political crises can only be understood by exploring economic developments – and the relationship between these dynamics – in tandem.
Despite the growing interest in the study of crises, little work has been done to date offering explicit, formal mathematical models of historical crises or the dynamics that they exhibit. Some intriguing recent work has sought to model, or at least make more explicit, causal theories about the forces that lead to societal collapse or how societies exhibit resilience to major crises, such as from ecological stress (e.g., Bardi et al. Reference Bardi, Falsini and Perissi2019; Faulseit Reference Faulseit and Ronald2016; Guedes et al. Reference d’Alpoim Guedes, Crabtree, Kyle Bocinsky and Kohler2016), though these generally focus on a fairly narrow handful of specific cases and crisis types, without exploring overarching patterns across a large number of cases. There are models seeking to describe the dissolution or fragmentation of historical societies (e.g., Bennett Reference Bennett2022; Fernández-Villaverde et al. Reference Fernández-Villaverde, Koyama, Lin and Sng2023), though these typically do not address the crises that may have precipitated societal collapses in any detail. There is a growing number of dynamic models in the economics literature, many of which deal with major crises like supply shocks or major recessions (e.g., Klimek et al. Reference Klimek, Poledna, Farmer and Thurner2015; Pichler et al. Reference Pichler, Pangallo, Maria del Rio-Chanona, Lafond and Farmer2022), though few of these deal with pre-industrial societies and are typically focused on economic forces, rather than societal-level outcomes and disruptions as we do here.
Indeed, historical scholarship has remained generally slow in turning theoretical, conceptual work into formalized, dynamic systems-level models; as one historian put it, “At present, the field [of history] needs models that start to synthesize knowledge from traditional sources, archaeology, and the natural sciences” (Harper Reference Harper2018, 4). Such interdisciplinary work, combining the insights from historical scholarship with some of the quantitative methods from the physical sciences, is a critical direction for future scholarship, which we discuss further below.
There is a growing body of theoretical and empirical scholarship, however, which does seek to understand the nature of societal crises as they have impacted both past cases as well as contemporary ones. Indeed, many prominent scholars have sought to identify patterns in how common, or particularly severe, crises have been, though the results have been highly conflicting. Pinker, for instance, famously argued that crises, especially those leading to internal violence or warfare between states, have become somewhat less frequent and markedly less severe over time as institutions have evolved, the global economy has become increasingly intertwined, and organizations like the United Nations have provided mechanisms to resolve such conflicts and disputes (Pinker Reference Pinker2012; see also Baten et al. Reference Baten, Benati and Sołtysiak2023; Bessel Reference Bessel2015; Goldstein Reference Goldstein2012). Some scholars have added nuance to this picture, highlighting, for instance, that early modern imperial nations may have facilitated resilience in their own heartland but simultaneously created conditions for unrest and crisis in their outlying territories (Acemoglu and Robinson Reference Acemoglu and Robinson2012; Chase-Dunn et al. Reference Chase-Dunn, Richard Niemeyer, Lawrence and Love2012). In a similar vein, Fukuyama (Reference Fukuyama2011) and others stress that representative, responsive democratic governments, typified especially by modern nation-states in Northern Europe, have curtailed major crises by managing collective well-being effectively and thus developing highly resilient systems; according to this line of thought then, even when crises do emerge, they are likely to be relatively less severe or perhaps less prolonged than those that occurred in earlier periods. Others, though, point out that recent experiences with economic turmoil, internecine violence and interstate wars, and a continually deteriorating environment belie any notions that crises are becoming less frequent or less severe globally (Braumoeller Reference Braumoeller2019; Covey Reference Covey2020; Fry Reference Fry and Douglas2013; Lewis and Lewis Reference Lewis and Lewis2018). Such arguments combine ideas about institutional and/or economic development and geographic differences in explaining how incidence of crises and violent events is experienced by varying types of societies, or across more-or-less developed contemporary states (i.e., between Global North and Global South nations) (Broadberry and Wallis Reference Broadberry and Wallis2025; Geller and Singer Reference Geller and David Singer1998; Lemke Reference Lemke2002).
Additionally, it has also been posited that certain social or cultural formations are more or less prone to crisis. Here too, the results have been equivocal: larger and more complex societies have been seen alternatively as helping to manage internal tensions and so being less prone to experiencing major crises (Boyd and Richerson Reference Boyd and Richerson2009; Henrich Reference Henrich2015; Morris Reference Morris2014), but also as institutionalizing exploitation and reifying structural inequalities that exacerbate tensions, thereby leading to more frequent and severe outbursts of social unrest and violence than those experienced by smaller-scale, less centralized forms of government (Graeber and Wengrow Reference Graeber and Wengrow2021). Scholars who focus on the boom-and-bust cycle of societies note that when less complex polities enter crises, human suffering is often very high, though it is less likely to lead to a complete collapse of the polity (Flannery Reference Flannery1999; Gavrilets and Fortunato Reference Gavrilets and Fortunato2014; Tainter Reference Tainter1988; Yoffee and Cowgill Reference Yoffee and Cowgill1991). Similarly, some argue that certain types of religious and ideological practices promote cohesion and so help defuse internal tensions and stave off, or mitigate the impacts of, societal crises (Norenzayan Reference Norenzayan2013; Spicer et al. Reference Spicer, Willis Monroe, Hamm, Danielson, Canlas, Randall and Slingerland2022; Whitehouse Reference Whitehouse2022). One especially prominent line of scholarship holds that the major world religions practiced in large numbers today, with their emphasis on moralizing forces, are especially effective at reducing social tensions even in very large, diverse societies. Buddhism, in particular, is often singled out as promoting peaceful interactions between groups, though critics point out this association is somewhat specious (Holt Reference Holt2019; Wade Reference Wade2019; Yeh Reference Yeh2006). Indeed, the enormous death toll suffered in violent conflicts where these world religions were prominent might suggest otherwise.
Another line of thinking holds that crises with more severe, disruptive impacts lead to greater systemic transformation (Belich Reference Belich2022). The reasoning here is that societies, especially the more complex they get, have developed systems specifically to ensure that core institutions, like political structures or economic practices, persist through periods of crisis. Therefore, some major disruption is needed to break through this type of “path-dependence” or “entropy” (or, perhaps better, “resilience”) in societal functioning, which can otherwise preserve itself or adapt to changing contexts. Consider, for example, the bubonic plague, which devastated the population of Eurasia in the later Middle Ages period, yet is increasingly credited with breaking previously entrenched social, political, and economic systems in certain areas (particularly northern Europe). This allowed novel systems to develop during and after the severe crisis, which ultimately put these societies on the path to industrialization and modern development earlier than others (Scheidel Reference Scheidel2017).
There are also a handful of macrohistorical theories that explore the “lifespan” of a society and the limits of social longevity as being a key factor in how a crisis may unfold in a particular polity (e.g., Scheffer et al. Reference Scheffer, van Nes, Kemp, Kohler, Lenton and Xu2023). This work suggests that there is an increased risk of societal collapse over time as increasing complexity, population growth, strain on key institutions, exploitation or corruption among ruling classes, resource degradation, and/or other possible factors leave the society more vulnerable to severe outcomes, particularly when multiple stresses are present (Butzer Reference Butzer2012; Homer-Dixon et al. Reference Homer-Dixon, Walker, Biggs, Crépin, Folke, Lambin, Peterson, Rockström, Scheffer, Steffen and Troell2015; Turchin and Nefedov Reference Turchin and Nefedov2009). However, others argue that the idea of a societal lifespan is too deterministic – even inappropriately anthropomorphizing – and does not always account for the nuances of each polity and its governance, concluding that “maturing” does not consistently affect societies at the same rate, meaning the analogy with biological ageing appears unsubstantiated (Centeno et al. Reference Centeno, Callahan, Larcey, Patterson, Miguel, Peter, Paul and Thayer2023; Sandberg Reference Sandberg, Miguel, Peter, Paul and Thayer2023).
There are also several shortcomings in much of the previous crisis scholarship that attempts to find general patterns. First, there is a tendency to focus on a small set of crises that demonstrate a particular pattern, such as drought-induced societal collapse (Arnold et al. Reference Arnold, Hillman, Abbott, Werne, McGrath and Arkush2021; Gill et al. Reference Gill, Mayewski, Nyberg, Haug and Peterson2007; Weiss Reference Weiss2017). This can lead, of course, to a small-sample-size bias. Second, crises are typically defined by their eventual outcomes – fights over succession, major population loss from warfare, and/or ecological stress, disruption in state functions – with certain ostensibly key events in the lead-up to these outcomes then described as a way of explaining the cause of the crisis. This would mean that a strict definition that places the arrival of crisis only at the point that the dysfunction is realized, for instance, would not consider the Cuban Missile Crisis a true crisis because the threatened devastation from the specter of nuclear war never occurred. This approach also runs the risk of predisposing research to sample only from severe or dramatic events, which prevents analyses of a full range of crisis dynamics that may, for example, include less destabilizing outcomes, or allow for the identification of high-risk situations that never fully materialized into any clear crisis (Mark et al. Reference Mark, Holder, Hoyer, Schoonover and Aldrich2025). Focusing on only the severe consequences or on particular outcomes (like civil wars, high fatality rates, or societal fragmentation), especially when done in narrowly focused, small sample-sized studies, can obscure the relationship between the crisis period itself – namely, a period when a society faces high (and often growing) risk of some systemic dysfunction or transformation – from the factors and forces that produce the outcomes that are actually experienced.
When creating the CrisisDB – as we explain in more detail in the Method section – we sought to avoid (or at least minimize) the shortcomings in existing studies in two ways. First, by identifying a crisis as a situation of high risk and social pressure, which is distinct from any specific set of outcomes or experiences that arise from that situation. Second, we coded a variety of possible outcomes that could occur during and in the immediate aftermath of these crisis periods to map out the range of consequences that may be experienced. These choices allowed us to capture outcomes with both lesser and greater severities, the often- overlooked “positive” transformations (which we term “reforms,” as explained in the “Defining Crisis Consequence Variables and Potential Correlates” section), as well as completely unrealized crises – namely, situations in which some social pressure or potential for disastrous outcome existed yet did not materialize – and everything in between. We thus sought to capture the full range of crisis consequences by focusing on the outcomes and maintaining a fairly loose and flexible definition of crisis onset. We then explored patterns that may be present in these outcomes as well as tested some of the key forces that have been argued to drive, or at least correlate with, the observed outcomes. This approach raises a number of conceptual and methodological challenges, which we discuss below. Nevertheless, we argue that such an approach is critical to uncover not only the reasons why some crises lead to devastating consequences but also, and perhaps more significantly, why in other cases societies seem able to “weather the storm” and avoid more severe outcomes. It is in these examples, we argue, that we are most likely to find relevant insights from the past that may help navigate similar crises in the present and future (Hoyer et al. Reference Hoyer, Bennett, Reddish, Holder, Howard, Benam, Levine, Ludlow, Feinman and Turchin2023; Mark et al. Reference Mark, Holder, Hoyer, Schoonover and Aldrich2025).
Methods
Building the crisis database sample
We define crisis as a period of high societal stress and risk of systemic dysfunction – in effect, crises are times when signs of unrest, institutional failing or decline, and/or socio-political instability appear on the rise compared to previous generations (until roughly 50 years earlier). Given that this and other definitions of crisis are fairly general and might refer to a host of different types of risks and disasters, we make no a priori assumptions about there being any single characteristic type of crisis, or what the relationship between different sorts of outcomes might be. Rather, we seek to track the ways that crises, once they arose, ended up impacting societies at different levels; we distinguished outcomes that affected primarily a society’s rulers, its governing institutions, other socioeconomic powerholders, the general populace, and its security and sovereignty with respect to neighbors. While other outcomes are possible, we selected these as the primary categories of focus for this project based on our survey of the relevant historical and theoretical literature (as described above).
The term “crisis” may not be considered by some to be the most accurate terminology for these periods, as what we are specifically interested in for this study are situations that have the potential to turn into a realized disaster. In this way, we attempt to separate the entry into, and the resulting experience of, the identified crisis period from any particular or preconceived outcomes. We do this to avoid oversampling particularly dramatic cases or prefiguring our analyses of the principal drivers of crisis, as well as the potential impact of resilience and conflict resolution on crisis dynamics, as mentioned above. For each “crisis case,” we code a number of variables (detailed below) that catalog the different events that may have occurred as a result of this period of stress, creating what we have named The Crisis Database (CrisisDB).
Our working definition of crisis presents a number of additional challenges in compiling a representative and unbiased sample. Primarily, it is extremely difficult to identify crisis situations without reference to any specific outcomes. Generally, we lack clear, quantitative estimates of social pressures for societies of the past, and indeed in many modern cases. Further, often the less severe cases that we need to include to make our sample truly representative are not described as crises in the historical literature, since typically crises are defined largely with reference to their eventual impacts, as explained above. We thus began by compiling a list of polities for which we knew information was widely available, notably polities in Eastern Europe, Northwestern Europe, North America, and parts of South America. We then focused on periods of rising societal tension by following well-trodden discussions of crises and general socio-political upheaval. This was an iterative process to identify several potential crisis periods, explore these in the scholarship, and then, through discussion with domain experts associated with the project (including several of the coauthors of this article), refine our crisis periods for the database. We repeated this process until we had a fairly representative sample of “definitive” crises alongside “potential” crises – namely, high-risk situations that exhibited less or no severe outcomes.
An additional challenge was in defining the temporal limits of each crisis case. This is a problem faced by any work exploring crises, but one that was made more acute by our goal of tracking the relatively long periods in which social pressure builds, creating a crisis situation, distinct from the manifestation of that crisis itself; in other words, we could not simply date a crisis by any specific event (such as a civil war lasting for a certain number of years) or dated to a single year (for example, when a major rebellion or ecological shock struck). Rather, we followed the scholarship on each society, erring on the side of having broader, rather than narrowly defined crisis periods, in order to capture as much of the societal dynamics as possible. The dates given to our crisis periods are, ultimately, meant to serve as general guidelines to identify likely periods of tension leading to (possible) outbreaks of varying crises. This was necessary to constrain the coding of our outcome variables to a particular “moment” of stress, rather than focusing on either a specific outcome, or else, coding whether the variables were present at any point in time over the entire polity period. Undoubtedly, some historians may have legitimate disagreements with our final dating scheme, and, as we discovered in the process, other methods of periodization would certainly be fitting across many of the crisis cases.
To construct the final selection of cases presented here, a larger sample of approximately 250 cases was initially studied. We worked directly with historical experts (details in the Supplementary material) to ensure that our sample was accurate, well-represented, and in line with the most current scholarly understanding of each crisis and the corresponding polity. The final set of 168 cases that we selected (listed in Table S1 in the Supplementary material) is reasonably representative, including cases from all major world regions and covering a period from the Bronze Age to the early twentieth century. However, due largely to data availability, the sample is somewhat skewed towards more recent periods – roughly half of the cases are from the post-1000 CE period – and towards Eurasian societies, which may appear somewhat overrepresented as well. We made deliberate efforts to include societies from other areas (see Supplementary material for details) and to address issues of data availability for the key dimensions that we wanted to explore in analyses (see our Data Availability statement below); we return to these potential limits in our conclusions in the Discussion section.
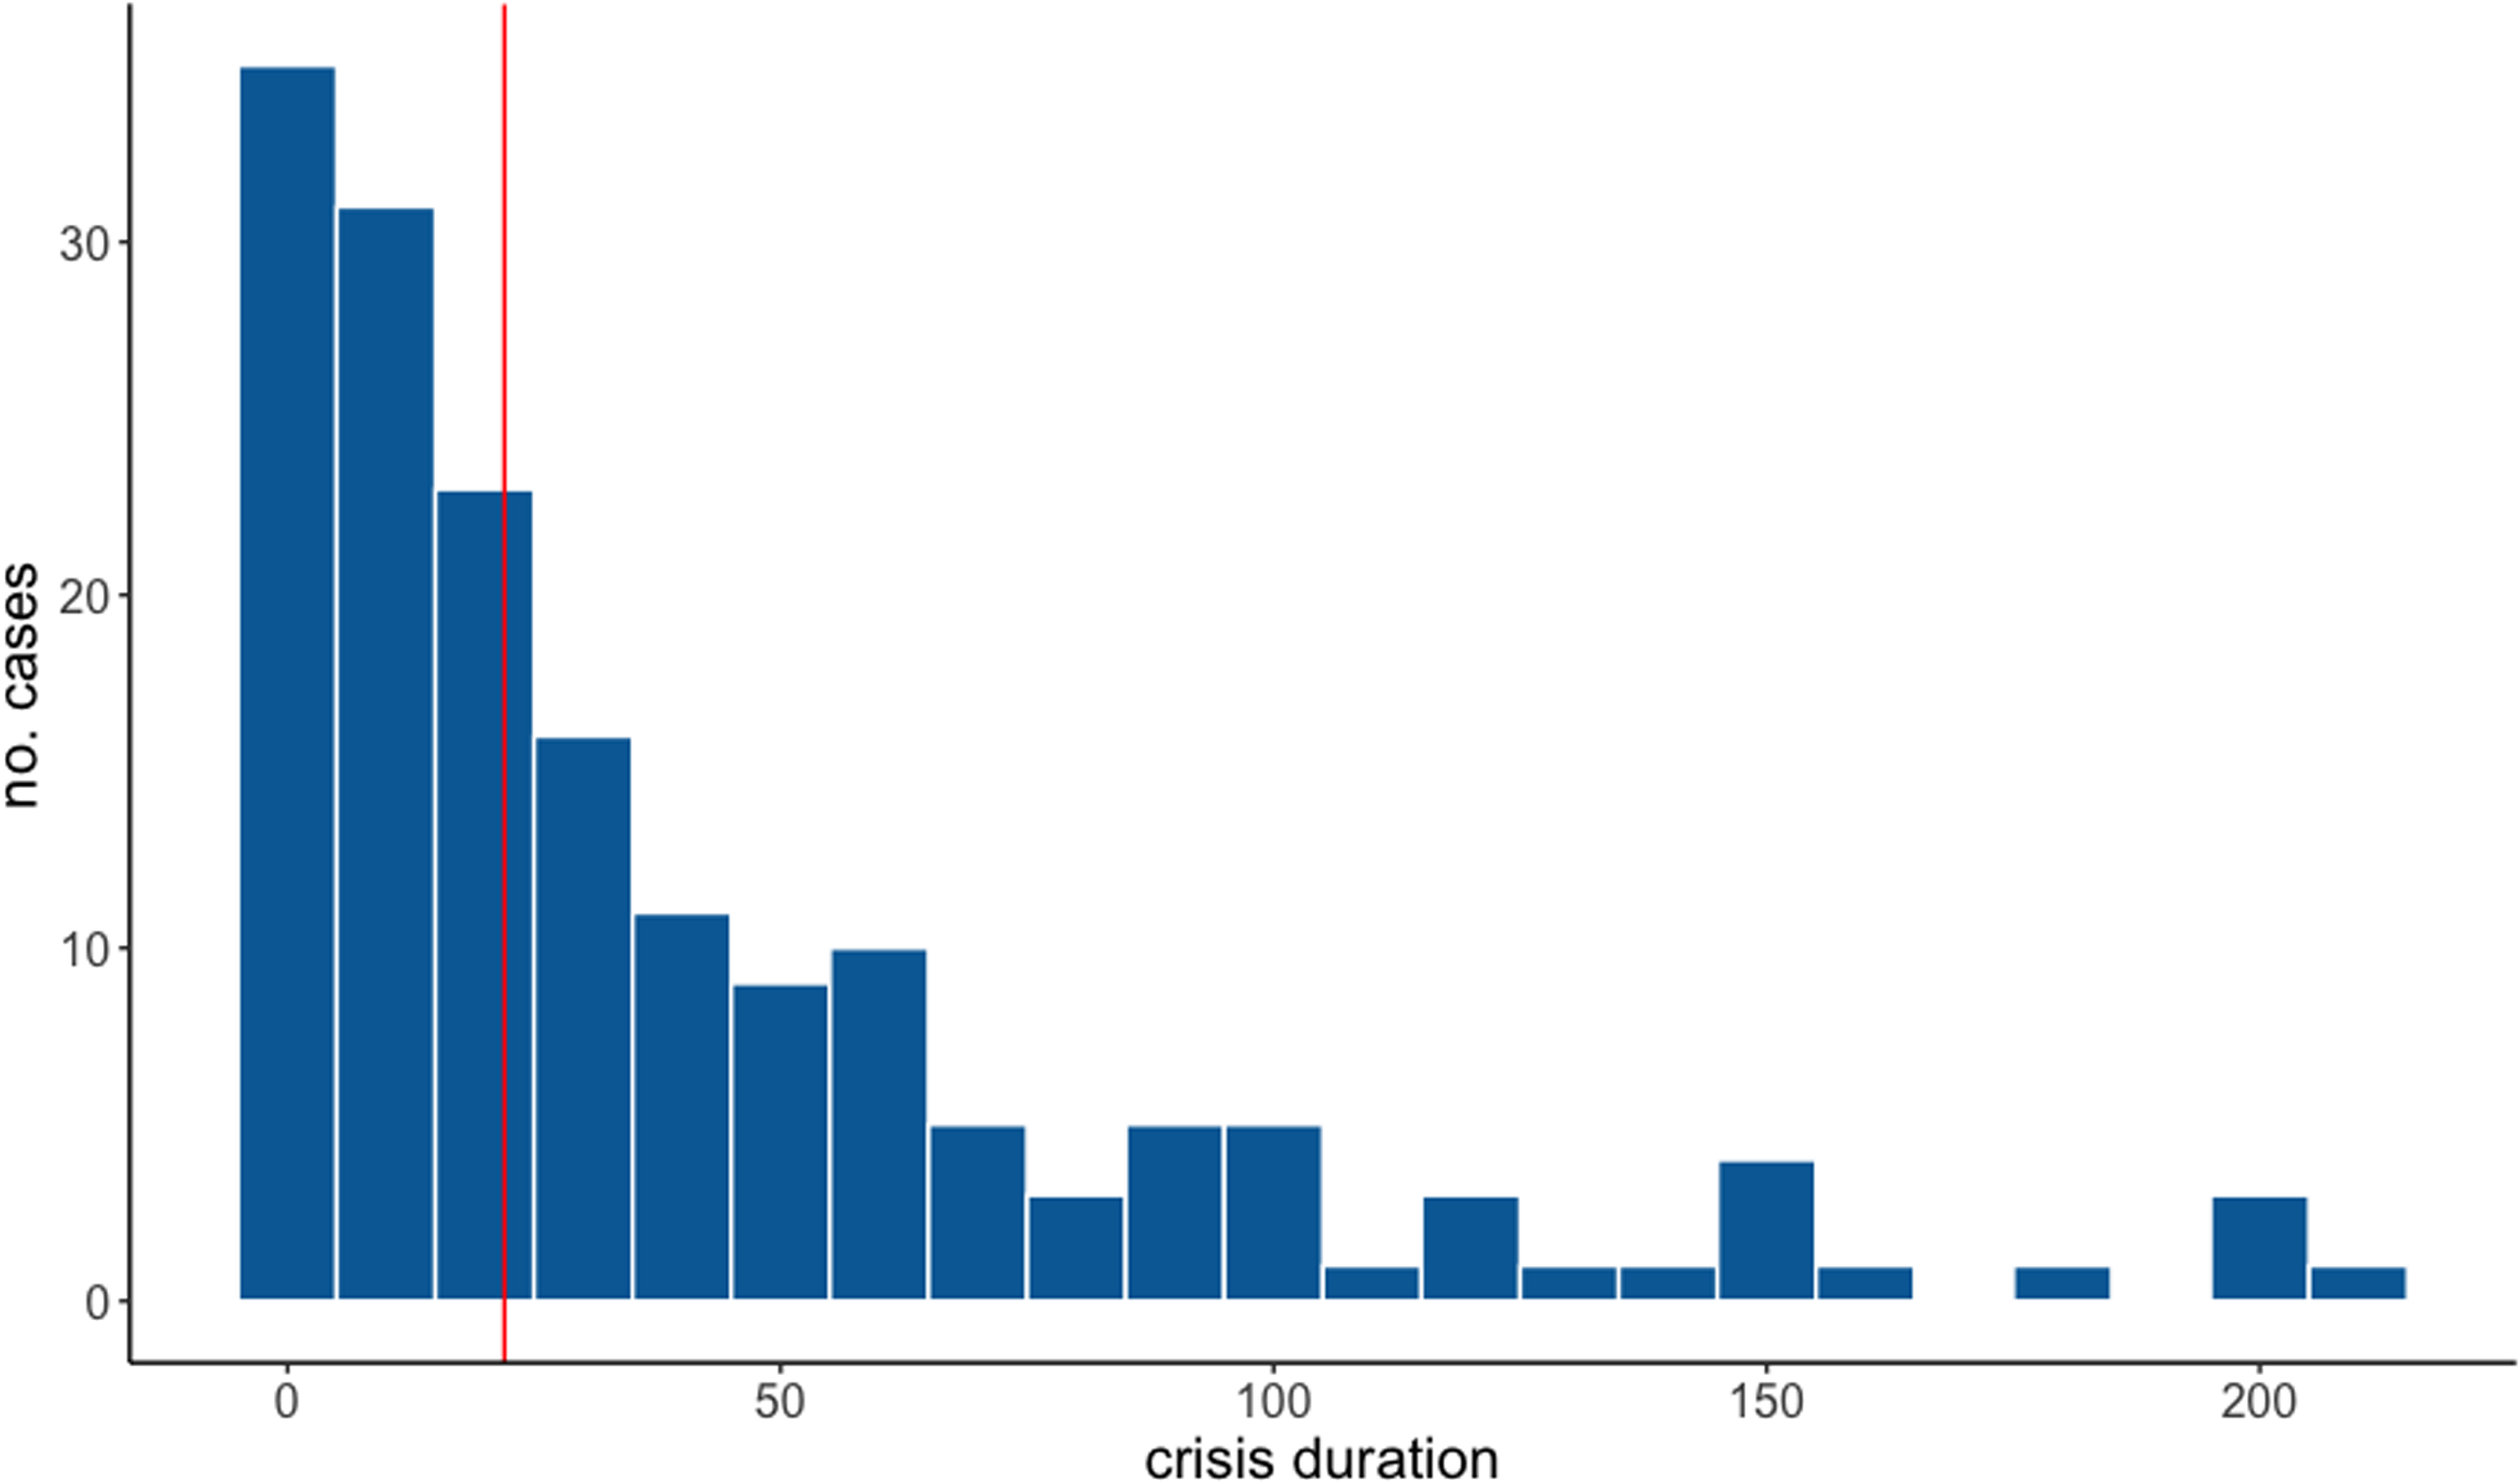
Figures 1a and 1b show the distribution of final cases by year and by spatial region. The distribution of the crisis durations of our final set of cases is shown in Figure 2. The median duration is 22 years, which suggests that over half the crises in our database were resolved within a generation.
a. Distribution of cases over time. b. Distribution of cases by world region.

Distribution of crises by duration in years (decades). Red line indicates median duration (22 years).

Defining crisis consequence variables and potential correlates
We explore crises – or potential crises – with a focus on how they impact particular societies, which we term “polities.” Following the established Seshat procedures (Turchin et al. Reference Turchin, Whitehouse and François2018b), we define a polity as an independent political unit, which can range from villages (local communities) through simple and complex chiefdoms to states and empires. A polity can be either politically centralized or not (e.g., organized as a confederation). What distinguishes a polity from other human groupings and organizations is that it is politically independent of any overarching authority; it possesses sovereignty. Polities are dynamic entities, and thus their geographical extent may change with time. Thus, typically each polity will be defined by a set of multiple boundaries, each for a specified period of time. We are also interested in the impact of crisis periods on different segments of a population, but focus here on the societal-level forces that affect governance, administration, and the institutions and policy decisions that shape the resulting experiences that a polity undergoes as a result of the crisis period.
For each crisis case, we code twenty-one variables seeking to capture the range of outcomes experienced (or not) by the polity in question. These measures have been collected into several broader categories (detailed in the Supplementary material), distinguishing outcomes that primarily affect the following groups:
-
the general population (sum.popular), which includes significant demographic shocks caused, for example, by warfare, disease outbreaks, or ecological disasters
-
the elites (sum.elites), which track significant periods of downward social mobility (loss of status or privilege) or the mass deaths of wealthy (usually land-owning) groups
-
the rulers and ruling families (sum.rulers), including assassinations, depositions, and other forced abandonments of position
-
the state itself (sum.state), which may experience major popular uprisings, revolutions, and civil wars, as well as loss of control over certain territory or key centers like administrative capitals
-
consequences driven by external polities (sum.external), such as the conquest of all or part of the polity.
To get a single measure of the severity of crisis outcomes, we sum these five characteristics to produce a composite score (sum.turmoil). This relatively simple procedure is suitable for our analyses seeking to uncover patterns in the co-occurrence of these different categories in our sample. In the Supplementary material, we explore each of these categories in turn (Figures S1–S6), showing how well they correspond to the sum.turmoil score as a check on the validity of this simple aggregation measure.
We also include a category capturing the reforms undertaken during or immediately after the crisis period (sum.reform), which includes significant changes in constitutions (such as a transformation from an autocratic to more representative form of governance), rules safeguarding or benefiting laborers, abolition or restrictions in enslavement or serfdom, expansion of suffrage, major public goods programs, and changes in religious protections or promotion. We focus here on what might be considered “positive” or adaptive reforms that increased the well-being, inclusivity and access, and freedoms experienced by mostly non-elite populations. These measures spotlight the societal-level actions and policy choices, particularly those in the public sector, to correspond with our primary goal of exploring the role of state agents in mitigating – or exacerbating – the severity of crises as they unfold. This decision was made with reference to relevant theoretical literature – which emphasizes the role of institutions in preventing the more severe, violent outcomes of crisis – as well as to provide balance in our data ensuring that we are assessing both the destabilizing outcomes (captured in our sum.turmoil measures) and the potentially stabilizing or beneficial outcomes (represented in the sum.reform measures) of these crisis situations Certainly other reforms could be included, notably those focusing on non-state actors such as economic agents or ideological leaders (e.g., prominent religious officials). While beyond the scope of our present work, the inclusion of a wider set of reforms is a prime candidate for future work as we look to expand the CrisisDB.
In addition to these crisis-specific variables, we explore polity data on a number of potential correlates, as suggested by our review of previous literature on the topic. These include variables about the timing of crisis, both in terms of the calendar year (Time) when the crisis first emerges (according to our coding procedure), as well as how long into a polity’s lifespan each crisis begins, which we measure as the percentage of the polity’s total duration that had elapsed at the point of the crisis start date (PolElapsed). We record the location of each polity by the world region (Europe, Southwest Asia, etc.) (World. Region). We also record the predominant religion practiced in each polity, which we then translate into a binary variable indicating whether the polity practiced one of the current so-called “world religions” (Buddhism, Christianity, Hinduism, Islam, and Judaism) or not (World. Religion).
Finally, we adopt measures of sociopolitical dimensions, which include polity characteristics describing the following:
-
scale (Scale), which combines measures of the polity’s territorial extent, overall population, and population of the largest settlement
-
hierarchical complexity (Hier), measuring the polity’s administrative, military, religious, and settlement hierarchies
-
governance (Gov), measuring the professionalization and standardization of government offices and positions
-
infrastructural development (Infra), measuring the variation in infrastructure maintained in the polity (bridges, roads, ports, etc)
-
informational complexity (Info), measuring the media and institutions used to convey information (presence of writing, systems for record keeping, etc.)
-
monetary sophistication (Money), measuring the different instruments for exchange and storing value utilized by the polity (token currency, stamped coins, paper money, etc.).
We also include a single measure of complexity (SPC1), operationalized as the first principal component of these six measures.
Additional details on our coding procedure are provided in the Supplementary material.
Results: the past reveals no ‘characteristic crisis’
Crisis cases yield diverse outcomes
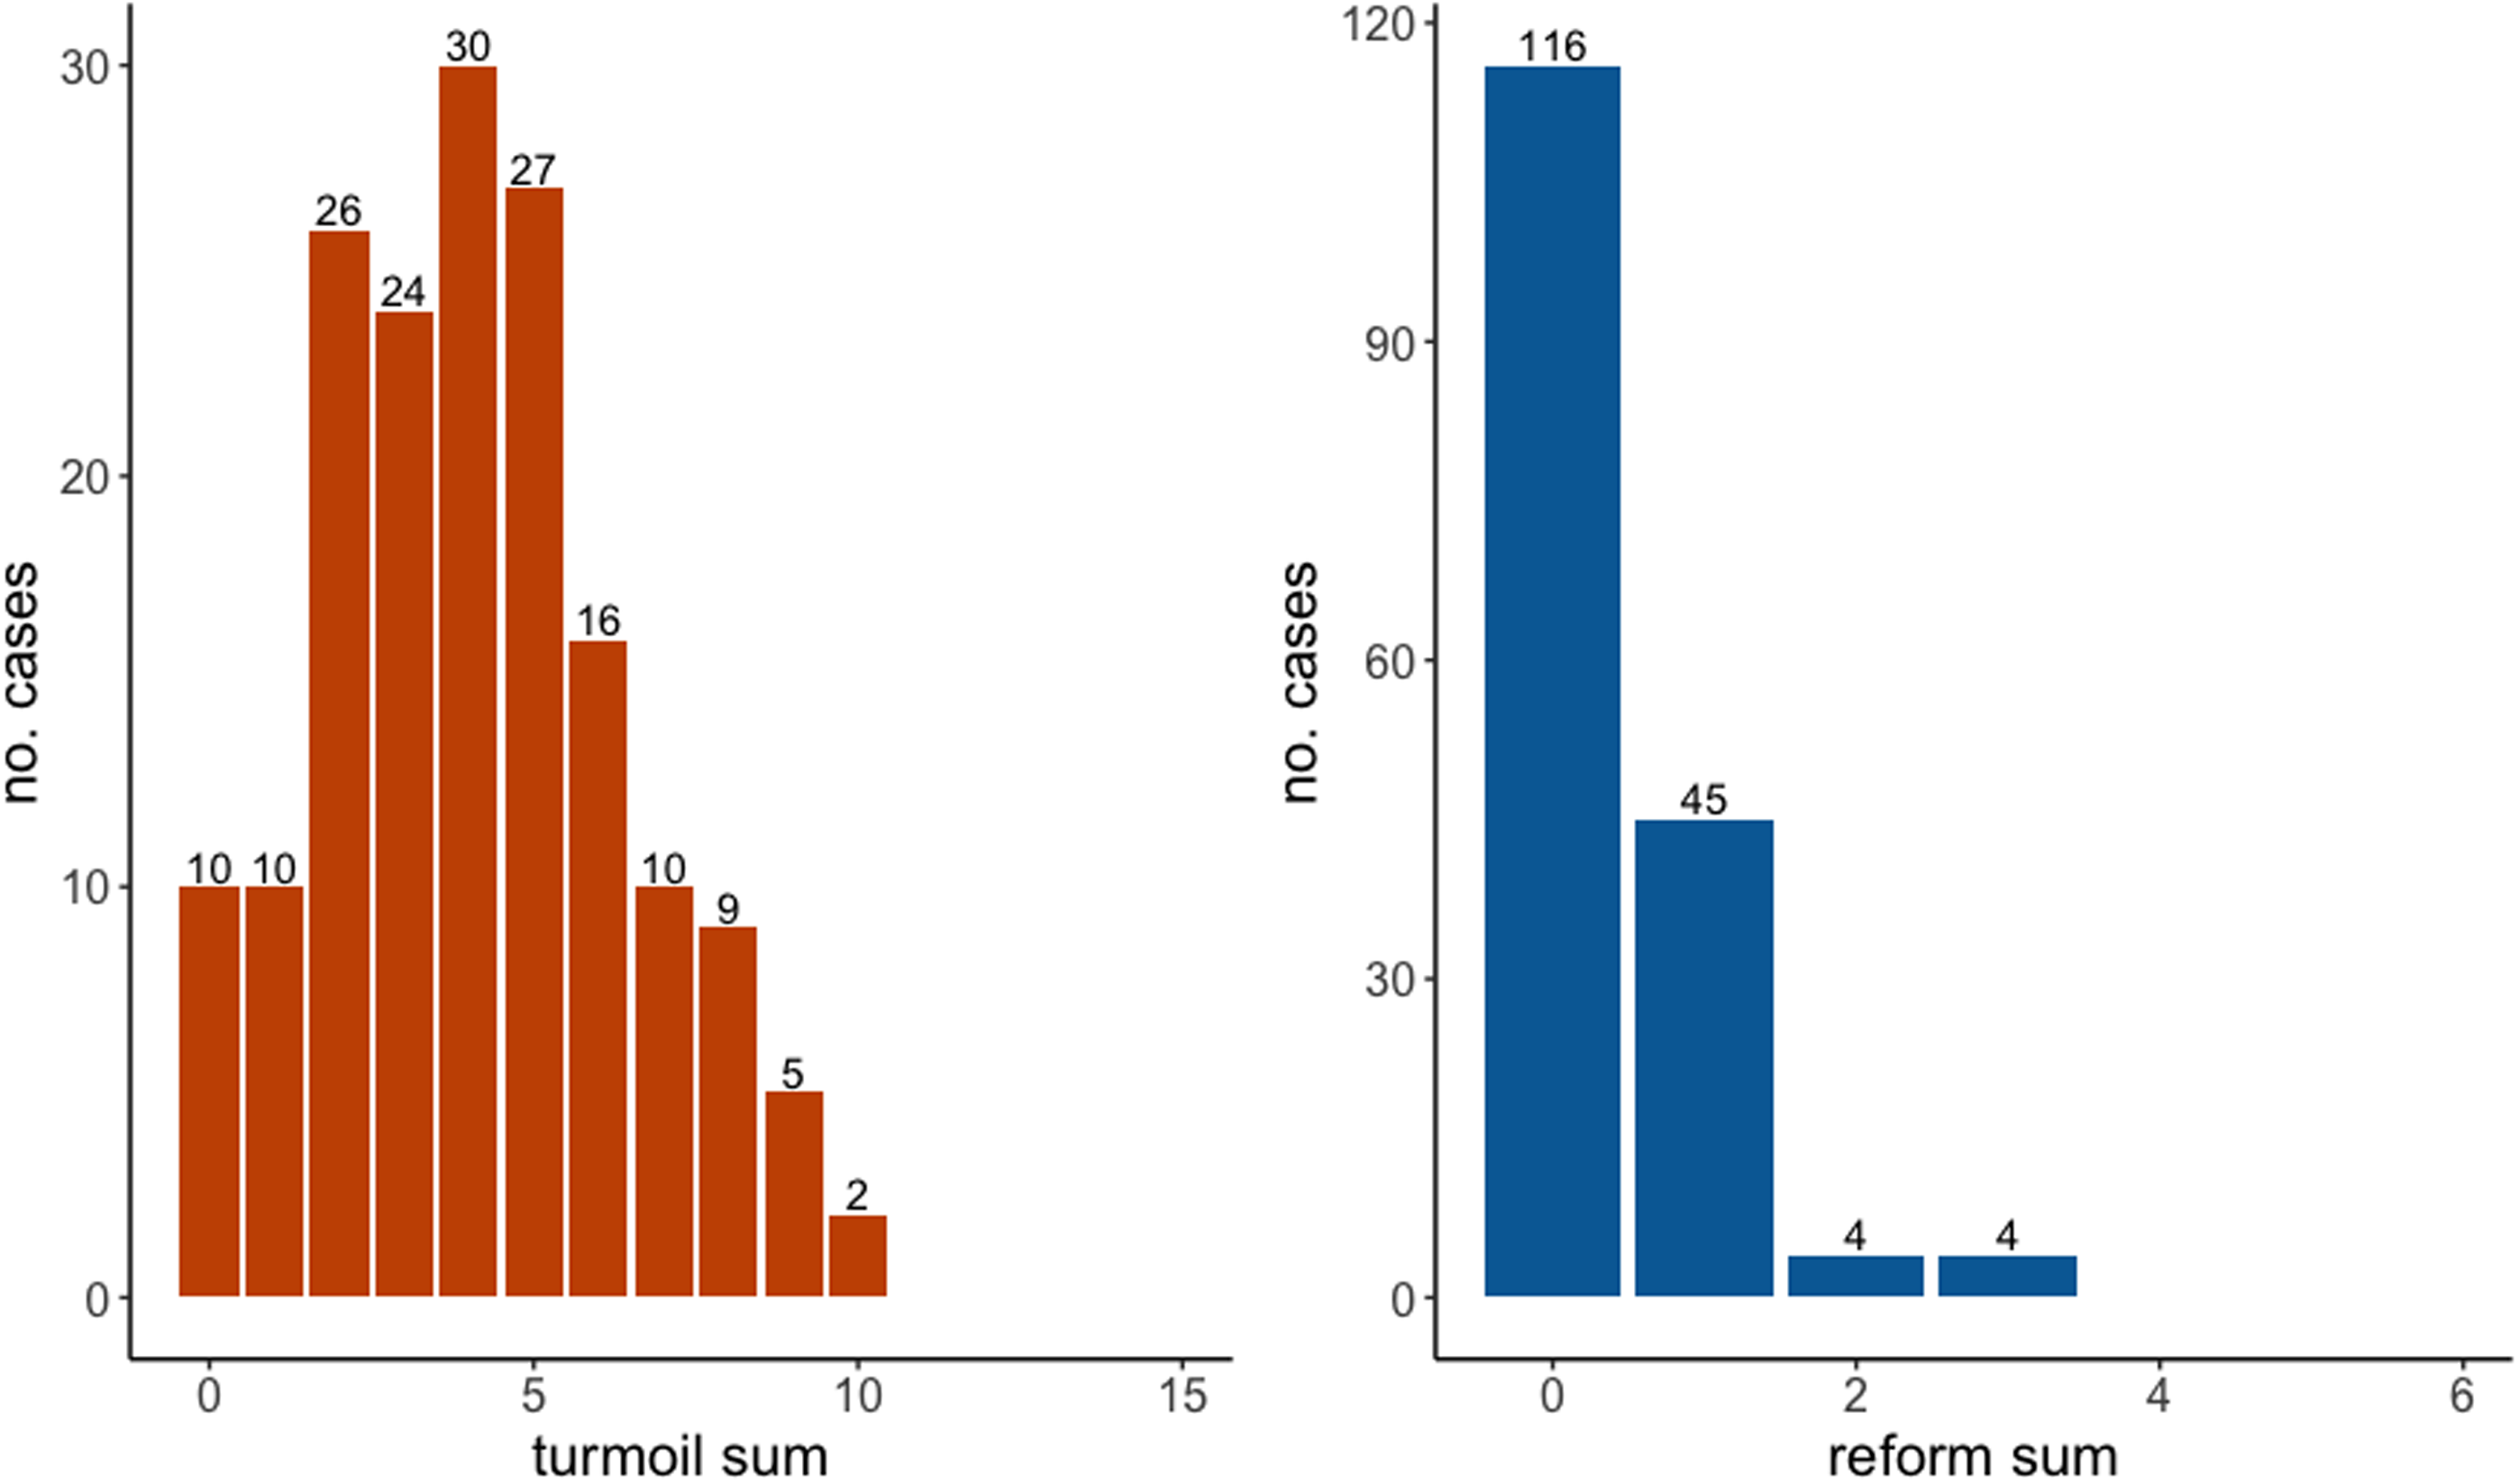
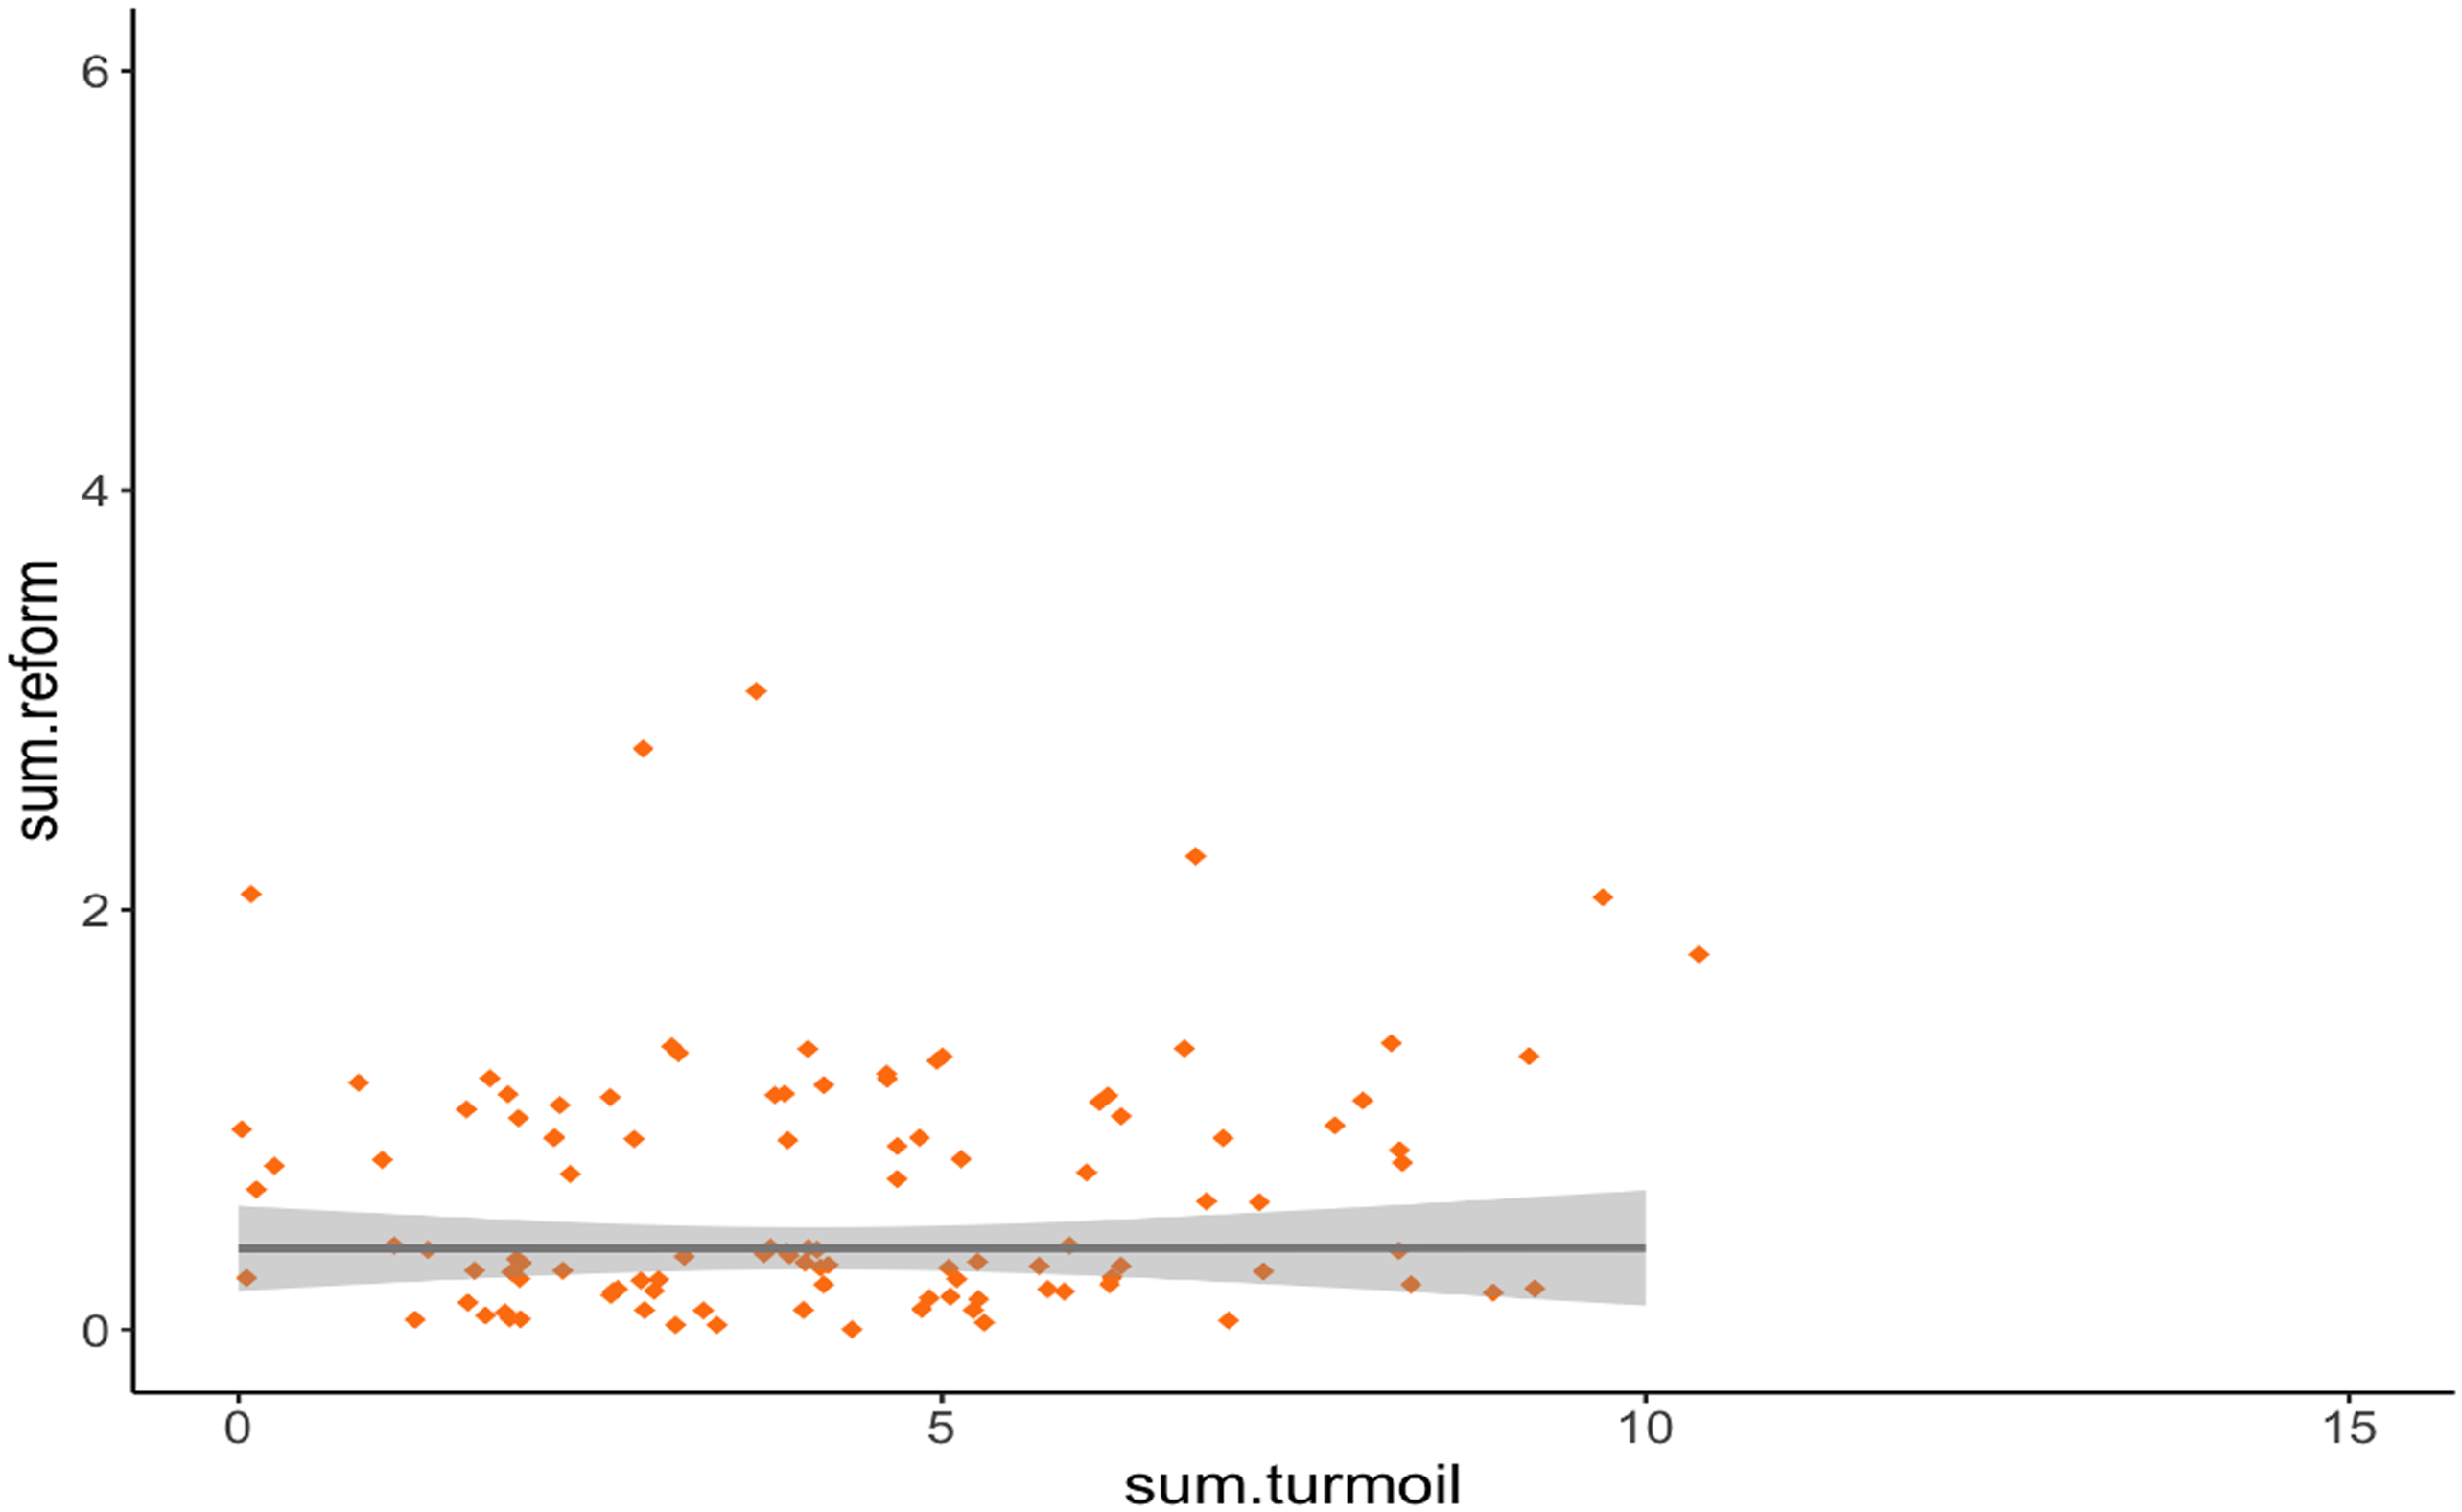
The most striking – and surprising – result of our analyses is that the crises in our sample exhibit very high variability across our outcome measures, both in terms of the overall severity and in the specific combinations of outcomes experienced. Figure 3 shows that the outcomes in our sample follow a fairly normal distribution, with moderately severe outcomes as the most common, while those with either mild or extreme severities are relatively infrequent. The prospects for experiencing major reforms, on the other hand, are quite left-tailed, with our sample showing that these events are rare, with only 31 percent of cases experiencing one or more reforms as a result of a crisis. Further, the distribution of crises experiencing some reform shows no obvious correlation with the severity of the crisis itself (Figure 4).
Count of different degrees of turmoil (left) and number of reforms (right) experienced in crisis cases.

Number of reforms by cases experiencing different levels of turmoil. Each case is a point (orange), separated by a small amount of “jitter” for readability, along with a linear trend line (gray) and standard error (shading).

The specific consequences experienced by different crises are themselves highly variable; Figure 5 shows the percentage of cases in which a particular consequence was experienced. This is perhaps to be expected from our sampling strategy, which deliberately sought to include cases with different experiences, and so has naturally resulted in high variability. Nevertheless, it is a significant contribution to document empirically the diverse pathways taken by different societies involved in periods of high risk. To understand this variability further, we next explored the combinations of specific consequences and outcome characteristics that the cases comprise.
Percentage of crises experiencing a specific consequence.

We focused first on the subset of cases that experienced relatively severe outcomes; namely, those with a sum.turmoil score over 4, the median score across our sample. Interestingly, we find that state outcomes (sum.state) are the only characteristic present in every one of the high-severity cases, capturing impacts on the territorial integrity and cohesion within the polity itself (major uprisings, civil warfare, territorial fragmentation, and similar). All other characteristics feature in some but not all (nor even a majority) of the more severe cases. This finding may reflect the important role that state structures play in maintaining societal functions; in other words, when the state starts experiencing significant turmoil, it is likely that several other facets will also be under high strain – and thus prone to realize disruptive outcomes as well – which results in higher overall severity scores. Conversely, even particularly severe disruptions, which are felt by just the elites or only by the general population, are less likely to “spiral” into other areas (which would result in a higher overall sum.turmoil score) unless state institutions and functions are also implicated. It is worth noting that, even with state outcomes being present in all of the high-severity cases, only one case in our entire sample – the end of the Romanov Dynasty period in the Russian Empire – experienced all six of the variables that make up the state characteristic. Of course, this characteristic comprises the largest number of consequences, so the chances that one of the state outcome measures will be present are simply greater than for the other characteristics made up of fewer variables.
To summarize, we find that different combinations of variables, including the state outcome ones, make up the higher sum.turmoil scores in our cases with greater severity, reinforcing the general impression of diversity across our dataset. We detail these patterns further in the Supplementary material. This is also supported by results looking at the relationship between these characteristics, which we discuss next.
Relationship between outcome characteristics
As noted above, we find no strong relationship among the various consequence characteristics. This was fairly unexpected, as we had anticipated the crises cases to “cluster,” at least in terms of the severity characteristics, where less-severe crises would experience fewer of the outcomes, while more-severe crises would experience many of the outcomes across each category. Yet this is not what we found in our analysis. What is especially significant is that there is also no strong correlation between reforms and any of the severity measures. We illustrate this by showing the cross-correlations between each category in the Supplementary material (Figure S12). This may suggest that reforms are entirely decoupled from the amount or type of turmoil experienced, or it may reflect that such significant institutional shifts have historically been so rare that they present no strong signal.
We also explored these relationships quantitatively through principal component analysis. Figure 6a highlights that the first principal dimension explains only 46 percent of the variance in the sample, and it requires five additional dimensions to explain the remaining half of the variance in our dataset. More significantly, each dimension is driven almost entirely by only one or two of the six outcome characteristics; Figure 6b (and Table S1) illustrates this, showing that the first dimension is primarily tracking sum.state with a small contribution from other factors, while the second dimension consists mainly of sum.popular with a minor contribution from sum.elites. Other dimensions, which individually explain only a relatively small amount of the overall variance in outcomes seen in our sample, are likewise each centered mainly on one other characteristic (sum.rulers, sum.elites, etc.).
a–b. Results of principal-component analysis on various outcome measures. a) Plot of the percent of variance each principal component accounts for; b) correlation plot between the 1st and 2nd principal components, showing factor loadings.

The very low correspondence among these characteristics overall, along with the separation of the different characteristics in the principal component analysis, demonstrates that relatively few cases in our sample experienced a large number of different outcomes at once (as shown in Figure 3). Thus, while it indicates that many crises share several features, they cannot be clearly distinguished by any predominant type of outcome or a particular combination of experiences. In other words – and perhaps quite surprisingly – there does not appear to have been anything like a “characteristic crisis” in the past.
We further honed in on these results by analyzing cases that included major revolutions. This was to see if revolutionary situations in the past had a higher-than-average chance either of experiencing relatively severe outcomes or of realizing significant institutional reforms; as indeed many aimed to accomplish (Goldstone et al. Reference Goldstone, Grinin and Korotayev2022). Interestingly, the severity of outcomes and the constellation of characteristics experienced – whether the revolution was “successful” in its aims or not – follow a similar pattern to that of the whole dataset (see Supplementary material, Figures S7 and S8 for these results). The chance of experiencing revolution followed by at least one reform, however, does deviate from the overall pattern. Here, we found that reforms are significantly more likely in cases featuring a revolution compared to those without. A caveat to this finding, though, is that there are also a number of revolutionary cases that did not experience any of these reforms. However, it is important to stress that our sample contains only a relatively small number of cases involving a revolution (34 of 168). This is nonetheless a surprising result, especially as much existing scholarship treats major, armed, popular revolutions as particularly violent and destabilizing events for polities (Goldstone Reference Goldstone1991; Goldstone et al. Reference Goldstone, Grinin and Korotayev2022). We thus expected that revolutions would be significantly correlated both with more severe outcomes and associated with more reforms due to the social dislocations caused by such uprisings. This interesting finding deserves more careful exploration, as we highlight in our future work section of the Discussion.
Spatial and temporal patterns in crisis outcomes
We next explored several potential patterns identified by scholars who have written about crises and periods of social violence and instability (as described in the Literature Review section). First, we looked at the idea expressed by several scholars (e.g., Pinker Reference Pinker2012) that the severity of crises or violence experienced in these periods has changed significantly over time (Figure 7a). We fail to find evidence supporting this idea, as others have also noted (cf. Braumoeller Reference Braumoeller2019; Lewis and Lewis Reference Lewis and Lewis2018), and in fact, we see an uptick in severity over time (although, as noted above, outcomes exhibit high variability at all time periods in our sample). Another important caveat in these results is that our sum.turmoil score measures how many different destabilizing outcomes were experienced, not how catastrophic or violent any one event was, which – by some interpretations – is what Pinker and others are really focused on. So, we also explored this another way by looking only at signs of state breakdown (fragmentation), as well as significant population loss (collapse) (see Supplementary material for details on these variables) – measures that are more directly in line with the idea that events that lead to spikes in death rates or societal collapse or disintegration are actually what has been declining. Figures 8b and 8c show these results, indicating no significant increase over time – unlike with our overall measure of severity – although they do not show a clear decrease either. In all, these results do not support the idea that crises have become less severe over time, or that the chances of major catastrophic outcomes to states (namely, loss of territorial integrity) or populations (major loss of life) have decreased or changed significantly over time. It is notable, though, that reforms do become clearly more likely over time (Figure 7d), which is perhaps the result of increased social capacity, particularly among state agents and administrators able to enact and (re)enforce such reforms, a point we return to in the Discussion.
a–d. Correlation plots showing a) sum.turmoil (brown) by start year of crisis; b) territorial fragmentation (orange) by start year of crisis; c) population collapse (orange) by start year of crisis; and d) sum.reform (blue) by start year of crisis. All figures include a LOESS (locally estimated scatterplot smoothing) trend line (gray) and standard error (shading); points have been jittered for legibility.

Figure 7 Long description
Four scatter plots show correlations between different crisis indicators and the start year of crises. Panel A: A scatter plot displays sum.turmoil on the vertical axis and start year of crisis on the horizontal axis. The data points are brown, and a LOESS trend line with standard error shading is included. Panel B: A scatter plot shows territorial fragmentation on the vertical axis and start year of crisis on the horizontal axis. The data points are orange, with a LOESS trend line and standard error shading. Panel C: A scatter plot depicts population collapse on the vertical axis and start year of crisis on the horizontal axis. The data points are orange, with a LOESS trend line and standard error shading. Panel D: A scatter plot illustrates sum.reform on the vertical axis and start year of crisis on the horizontal axis. The data points are blue, with a LOESS trend line and standard error shading. All plots have jittered points for legibility.
a–b. Correlation plot showing: a) sum.turmoil (orange) and b) sum.reform (blue) by how much of the polity’s duration had elapsed at the crisis onset. Both figures include a LOESS trend line (gray) and standard error (shading); points have been jittered for legibility.

We also explored possible temporal effects in another way, with our PolElapsed measure. This captures how long into the total duration of the polity the onset of the crisis occurred, expressed as the percentage of the polity’s overall “lifespan” that had elapsed when the crisis began. We noted above some of the difficulties with constructing this measure, but it is worth exploring whether the crises that arose later in the lifespan of our polities tended to be more severe than those that broke out earlier on. When we compare our sum.turmoil measure with PolElapsed, we find a clear though fairly weak relationship, where crises arising in the second half of a polity’s lifespan are, on average, more severe than earlier ones – though still with a wide distribution (Figure 8; explored further in the Supplementary material, Figure S10). Note, however, that we find no relationship at all between PolElapsed and sum.reform.
These results are especially significant as our sample includes many crises that coincided with – or were a direct cause of – a polity’s collapse. Yet in terms of severity, these instances are not much different from crises experienced earlier in a polity’s lifespan and so not part of a collapse event. Indeed, over two-thirds of the crises in our sample occur before the polities are 90 percent through their lifetime, and – as seen in all of our analyses – many of these had high sum.turmoil scores. This clearly indicates that varying types of societies frequently face, and survive, even severe and multifaceted crises.
It is interesting to note that these findings mirror work by Scheffer et al. (Reference Scheffer, van Nes, Kemp, Kohler, Lenton and Xu2023) – exploring the same data on polity duration as was used to construct our PolElapsed measure – who found that there was markedly increased risk of societal “death” over time, particularly after the 200-year mark. We acknowledge that some may consider it strange, and perhaps unfounded, to anthropomorphize polities in this way, making analogies with biological ageing and death. But the notion of "societal death" essentially asks if societies might wear out as they “age,” in a manner akin to biological entities, and so require no major driving force to propel a significant crisis; they simply – and naturally – “die of old age.” It might also be that pressures tend to build up over time in any given society, which makes it difficult (if not impossible) for any given polity to persist indefinitely without experiencing either a major transition or a total collapse. Our findings are broadly consistent with this theory, and, interestingly, the average duration of polities in our crisis sample is 201 years (with a median of 173 years). But the additional information about crises that we present here suggests that it is not necessarily very severe crises that precipitate polity collapse, even when they are advanced in years, an issue that is unaddressed in this earlier work. In other words, the “polity death” – transition from one polity or regime to another – that Scheffer et al. identify need not coincide with a particularly severe, destabilizing event or series of events. Our results indicate that even when a polity advanced in years and near a transition point experiences a crisis, it is not any more likely to be severe than one experienced earlier in the polity’s lifespan (and so ultimately survived). This may actually bolster the argument that there is something like societal ageing, as the impact of crises, whether they are highly severe or relatively mild, ostensibly carries a greater destabilizing force later in a polity’s lifespan than earlier. Still, this is a speculative interpretation that requires further analysis in future studies.
Finally, we explored the potential impact of geography on crisis outcomes (Lemke Reference Lemke2002), but we found little support for the idea that societies from any particular regions have tended to experience more or less severe crises, with the majority of regions fairly close to the overall average across our sample (Figure 9a). Reforms, however, do show a skewed geographical pattern, as crises involving European polities have a clearly higher chance of experiencing a major reform on average than other regions, with South Asian polities also above the overall mean (though with very high variance, as the error bars indicate).
a–b. Histograms showing a) the mean sum.turmoil (brown) score in different world regions, along with error bars (vertical blue bars) and overall mean across the whole sample (horizontal blue line); and b) the mean sum.reform (blue) score in different world regions, along with error bars (vertical brown bars) and overall mean across the whole sample (horizontal brown line). World Regions were calculated as the location of the capital city for each of the polities in our crisis sample.

The one exception to the pattern with severity is that, generally, prior to 1500 CE, crises in the Western Hemisphere appear to have been slightly less severe than those in Afro-Eurasia (Figure S11). This may be related to the influence of large, imperial, European polities, whose extractive policies and harsh treatment of Indigenous populations in the Afro-Eurasian region during this later period likely contributed to the increase in turmoil witnessed there compared to earlier periods (Covey Reference Covey2020). In addition, the burden of novel diseases introduced by European colonizers into North and South America may also have contributed to the increase in popular immiseration and unrest in those regions, though note that our sample includes crises before European contact involving epidemics (e.g., the seventh century Wari crisis and Maya collapse), as well as crises after contact in which epidemics were seemingly not involved. Another possibility is that differences in the level of scale and social complexity witnessed by polities from these different areas and periods may explain these results. We return to this below.
Exploring the potential correlates’ relationship with crisis outcomes
Lastly, we utilized regression analysis to test the impact of our various potential correlate measures identified in previous literature against our outcome measures. Specifically, we explored the relationship between our two primary outcome measures – sum.turmoil and sum.reform – against time (measured both as absolute time, namely, calendar year when our crisis period begins, as well as our PolElapsed measure), religious affiliation, region where the target polity was based (Northern Europe, East Asia, etc.) to assess geographic differences, and a measure of the polity’s social complexity including: measures of scale (the polity’s territorial extent and population); governance and administrative complexity; informational and economic sophistication; and degree of infrastructure and public goods development. Results of these tests are presented in Table S2 in Supplementary material.
The level of social complexity of the polity experiencing a crisis exhibits the strongest (and most positive) relationship with our severity measure, particularly the Scale factor (which essentially combines the polity’s territorial extent and population). This lends some support to the idea that larger and more complex societies are subject to increased risk of severe crises and collapse, perhaps due to overshoot or overextension of resources as suggested by scholars in the past (notably Tainter Reference Tainter1988). Although this association is stronger than the other potential correlates we explored, the relationship is not in itself particularly solid, yet it does reach statistical significance. Overall though, the relationships between crisis turmoil and these different social complexity characteristics do not explain very much of the variance in our data (see Supplementary material for details). World religion also displays a minor effect, as crises involving polities that practiced one of the world’s religions as the majority faith do show slightly lower outcomes in terms of the sum.turmoil score – though again, the overall effect is fairly minimal.
Interestingly for reforms, Scale as well as administrative complexity (Gov) show the strongest relationships for changes in reform, but have a negative estimate in regression analysis (see Table S3 in Supplementary material); namely, higher sum.reform scores are associated with lower values of Scale and Gov, rather than higher values. The factor with the strongest positive relationship with reforms is hierarchical complexity (Hier) – namely, the number of levels in administrative, military, and religious chains of command as well as scales of settlements. This is notable and may reflect the need for some central authority to effectively implement major structural changes within a society; in other words, polities with better-established alternate chains of authority might be in a better position than others to not only check the power of incumbent rulers who may be resistant to reform, but also have the influence to initiate and then implement major reforms during periods of unrest (e.g., Blanton and Fargher Reference Blanton and Fargher2008, Reference Blanton and Fargher2016). Alternatively, a sophisticated and professional bureaucracy could strengthen the path-dependency among prevailing social systems and institutions, particularly without long chains of administrative command coming between central authorities and “on the ground” officials – and thus the difference with hierarchical complexity – preventing significant transformation in favor of the status quo, even during periods of significant turmoil. This may explain the negative associations with Scale and Gov. It is important to note, though, that the measures of Scale, Hier, and Gov are themselves quite highly correlated, as we have shown in previous research (Turchin et al. Reference Turchin, Currie and Whitehouse2018a), creating tensions between these contrasting forces that work either to increase or suppress the chances of reform during crises.
Discussion
The unique profile of past crises
In this article, we sought to explore broad, macro-level patterns in societal experiences of crisis across a wide range of time periods, locations, and socio-cultural contexts. We were motivated by previous scholarship where a host of different patterns and key drivers of severe outcomes had been identified, though without much agreement between approaches and conclusions. To help resolve these questions, we cataloged crises that range from major events such as long-lived civil wars and complete societal collapse to more mild resolutions, for instance, localized turmoil among ruling elites or cases of significant reform (including shifts in institutional functions or constitutional amendment such as changing from a monarchic to republican style of governance). Overall, we find the dominant pattern displayed by our sample is one of diversity and uncertainty of outcomes.
These results across our diverse catalog indicate that the dynamics of crises are driven in large part by factors particular to the surrounding contexts and individual societies that experience them; more so than the fairly broad forces highlighted by much previous scholarship and explored in this article. In other words, it seems that the true causes of the different outcomes experienced in crisis situations exist at a level of resolution lower than the macro-level that we have explored here. This underscores the idea that there is no typical or characteristic crisis, but that crisis itself is an abstract idea which conflates many different types of pressures, responses, and outcomes, both adverse and adaptive to different segments of a society.
No examination of a crisis alone, or even a set of crises, can fully explain the outcomes societies experience, whether that is reform, civil violence and unrest, or collapse; the complex interactions between long-building social pressures, the nature and magnitude of the crises faced, as well as the specific responses taken by leaders and other power holders as the crises unfold, must always be accounted for. This is an important finding and may support more traditional thinking, particularly among historians (Boldizzoni Reference Boldizzoni2011; Körösényi et al. Reference Körösényi, Illés and Metz2016; McAnany and Yoffee Reference McAnany and Yoffee2009; Yoffee Reference Yoffee2019) who have argued that each crisis has its own unique context and course that it will take from highly localized, contingent factors – the peculiar social, economic, political, and environmental systems operating in each society – and decisions of the individuals and institutions involved (Bondarenko Reference Bondarenko, Dmitri, Stephen and David2020). To paraphrase Tolstoy, each crisis is unhappy in its own way (Tolstoy Reference Tolstoy1886).
That said, the only way to expose the patterns, or identify the lack of consistency across different contexts, is through careful, systematic study of a large number of diverse crisis cases; this is, indeed, the heart of the CrisisDB program. And our analysis did reveal some common trends. Notably, Scale does show a significant relationship with the severity of crises experienced across our cases, while time also displays an impact in two different ways. Reforms, conversely, seem impacted mainly by hierarchical complexity, perhaps reflecting the need for well-established administrative institutions to implement, and then continue to support, major structural changes (Blanton et al. Reference Blanton, Feinman, Kowalewski and Fargher2020). All of this, however, must be taken with some caution, as even the best-fitting models do not actually explain much of the variation we see in our sample of cases. The most salient observation from this initial data gathering, then, is that the outcomes experienced from periods of societal pressure are highly variable. However, there is still much data to gather and many analyses to be undertaken, which we discuss in the Future Work section below.
Micro- and macro-level factors that may shape crisis outcomes
Although we were unable to delve into a detailed exploration in this study, we argue that there are two major factors that shape the course of societal crises, which, so far, have had little scholarly attention from a longue durée perspective. The first, on a macro scale, are environmental forces such as climate changes and natural disasters, which greatly impact how societies can cope with crises - or indeed how those environmental changes can trigger them in the first place – dependent on the scale and intensity of the exogenous shocks (Degroot et al. Reference Degroot, Anchukaitis, Tierney, Riede, Manica, Moesswilde and Gauthier2022; Hoyer et al. Reference Hoyer, Bennett, Reddish, Holder, Howard, Benam, Levine, Ludlow, Feinman and Turchin2023). From a micro perspective, the behaviors and actions of elite actors (in particular) undoubtedly impact the way that periods of crisis unfold and affect a society. Prior work by ourselves and colleagues has highlighted the critical role of the decisions and responses taken by key power-holders as social unrest begins to bubble up and the beginnings of a true crisis situation take root (Bondarenko Reference Bondarenko, Dmitri, Stephen and David2020; Goldstone Reference Goldstone2003; Goldstone et al. Reference Goldstone, Grinin and Korotayev2022; Korotayev et al. Reference Korotayev, Issaev, Malkov and Shishkina2014; Orlandi et al. Reference Orlandi, Hoyer, Zhao, Bennett, Benam, Kohn and Turchin2023; Turchin Reference Turchin2023). These elites, along with the various incentives and structural pressures they face (Chapman and Cunningham Reference Chapman, Cunningham and Sinnott-Armstrong2014; Houle et al. Reference Houle, Ruck, Bentley and Gavrilets2022), may play a major role in either ameliorating or intensifying the ensuing tension, and so determining whether a crisis leads to merely a minor disruption or spirals into severe turmoil. The role of power-holders during periods of ostensible prosperity, before a crisis is seen to take root, is also likely to play a major role in the timing and intensity of crises (Hoyer et al. Reference Hoyer, Bennett, Whitehouse, Francois, Reddish, Davis, Feeney, Levine, Holder and Turchin2024). In other words, supporting adaptive, resilience-boosting policies during stable times of affluence, when social and institutional capacities may be higher, could help to keep at bay (at least for longer periods) the pressures that lead to those crises that may result in more severe outcomes.
Here, we look at some historical case studies which illustrate how these different factors interact to inform the trajectory of a crisis and its aftermath, beginning with a comparison of state responses to the Black Death plague epidemic (present in Eurasia c.1346–1353). During this period, Mamluk Egypt and England were largely comparable in terms of infrastructure, population, and agricultural commerce, as well as overall complexity. The Black Death killed almost one-third of Mamluk Egypt’s population and was followed by excessive and destructive flooding of the river Nile, famine, grain shortages, and violent conflict, collectively known as the “great crisis” (this case is in the CrisisDB and receives a sum.turmoil score of 7). During these decades, the Mamluk ruling class entirely mismanaged the disasters that befell the population, giving little or no support to the populace, and instead carried out extravagant and expensive construction projects (Chalyan-Daffner Reference Chalyan-Daffner2014; Dols Reference Dols1977; Hrbek Reference Hrbek and Oliver1977; Raymond Reference Raymond2000). Comparatively, in England, despite the Black Death striking during the Hundred Years’ Wars with France (severity score of 8), the economic decisions that the ruling powers faced and were forced to make – though detrimental to the elites – eventually resulted in England enjoying one of the most positive post-plague economic transformations in Eurasia (Borsch Reference Borsch2005; Benedictow Reference Benedictow2021). An important study comparing the effects of the Black Death in Egypt and England (Borsch Reference Borsch2005) highlights that the economic responses by Egyptian authorities led to an increase in unemployment, a rise in grain prices, and higher land rents, but a drop in wages and agricultural output. In England – which was as severely plague-stricken as Egypt – the exact opposite happened. Landowners were forced to reduce rents and pay higher wages in order to keep peasants working their land as the population declined. As a result, the decline in agricultural output was relative to the degree of depopulation and, economically, it was the (fewer) elites that suffered a drop in income, not the majority of the populace, as in Egypt. In fact, studies show that the century following the Black Death was marked by a rise in living standards for England’s peasant population (Borsch Reference Borsch2005; Mayhew Reference Mayhew1995).
This example illustrates that similar pressures can lead to different socio-economic trajectories and outcomes for these countries due to, firstly, the nature of the shocks faced (for example, how intense and recurrent bouts of plague and famine were), and secondly, the decisions made by (or the options available for) rulers in response. This goes some way to putting our results into perspective. It can also help explain why we do see that social complexity and polity age have some effects on the severity of crisis outcomes; larger, more complex, and long-lived societies are simply more likely to be more exposed to crises over the duration of their lifespan, and will have many intertwined systems vulnerable to dysfunction, and so propel the unrest that can result in the various detrimental outcomes. At the same time, these macro-scale forces do not tell the whole story as it seems that the responses made “on the ground” when crises hit seem to be just as important in determining the overall trajectory of a crisis. This response factor may be especially true for a society’s elite, who hold the most sway in making state decisions that are either effective at mitigating negative consequences, and may even prove adaptive in the long-term, or work to exacerbate turmoil and undermine resilience in the future. Thus, a key factor in how individual societies are ultimately affected by crises is the resilience of the state and the measures that state has in place against the causes and effects of the crisis it faces. For instance, stockpiling food, maintaining widespread infrastructure, or having low levels of internal conflict can greatly reduce the negative impacts that a crisis may inflict on a community, allowing it to resist and recover from the period of upheaval in ways that less prepared societies may not be capable of doing. However, even a successful society with a high level of resilience can suffer failure or collapse for myriad reasons, such as an unsustainable boom in population growth that stretches resources beyond survival requirements, or a massive and sudden decline in population that undermines social capacity, for example, due to natural disasters such as ongoing droughts or flooding that cause food scarcity and generate widespread unrest. Moreover, crises may develop in rapid succession, leaving the state unable to respond effectively to the chain of issues (Mark et al. Reference Mark, Holder, Hoyer, Schoonover and Aldrich2025), or those crises may simply be so big a challenge that even a resilient and well-prepared society cannot overcome them (Holling and Gunderson Reference Holling and Gunderson2002; Sandberg Reference Sandberg, Miguel, Peter, Paul and Thayer2023).
For instance, recent work by Scheffer et al. (Reference Scheffer, van Nes, Bird, Bocinsky and Kohler2021) has demonstrated that the mass settlement abandonment during the thirteenth century of many Pueblo communities (located across the lands of what are now parts of New Mexico, Arizona, and Texas in the southwestern USA) was precipitated by ongoing and major environmental devastation, largely in the form of severe droughts, which has long been generally accepted as the reason for abandonment. Furthermore, it was found that social resilience had been eroding for decades prior to the onset of drought conditions due to a population boom (which can be seen as a positive but puts strain on resources) as well as exploitative social and economic practices concerning the poorer members of the community. These wider social stresses made these Pueblo communities unable to withstand, or adapt to, the ecological shocks and outcomes of drought (Scheffer et al. Reference Scheffer, van Nes, Bird, Bocinsky and Kohler2021). The “crisis,” then, was not merely the outcome of the mass de-settlement of the region, but the longer preceding period of coupled environmental and socioeconomic stresses that were being dealt with simultaneously and unsuccessfully by the state. Admittedly, this is a somewhat controversial interpretation, as other scholars view the de-settlement of traditional communities in the region as either directly forced by ecological crises alone, or driven more by inter-group conflict than environmental pressures, or simply the result of gradual long-term settlement shifts (Crown and Wills Reference Crown and Wills2018; LeBlanc Reference LeBlanc1999; Short Reference Short2022; Wills et al. Reference Wills, Drake and Dorshow2014). Nevertheless, the debate shows, at minimum, the need to explore multiple and concurrent factors in any analysis in order to separate the true drivers of crisis and disaster from specious correlations, and to expose the possible relationships that exist between seemingly distinct factors.
Polity lifespans and path dependencies
As discussed in the Results section, the theory that crises which strike later in a polity’s “lifespan” are more likely to result in severe outcomes and lead to collapse is not fully supported by our analysis. While there is some signal suggesting that crises are more severe when they arise near the end of a polity phase, this is not a particularly strong result. This may reflect the strength of path dependence in how societies function, as systems develop mechanisms to preserve functions even as pressures mount (Sandberg Reference Sandberg, Miguel, Peter, Paul and Thayer2023). This idea does, interestingly, run counter to the expectations of various theorists, who argue that all societies experience waves of unrest or “disintegrative” phases as they advance past initial integrative phases (Turchin Reference Turchin2003; Turchin and Nefedov Reference Turchin and Nefedov2009), or as demands of increasing complexity reach saturation and face diminishing returns over time that weaken their ability to respond to crises that arise while they are already pushed to their functioning limits (Bardi et al. 2018; Scheffer et al. Reference Scheffer, van Nes, Kemp, Kohler, Lenton and Xu2023; Tainter Reference Tainter1988). Nevertheless, most of the societies in our sample did eventually experience some collapse or at least major transformation. However, it appears that the collapse of well-aged social structures is not always – or even most often – accompanied by any severe, crisis-like event.
Future work
The results of the analyses and discussion provided here offer important insights into – or at the very least offer further questions about – the nature of societal crises. Still, much remains for us to explore more fully to understand how and why these crisis dynamics take the shape they do. As part of our ongoing work with the CrisisDB, we are continuing to build our repository of data, focusing particularly on expanding our sample of crises into more recent periods (after 1850 CE). We also seek to gather more information on the social stresses and contexts that may determine the broad range of crisis outcomes revealed here, effectively allowing researchers to explore more meso- and micro-level dynamics that may shape crisis outcomes, as we hypothesized above.
Our team is additionally investigating the aftermath of historical and contemporary revolutions (Ainsworth and Hoyer Reference Ainsworth and Hoyer2025). As noted, often scholars assume that there are more disruptive and violent outcomes during crises when a revolution takes place and that these periods are likely to be accompanied by a major reform or transition in response (Beissinger Reference Beissinger2022; DeFronzo Reference DeFronzo2015; Goldstone Reference Goldstone2014; Goldstone et al. Reference Goldstone, Grinin and Korotayev2022). Curiously, this pattern is not seen consistently in our sample of crises. Further work is thus needed to unravel the factors that not only cause revolutions to arise, but which determine what the longer-term impacts of the revolutionary situation are, both on different sub-sections of the population and on the society as a whole.
In another project, we are developing a catalog of ruler transitions across a wide global and temporal sample to explore patterns in the social instability surrounding regime changes. These studies, which include data with a finer time resolution during a polity’s lifetime, will provide an opportunity for a detailed and niche analysis across our range of crisis cases.
In addition to collecting more data on different time-scales that consider a wider range of factors explored here – from environmental stresses to economic fluctuations both within and outside of societal boundaries – integrative work turning the insights derived from these historical investigations into formal, mathematical, causal models is crucial to expose the true drivers of crisis and the resulting disasters from the specious factors.
Finally, we would like to highlight that the approach taken for this article is just one way to engage with the dataset. There are many more paths that can be taken to use the important information that we have gathered and numerous ways to analyze and present the results that can be garnered from them. Indeed, our datasets are open access, and we eagerly encourage our colleagues to join us in expanding the CrisisDB and our other promising datasets, work with them in unique ways, and solicit other research groups to conduct their own analyses on CrisisDB data. We look forward to fruitful and interdisciplinary collaborations, diving into the questions revealed by the present analyses for years to come.
Supplementary material
For supplementary material accompanying this article, visit https://doi.org/10.1017/ssh.2025.1011
Data availability
All data needed to evaluate the conclusions in the article are present in the article and/or the Supplementary material. All data collected by the Seshat project in the form used in analyses here will be made available on the Seshat project website at https://seshat-db.com/downloads_page/. We also present regularly updated versions of our data in both browsable format through our Data Browser (https://seshat-db.com). Whereas the downloadable file contains data in a computer-readable form suitable for statistical analyses, the live Data Browser also includes narrative paragraphs explaining the codes as well as references. Lastly, we provide an API node (https://seshat-db.com/api/) for direct access to all of our project’s public data.