I. INTRODUCTION
The lanthanum nickelate (La2NiO4) system with strontium (Sr) doping of a fraction of the lanthanum (La) sites is of broad interest in oxide materials physics and chemistry. It has structural similarity to the superconductor lanthanum cuprate, La2CuO4, (LCO); exhibits giant dielectric constant, has a rich electronic phase diagram and is also being actively explored for fuel cell applications.Reference Tan, Heald, Cheong, Cooper and Moodenbaugh1–Reference Yamada, Suzuki, Saka, Uehara, Mori, Kanno, Kiguchi, Mauvy and Grenier4 The series, strontium-doped lanthanum nickelates, La2−xSrxNiO4 may possess high oxygen ionic mobility due to their potassium nickel fluoride (K2NiF4)-type structure and their tendency toward oxygen hyperstoichiometry with high mobility in interstitial lattice sites.Reference Vashook, Trofimenko, Ullmann and Makhnach5 A better understanding of the structural properties in epitaxial thin film form could therefore be of relevance.
The lattice mismatch between a thin film and substrate is an important parameter that greatly influences the film structure, morphology and its strain state. Competition between the thermal strain energy minimization and surface energy minimization leading to orientation transition has been observed in metallic thin films.Reference Thompson and Carel6,Reference Viswanath, Ko and Ramanathan7 The lattice mismatch strain is quite important in epitaxial oxide thin films. Typically, the first few layers of a thin film may accommodate the mismatch strain by deformation and maintain the atomic registry with the substrate leading to epitaxial growth with coherent interface for small mismatch. However, the homogeneous elastic energy stored within an epitaxial film due to the lattice misfit strain increases with film thickness. At a certain critical thickness, it is energetically favorable to relieve the misfit strain by formation of dislocations or other mechanisms at or near the substrate/film interface.Reference Freund and Nix8
La2NiO4 and related compounds, exhibit large anisotropy arising from the complex crystal structure of the Ruddlesden-Popper phase. Anisotropic oxygen diffusion at high temperatures has been predicted by molecular dynamic calculations showing the a, b plane to be most active.Reference Chroneos, Parfitt, Kilner and Grimes9 The oxide-ion conductivity in the LSNO crystal is inherently anisotropic due to the layered crystal structure. Parallel to the a, b planes of the structure, oxygen migration can occur via oxygen interstitials inside the lanthanum oxide (LaO) rocksalt layers and via oxygen vacancies in the NiO6 octahedra. Oxygen migration orthogonal to the layers may be subdivided in two linked processes: vacancy-assisted oxygen transport inside the perovskite layers along the c axis and that of interstitial oxygen ions across the rocksalt LaO layers.Reference Schroeder and Dragan10 It has also been seen that negative charge carriers (electrons) are present, mainly in the LaO layer.Reference Bassat, Gervais, Odier and Loup11 The deposition of pure c axis-oriented La2NiO4, the related La2CuO4 and LSNO on SrTiO3 has been reported in literature.Reference Burriel, Garcia, Santiso, Kilner, Chater and Skinner12–Reference Arrouy, Locquet, Williams, Machler, Berger, Gerber, Monroux, Grenier and Wattiaux14
In the present study, we report on the microstructure of LSNO on strontium titanate, SrTiO3 (STO) single crystals grown at high oxygen partial pressure as a function of thickness. We report on the observation of a critical thickness associated with epitaxial growth followed by crystallographic reorientation that likely is created by the hyperstoichiometry of oxygen in the lattice and driven by strain relaxation and surface energy minimization. The orientation change could be useful as a design parameter in synthesis of films with desired anisotropic characteristics. Further, the interplay between oxygen stoichiometry and the lattice being able to accommodate interstitials may influence such structural reorientation in similar ionic crystal structures.
II. EXPERIMENTAL SECTION
Epitaxial LSNO films of nominal composition La1.875Sr0.125NiO4 (space group 139, I 4/mmm) were deposited by radiofrequency (RF) magnetron sputtering from stoichiometric targets of 99.9% purity (ACI alloys). Composition was verified by the vendor organization ACI alloys through energy-dispersive x-ray spectroscopy. Deposition conditions were optimized at 10 mTorr pressure, 923 K substrate temperature and 50% O2 in Argon, without any postdeposition annealing. Samples were allowed to cool to room temperature in the deposition chamber. Single crystal substrates of (001) orientation cubic STO were chosen due to the similar lattice parameters (3.905 Å) to that of bulk LSNO. Film thickness was controlled by deposition time and varied from 25 to 150 nm in steps of 25 nm. Growth rate of the films was approximately 6.5 Å/min under these conditions. X-ray diffraction (XRD) was performed using a (022) germanium (Ge)-monochromated Cu Kα beam (Bruker D8 with pathfinder and lynx eye detector) and general area 2D detector (Bruker D8 with Vantec 2000 Detector, Germany). Stereographic projections of pole figures were simulated using commercially available software, WinWulff. Cross sectional transmission electron microscopy was performed using (TEM; JEOL 2010-FEG, Tokyo, Japan) microscope operated at 200 KV. TEM specimens were prepared by mechanical thinning followed by argon (Ar) ion milling.
III. RESULTS
A. XRD studies
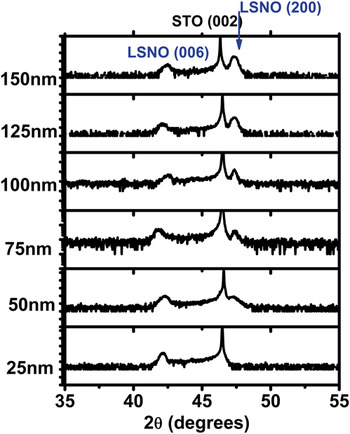
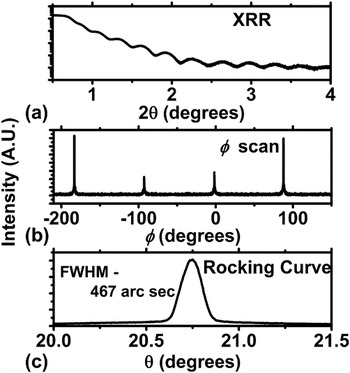
XRD experiments were carried out on all samples and showed features related solely to STO (substrate) and LSNO (film) over a wide 2θ range. Figure 1 shows the evolution of the diffraction pattern as a function of thickness plotted from 35 to 55°. The 25-nm film only showed the (001) peaks related to both the substrate and film. Figure 2 shows detailed diffraction data for a 25-nm thin film. Figure 2(a) shows the x-ray reflectivity data, calculating the oscillation spacing in the x-ray reflectivity data confirms the thickness. Epitaxial relationship [Fig. 2(b)] was verified by φ scan from symmetric (103) peak showing 4-fold tetragonal symmetry. Rocking curve data [Fig. 2(c)] for the LSNO (006) peak shows strong orientation with a full width half maximum (FWHM) of 467 arc sec thus confirming an epitaxial layer. Lattice parameter along the c axis was calculated from the (006) peak and determined to be ∼12.81 Å. Bulk LSNO lattice parameter was extrapolated to be 3.853 and 12.691 Å from Joint Committee on Power Diffraction Standards (JCPDS) data in the a direction and c direction, respectively.15 The lattice constant of cubic STO is 3.905 Å. Therefore one can expect that the LSNO films grown on STO (square-on-square) would be under tensile strain.
Diffraction pattern of LSNO on STO as a function of thickness showing the formation of the (200) phase. As film becomes thicker, (200) diffraction peak forms and grows greater in intensity whereas the intensity of the (006) diffraction peak remains fairly constant with respect to the STO (002) substrate peak.

(a) X-ray reflectivity data taken from 25-nm thick LSNO film on STO. (b) Phi scan of 25-nm thick (103) LSNO plane. (c) Rocking curve data from LSNO (006).

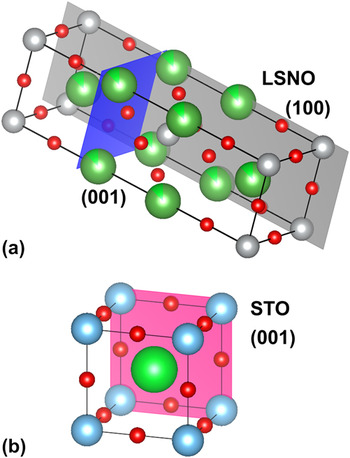
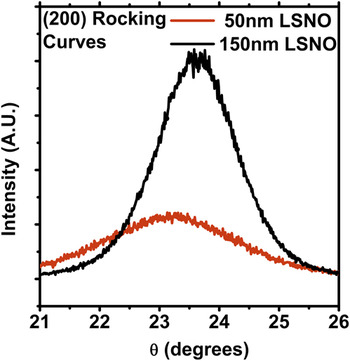
For samples thicker than 25 nm, in addition to the (00l) peak, a (200) peak begins to develop which becomes more intense as the thickness of the film is increased while still maintaining the (00l) peak (Fig. 1). This indicates that there exists a crystallographic reorientation to accommodate the stress induced by the epitaxial growth mode. The a plane lattice parameter for 150-nm film was measured to be 3.835 Å from the (200) peak which matches closely with that reported in literature.15 As will become clear later on in this work, this value is a relaxed lattice constant as it is obtained from the reoriented layer in the film. As we are performing symmetric 2θ-θ scans, diffraction planes must be parallel to the surface. Therefore, as the films become thicker, crystallographic reorientation is occurring from the (001) plane being parallel to the STO surface to the (100) plane being parallel to the surface. Schematically, the crystal structure of LSNO is given in Fig. 3(a) with (100) and (001) planes highlighted in gray and blue, respectively.Reference Momma and Izumi16 For reference, the structure of the STO crystal, a cubic pervoskite, is shown in Fig. 3(b). Rocking curve data for the (200) peak is plotted in Fig. 4 for 50 and 150 nm. As the thickness of the films increases, the rocking curve becomes much stronger indicating an increase in texturing as a function of growth. This likely arises from the minimization of surface free energy.Reference Thompson and Carel17 Instead of witnessing a stress relief due to interface dislocations, which is more common in thin film heteroepitaxy, we observe crystallographic reorientation of the film at certain thickness. These crystallographic reorientation phenomena have also been seen in other systems such as titanium nitride (TiN) and most recently in La2NiO4 and will be discussed further in a later section.Reference Oh, Je and Lee18–Reference Telesca, Wells and Sinkovic20 To confirm the orientation transition, TEM studies were carried out on the 100-nm thick LSNO film.
(a) Crystal structure of tetragonal LSNO (a = b = 3.853 Å, c = 12.691 Å). (100) and (001) planes are shown in gray and blue, respectively. (b) Crystal structure of cubic STO (a =3.905 Å). (100) plane is shown in pink.

Rocking curve data as a function of thickness for the (200) LSNO peak. Broadness of 50-nm LSNO indicates weak texturing. As the film becomes thicker, the full width half maximum decreases indicating a higher degree of orientation. Offset in peak position is due to alignment of substrate.

B. TEM studies
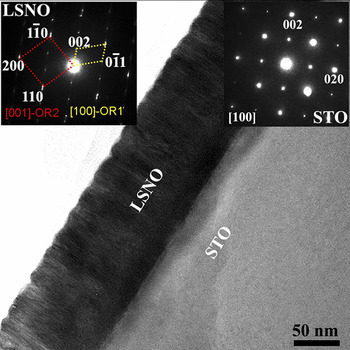
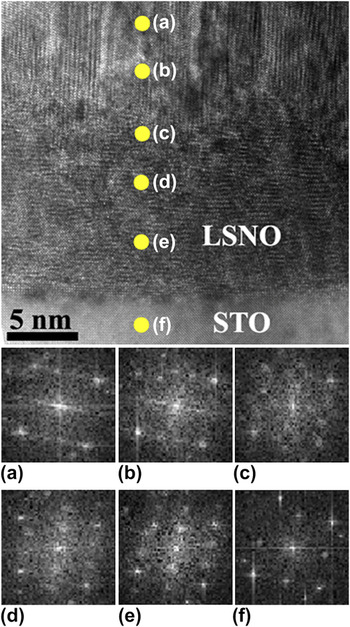
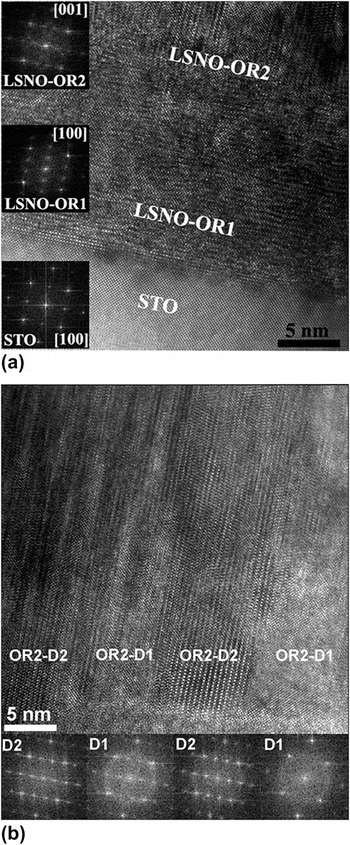
Figure 5 shows the TEM bright field images of the 100 nm thick LSNO film on STO substrate. The corresponding selected area electron diffraction (SAED) patterns obtained from LSNO film and STO substrate are shown as inset. LSNO thin film appears darker as compared with the STO substrate owing to mass/thickness contrast in combination with the diffraction contrast. No contrast is seen in LSNO film up to 15 nm thickness adjacent to the LSNO-STO interface, whereas columnar growth is evident at greater thicknesses, suggesting possible microstructural heterogeneity as the thickness increases (Fig. 5). Interestingly, the SAED pattern recorded exclusively from the LSNO film shows overlapping diffraction pattern from two different orientations; LSNO (001)//STO (001) – OR1 and LSNO (100)//STO (001) – OR2. This can be visualized using the crystal structure in Fig. 3. Lattice image of LSNO film on STO indicates the existence of critical thickness (∼15 nm) favoring two different orientations in LSNO film (Fig. 6). With XRD, we did not observe a secondary orientation in the 25-nm thick sample however, this could be due to the small diffraction volume or partially formed textured layer. The boundary line separating the two orientations is shown by an arrow. To confirm the orientation change, fast Fourier transform (FFT) patterns were obtained from the film edge to LSNO-STO interface region. It is evident from Figs. 6(a)–6(e), the orientation of LSNO film is changing across this thickness. FFT from the STO is shown in Fig. 6(f) for reference. High-resolution transmission electron microscopic (HRTEM) images recorded from the LSNO-STO interface and FFT analyses confirm the existence of critical layer thickness with two different orientations of LSNO film (Fig. 6). Below ∼15 nm, OR1-LSNO (001)//STO (001) is observed and OR2-LSNO (100)//STO (001) is observed above this thickness with columnar microstructure. The lattice image recorded in Fig. 7(a) from LSNO film shows densely oriented OR1 epitaxial layer and a transition to OR2 with columnar growth. Inset in Fig. 7(a) shows the FFT patterns of STO and LSNO with two different orientations consistent with the SAED pattern. Further FFT analyses carried out from many regions in the direction parallel to the substrate below the transition thickness (∼15 nm) showed same orientation of OR1 consistent with the epitaxial growth mode. To get more insights about OR2 and the columnar growth, HRTEM image was recorded above the transition thickness of the LSNO film. The columnar structure extends throughout the growth of OR2 in the high-resolution image shown in Fig. 7(b). FFT analysis done parallel to the substrate revealed at least two different growth directions above the transition thickness in the columnar microstructure region. The FFT images shown as inset in Fig. 7(b) illustrate the two possible surface-normal rotations of OR2 arranged alternatively in the columnar microstructure. The observed chevron-like microstructure and the FFT pattern analyses done in the lateral direction suggest the two preferred growth directions orthogonal to each other, OR2-D1 and OR2-D2. This columnar growth and the two possible growth directions in OR2 will be further discussed in Sec. III. C using pole figure results.
TEM-bright-field image shows the of LSNO film of 100 nm thickness on STO substrate. SAED pattern from LSNO film (left) and STO substrate (right) are shown as insets.

HRTEM image of LSNO on STO shows the orientation evolution of LSNO film grown on STO. Inset of FFT patterns (a–e) show the changes in the orientation of LSNO film across the thickness of ∼15 nm whereas (f) is from the substrate for reference.

(a) HRTEM image reveals the existence of critical thickness favoring LSNO <100>//STO<001>-OR1 and LSNO<001>//STO<001>-OR2 at low and high thicknesses, respectively. The corresponding FFT patterns obtained from different layers are shown as insets. (b) Lattice image recorded from LSNO film showing columnar microstructure of OR2 region. A chevron pattern consisting of two domains with different growth directions are evident from the lattice images and the corresponding FFT patterns shown as insets.

C. Pole figure analysis
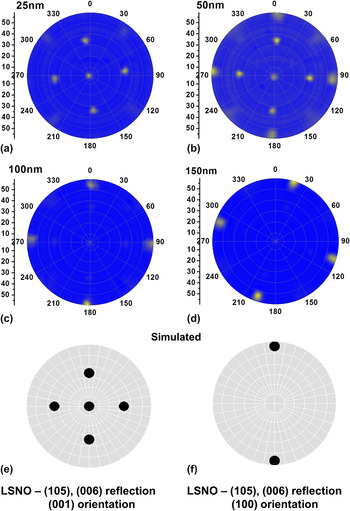
General area diffraction is used to understand the oriented growth as a function of thickness. Pole figures were measured by scanning the tilt angle of the film, ψ, in the range 0–60° and the azimuthal angle, φ, in the range 0–360°. Pole figure displays the stereographic projection of all reflections at a particular 2θ value. In the pole figure, the radial direction is given as ψ and the azimuthal direction is φ. Pole figures were constructed from the (006) and the (114) LSNO planes and shown in Figs. 8 and 9, respectively. From the LSNO crystal structure, the (105) plane has the same d-spacing as that of (006) leading to reflections corresponding to both sets of planes. Figure 8(a) shows the 25-nm sample that corresponds to the simulated pole figure in Fig. 8(e) which shows the (001) oriented simulation with the (006) reflection in the center of the stereographic projection and a 4-fold symmetry of the (105) reflection at ψ ∼ 33.6° [i.e., the interplanar angle of (001) and (105)]. At 50 nm [Fig. 8(b)], another set of reflections appears at a ψ of 56.5°, which corresponds to the orientation change mentioned above. The location of the reflections at ψ ∼ 56.5° correspond to (100) orientation. At thicknesses of 100 and 150 nm, only the reflections at ψ ∼ 56.5° are visible due to the intensity with respect to the (001) orientation. The simulation of the pole figure in Fig. 8(f) however only shows two reflections, whereas we clearly see 4-fold symmetry in the 100-nm [Fig. 8(c)] and 150-nm [Fig. 8(d)] samples. As observed in the TEM images in Fig. 7(b), columnar growth exists in the reoriented layer. The (100)OR1//(001)OR2 orientation is present however, from the pole figures, we see that the OR2 layer contains two distinct in-plane growth directions that are orthogonal to each other, which would account for the OR2-D1 and OR2-D2 seen earlier from TEM imaging.
Pole figure for the (105), (006) reflection of thin film LSNO at (a) 25 nm, (b) 50 nm, (c) 100 nm and (d) 150 nm. Simulated pole figure for the (105), (006) reflection with (e) (001) orientation and (f) (100) orientation. Two sets of reflections rotated 90° from each other are observed in the 100 nm and 150 nm samples (which differ from the simulated (100) pattern) that arises from columnar growth of OR2-D1 and OR2 – D2. The multiple reflections in the 50 nm sample arise from the transition between OR1 and OR2. OR1 orientations are not observed in the (c) 100 nm and (d) 150 nm figures, as the intensity scale is linear for understanding of the pole figure.

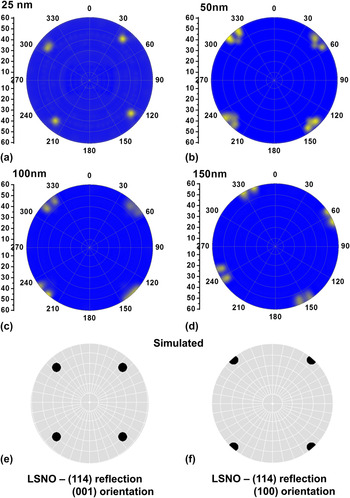
Pole figure for the (114) reflection of thin film LSNO at (a) 25 nm, (b) 50 nm, (c) 100 nm and (d) 150 nm. Simulated pole figure for the (114) reflection with (e) (001) orientation and (f) (100) orientation. In the (c) 100 nm and the (d) 150 nm, two sets of reflections are seen which arises from the OR2-D1 and OR2-D2 orientations. The multiple reflections seen in the (b) 50-nm sample arise from the transition between OR1 (001) and OR2 (100). OR1 orientations are not observed in the (c) 100 nm and (d) 150 nm figures, as the intensity scale is linear.

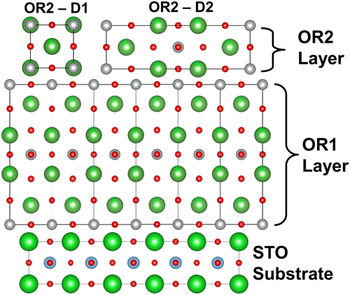
The reflections of the (114) plane further confirm the analysis seen above. The 25-nm sample [Fig. 9(a)] shows reflections at ψ ∼ 49.5° associated with the (001) oriented growth, which is also simulated in Fig. 9(e). At 50 nm, a second set of reflections begins to appear at ψ ∼ 57.5°. The ψ angle indicates that the film is (100) oriented. Films of thickness 100 and 150 nm [Figs. 9(c) and 9(d), respectively] show eight distinct reflections at ψ ∼ 57.5° and Fig. 9(f) shows the simulated pattern showing four reflections. This again would correspond to the two distinct orientations in the plane of the film. The fact that both Figs. 8 and 9 show sharp distinct reflections indicates that the films are highly textured, even after the occurrence of reorientation. In both pole figures, the in-plane orientation direction is orthogonal to each other leading to a distinct 90° rotation in the pole figure. OR1 is grown on STO as (001)OR1//(001)STO and <001>OR1//<001>STO as indicated from the diffraction data. From the pole figures, OR2 on OR1 is grown (100)OR2//(001)OR1 and with both <001>OR2//<001>OR1 (OR2-D1) and <100>OR2//<001>OR1 (OR2-D2) direction relations present. These accounts for the patterns seen in both pole figures and confirm the distinct columnar growth seen in the cross sectional TEM image of OR2 [Fig. 7(b)] incorporating two domains. It should be noted that in both sets of pole figures, data is plotted on a linear scale, which prevents the observation of the OR1 layer in the thicker films. OR1 orientation is still present however the intensity of the OR2 layer is greater and allows for easier interpretation of data. A schematic drawing of the cross section of the layer growth of the LSNO film on STO is given in Fig. 10. The upper layer in Fig. 10, OR2, shows two different orientations OR2-D1 and OR2-D2 of the film, which would account for the columnar growth. The reader will notice that the FFT of OR1 and OR2-D2 will give the same pattern. This is expected as OR1 and OR2-D2 are the same lattice plane cross sections however rotated 90° from each other.
Cross sectional atomistic view of OR1 and OR2 grown on the STO substrate. Two different orientations in the OR2 layer are of OR2-D1 and OR2-D2 and responsible for the two sets of reflections rotated 90° from each other observed in the pole figures of the thicker films.

D. Substrate dependence
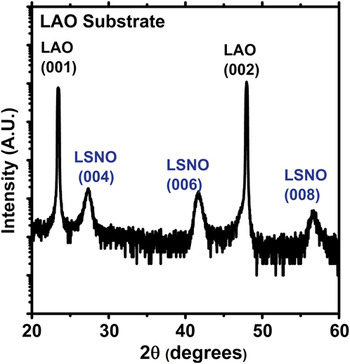
Using the exact growth conditions previously described, LSNO was also grown on lanthanum aluminate, LaAlO3 (also referred to as LAO) substrate at a thickness of ∼100 nm. The diffraction pattern over a broad 2θ range (20–60°) is shown in Fig. 11. LAO substrate is cubic with a lattice parameter of 3.79 Å. Growing LSNO on LAO will place the film under compressive strain (unlike the tensile strain for growth on SrTiO3). The c lattice parameter was calculated to be 13.01 Å. A larger value for c lattice constant is expected from the Poisson contraction of the a, b plane under tensile strain. By observing the diffraction pattern, the film is seen to be c plane oriented with no reorientation present. This indicates the role of tensile strain in the reorientation phenomena. However, we duly note that strain alone is not the only driving force responsible for reorientation as it has previously been shown that LSNO can grow c plane oriented on other tensile strained substrates and as will be discussed in more detailin Sec. III. E.Reference Podpirka, Tselev and Ramanathan21,Reference Xie, Budnick, Hines, Wells, He and Moodenbaugh22
LSNO deposited under same conditions on LAO substrates showing pure c plane orientation.

E. Deposition parameter dependence
To determine the effect of deposition conditions on the reorientation, parameters were systematically varied. In this parameter grouping—power, pressure and temperature during growth were varied to determine its role in the reorientation. The resulting diffraction patterns are shown in Fig. 12. The typical deposition parameters were 973 K, 10 mTorr, 50% O2 in Ar and 150 W power on STO substrates whereas films were grown for different durations to maintain the ∼100 nm thickness in all cases. For the sample in Fig. 12(a), the power was set to 100 W, the sample in Fig. 12(b) had both power and pressure set to 100 W and 4 mTorr, respectively, the sample in Fig. 12(c) had the power set to 100 W and the sample in Fig. 12(d), was deposited at 1123 K. Both samples in Figs. 12(a) and 12(b) indicate absence of the (200) LSNO reflection however the sample in Fig. 12(c) did show reorientation. This indicates that sputtering power contributes to the reorientation phenomena. It has been seen in other systems [titanium (II) oxide (TiO2), indium-doped tin oxide (ITO), zinc (II) oxide (ZnO), etc.] that sputtering power has a significant effect on orientation in the film grown due to variation in energetics and mobility of the impinging atoms and therefore, the ability for their incorporation.Reference Lu, Hwang, Liu and Yang23–Reference Yu, Yan, Huang, Huang, Yan, Xhang, Liu, Zhang and Zhao25 Only changing the temperature still resulted in the reorientation of the LSNO c plane to the a plane.
Variation in parameters of (a) sputtering power (100 W), (b) power and pressure (100 W and 4 mTorr, respectively), (c) pressure (4 mTorr) and (d) temperature (1123 K). LSNO (200) reflection is absent in (a) and (b), indicating no reorientation is present in those samples.

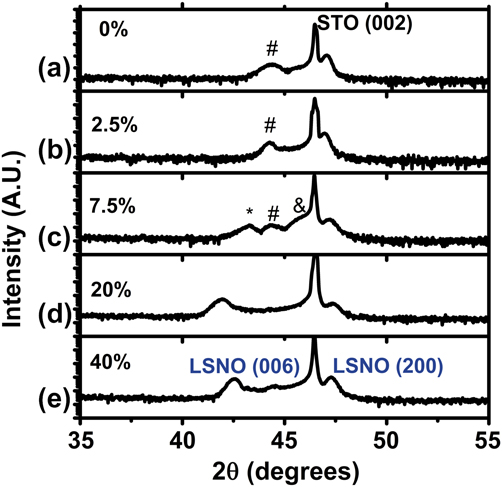
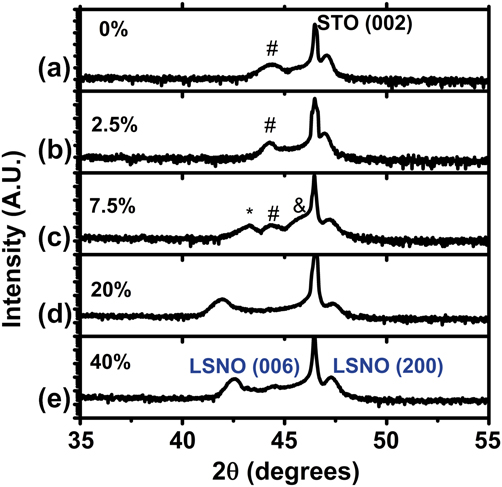
The final variable that we investigated for determining reorientation phenomena was the partial pressure of oxygen in the sputtering process gas. A reorientation due to oxygen has been seen in systems such as ITO and silver (I) oxide (Ag2O).Reference Kim, Lee, Heo, Kim and Park26,Reference Narayana Reddy, Sreedhar, Reddy, Uthanna and Pierson27 The respective diffraction patterns are shown in Fig. 13. Oxygen was incorporated into the process gas at 0% [Fig. 13(a)], 2.5% [Fig. 13(b)], 7.5% [Fig. 13(c)], 20% [Fig. 13(d)] and 40% [Fig. 13(e)]. At 20% [Fig. 13(d)] and 40% [Fig. 13(e)] oxygen (rest Argon), the LSNO film showed the behavior we saw in other samples where well defined (006) and (200) reflection was seen. However, at lower partial pressures [Figs. 13(a), 13(b), and 13(c)], multiple phases began to arise as well as a (200) peak. This most likely points to the substoichiometry of the LSNO target. Oxygen must likely be incorporated to stabilize the phase of the LSNO in the first few layers. A discussion pertaining to the target is given in Sec. III. F.
Diffraction patterns of LSNO grown on STO while varying oxygen partial pressure from (a) 0%, (b) 2.5%, (c) 7.5%, (d) 20% and (e) 40% oxygen in argon. #, *, and & indicate unidentified peaks. Partial pressure is shown to have a large effect on the reflection from the OR1 layer as indicated from variations in LSNO (006) position and multiple peaks.
F. Target dependence
When sputtering oxides, it is also extremely important to consider the conditions of the oxide target precursor. Though cation composition may be similar, depending on sintering conditions, deposition conditions for reorientation to occur may vary. A second target was prepared by the same vendor (ACI alloys) and target composition was verified by electron dispersion analysis measurements provided by the supplier. The target was considerably different in color from visual inspection, which indicated to us qualitatively that either the oxygen content or the crystal structure varied between the two targets. The target that was used initially was white in appearance whereas the new target that was used to grow films discussed in Figs. 14 and 15 was dull gray/black in appearance. From literature, it is known that stoichiometric La2−xSrxNiO4 should be gray/black in appearance.Reference Beltran, Dominguez, Montoya, Tavizon, Vincente and Viveros28–Reference Prabhakaran, Isla and Boothroyd30 Bulk LSNO being oxygen deficient are observed to be brown. This may indicate that the target having the white appearance (initial target) may not be fully annealed. Strontium oxide (SrO) and lanthanum (III) oxide (La2O3) are white in appearance whereas nickel (II) oxide (NiO) is light green. Therefore, if the target was not single phase, the variation of oxygen content could not be fully controlled due to the heterogeneity. This may also be the reason why at low oxygen partial pressures, multiple phases are seen as observed in Fig. 13. Such details are often of extraordinary importance in understanding properties of the resulting films or comparing results between different experiments or laboratories and hence reported here for completeness’ sake.
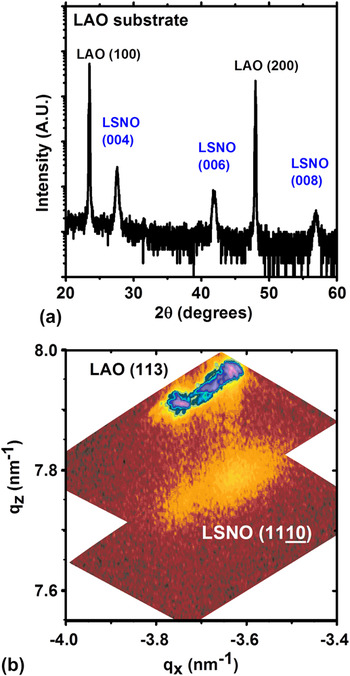
(a) Diffraction pattern and (b) reciprocal space map of optimized grown 100-nm LSNO thin films on LAO. Vertical streaks (qx) indicate epitaxial growth where the LSNO takes the in-plane lattice parameter of the substrate. Multiple peaks indicate existence of twins in LAO substrate.

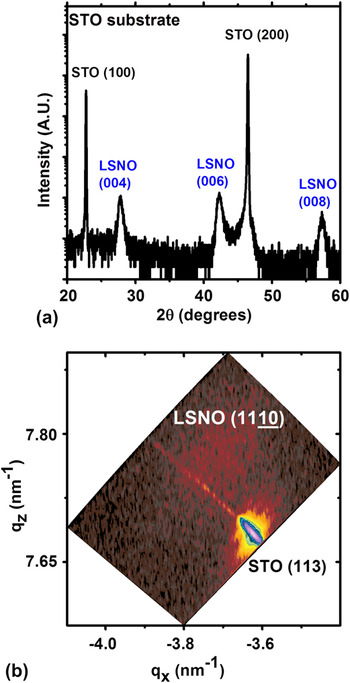
(a) Diffraction pattern and (b) reciprocal space map of optimized grown 100-nm LSNO thin films on STO. Position of diffuse peak with different in-plane lattice value (qx) indicates a relaxed growth in the c-direction with no reorientation.

Using conditions optimized for epitaxial c plane oriented growth, LSNO was deposited on (100) STO and LAO substrates at 150 W power, 4 mTorr pressure, 1123 K substrate temperature and 2% O2 in argon with the new target. Figure 14 shows the XRD data for LSNO grown on LAO substrate. Figure 14(a) shows the diffraction pattern, which is similar to that observed in Fig. 11. The c lattice parameter was calculated to be 12.93 Å. Figure 14(b) shows the reciprocal map around the (1110) LSNO film peak and the (113) LAO substrate peak (assuming a pseudocubic LAO structure). It should be noted that LAO undergoes a phase transition from rhombohedral to cubic at approximately 821 K,Reference Howard, Kennedy and Chakoumakos31 however the LAO substrate can be thought of as being pseudocubic with a lattice parameter of a = 3.79 Å at room temperature for the sake of simplicity. Therefore upon cooling, phase transition occurs causing twin domain formation.Reference Kim, Jang, Cho, Kim and Hong32 This is the origin of the multiple peaks in the reciprocal space map for the LAO substrate. The vertical streaks connecting the substrate peaks and the film peaks indicate that the LSNO film is in full coherence with the substrate i.e., LSNO is grown epitaxial under compressive strain on LAO, taking the same lattice parameter as the LAO substrate in the a, b plane.
The same conditions that resulted in epitaxial LSNO on LAO showed different results for LSNO grown on STO. It should also be noted that under these deposition conditions using the previous target, LSNO on STO still showed reorientation. The symmetric diffraction pattern taken from LSNO on STO is shown in Fig. 15(a). The c lattice parameter was calculated to be 12.83 Å. Under these optimized conditions, phase purity and orientation in the c growth direction were observed. The reciprocal space map [shown in Fig. 15(b)] for this growth also shows a diffuse peak out of coherence with the substrate peak indicating that the film is relaxed. Such a relaxation phenomenon observed in the reciprocal space map may occur with the introduction of misfit dislocations. This suggests that in order for reorientation to occur, relaxation mechanisms must be impeded, which may be caused by the excess oxygen during growth.
IV. DISCUSSION
In the isostructural La2CuO4 (LCO) system, tensile strain is accommodated by the creation of misfit dislocations.Reference Houben33 In many oxide systems, misfit dislocations accommodate the strain energy thereby allowing continued epitaxial growth.Reference Wakiya, Kuroyanagi, Xuan, Shinozaki and Mizutani34 In our previous study, epitaxial LSNO films were grown at lower oxygen partial pressures and faster deposition rates up to a thickness of 220 nm were (001) oriented.Reference Podpirka, Tselev and Ramanathan21,Reference Podpirka and Ramanathan35 Therefore, reorientation is not inherent in the growth of LSNO on tensile strained substrates.
A. Incorporation of interstitial oxygen
Due to the K2NiF4 structure, LSNO can accommodate interstitial oxygen within the rock salt layer of the lattice which arises from the large concentration of oxygen during sputtering. Nickelate p-type conductivity assuming the presence of interstitial oxygen ions in the structure allows us to write the defect equation (using Kroger Vink notation) as
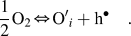 $${1 \over 2}{\rm{O}}_2 \Leftrightarrow {\rm{O'}}_i + {\rm{h}}^ \bullet \quad.$$
Written out fully for LSNO, this becomes
 $${1 \over 2}{\rm{O}}_2 + {\rm{V}}_i^x + 2{\rm{Ni}}_{{\rm{Ni}}}^x \Leftrightarrow {\rm{O''}}_i + 2{\rm{Ni}}_{{\rm{Ni}}}^ \bullet \quad.$$
If we assume the oxidation states of lanthanum, strontium and oxygen ions to be 3+, 2+, and 2−, respectively, the holes are located on nickel ion sites, which have variable valence. Due to the large anisotropy along the c axis correlated to elongated NiO6 octahedra, this structure can be described as made of nickel peroxide (NiO2) square planar sheets and lanthanum oxide (LaO) layers. The additional interstitial oxygen atoms would then be within the LaO layer.Reference Mauvy, Bassat, Boehm, Manaud, Dordor and Grenier36
The interstitial oxygen may increase the elastic energy of the film and therefore relaxation through misfit dislocations at the LSNO-STO interface may be impeded. Whereas the strain relaxation through misfit dislocations is common in metals due to their high intrinsic mobility, relaxation by nucleation and motion of dislocations is often limited in ceramics. It has been reported that the K2NiF4-type structure incorporates oxygen readily into the lattice leading to hyperstoichiometric phases.Reference Kharton, Viskup, Kovalevsky, Naumovich and Marques37 Oxygen excess in the rocksalt layer is charge-compensated by the formation of carriers in the perovskite layer.Reference Naumovich and Kharton38 This places the NiO2 plane under stress. In La2NiO4, the strain relaxation occurs by either a tilting of the NiO6 octahedra in the stoichiometric compound, which leads to an orthorhombic Bmab structure, or oxygen intercalation in the LaO rocksalt layer. When this occurs, the relaxation in the NiO2 plane arises both from the change in oxidation states from Ni2+ into Ni3+and from a tilting of NiO6 octahedra.Reference Frayret, Villesuzanne and Pouchard39 The doping of oxygen and strontium into the La2NiO4 lattice significantly affects the phase diagram of the system.Reference Hücker, Chung, Chand, Vogt, Tranquada and Buttrey40 Substitution of Sr2+ for La3+ into the La2NiO4 lattice has been shown to induce holes just as excess oxygen does. The nominal valence of the NiO2 layer is negative whereas that of the (La, Sr)O layer is positive. Doping with interstitial oxide ions or Sr2+ lowers the positive net charge in the rocksalt layer. Likewise the compensating holes reduce the negative net charge in the NiO2 planes.
B. Role of nickel valence in reorientation
In our study, due to high oxygen content during deposition, lattice effects from the oxygen doping appears to play a significant role in the layer reorientation. The role of oxygen in reorientation is important due to the effect it has on the Ni3+ valence. The work by Telesca et al.Reference Telesca, Wells and Sinkovic20 (on La2NiO4) and Yang et al.Reference Yang, Wang, Mao, Zhang, Liang, Soyer, Remiens and Dong41 (on LaNiO3) have indicated the role of oxygen partial pressure in reorientation. In both cases, the reorientation is attributed to the instability caused by the Ni3+ state.Reference Tsubouchi, Ohkubo, Kumigashira, Matsumoto, Ohnishi, Lippmaa, Koinuma and Oshima42 The oxidation of Ni2+ into Ni3+caused by oxygen incorporation leads to tilting of the NiO6 octahedra. This in turn leads to additional strain on the film, which is already in tension. The incorporation of interstitial oxygen into the lattice causes a tilting of the NiO6 octahedra and not just a simple lattice distortion.Reference Frayret, Villesuzanne and Pouchard39 There would be a point where it is no longer possible to accommodate the tensile strained film as it grows and must re-orient. Excess oxygen leads to an expansion of the c-lattice as well as a contraction of the a, b plane as described by Hücker et al.Reference Hücker, Chung, Chand, Vogt, Tranquada and Buttrey40 As all films grown are epitaxial and uncertainty to varying degrees of relaxation exists, it is difficult to relate the c-lattice parameter to an exact value of oxygen stoichiometry in the films. The subtle interplay between strontium- and oxygen codoping may also lead to differing critical thickness and should be explored in future work.
A key point to the reorientation phenomena observed is the fact that it only occurred on LSNO grown on STO and not on LAO, both grown under exactly the same conditions. This is observed in Figs. 1 and 11 which were both grown from the same target. This gives further evidence that the compressive strain can stabilize Ni valence and therefore prevent reorientation. Epitaxial growth under compressively strained conditions has been known to stabilize cation valence in nickelate systems and can therefore affect charge balance, thereby reducing tilting on the octahedra.Reference Ha, Otaki, Jaramillo, Podpirka and Ramanathan43
C. Role of surface energy in reorientation
According to Read et al., in the La2NiO4 system the surface energy of the unrelaxed and relaxed (100) plane is 3.07 and 0.98 J/m2, respectively which is the lowest among all planes. As a reference, (001) plane has an unrelaxed and relaxed surface energy of 3.55 and 1.55 J/m2 respectively.Reference Read, Islam, Watson and Hancock44 As stated previously, as the film grows thicker, the surface energy is minimized and the (200) layer becomes more textured. This texturing allows (200) orientation to be seen in both x-ray and electron diffraction. This is also the driving force behind the observation of the OR2-D1 and OR2-D2 regions (i.e., both having the same lowest surface energy). Thermal strain should play a minimal role in the reorientation due to the nearly equal thermal expansion coefficients of the materials; LSNO being approximately 11.5 × 10⁻⁶ K−1 whereas STO being approximately 11 × 10−6 K−1.Reference Aguadero, Escudero, Perez, Alonso, Pomjakushin and Daza45,Reference Kawashima, Yamada and Hirabayashi46
It should also be noted that from the XRD pattern in Fig. 1 and the pole figures in Figs. 8 and 9, there is no significant increase in intensity of the (006) peak nor is there a change of the (006) peak position as a function of growth indicating that the orientation of OR2 is solely that of the (200) parallel to the growth. This is in support of that observed in the recent work by Telesca et al. on La2NiO4 who interpreted the results as two distinct layers rather than mixed domains. They also reported four distinct orientations associated with domain tilting and tensile/compressive strain in the reorientation layer as well as a single orientation as the film grows thicker. They observed a single (001) orientation up to 450 nm. We observed two distinct in-plane orientations orthogonal to each other as confirmed by pole figure analysis which may likely be due to the fact that in our films, only a ∼15 nm thick layer (OR1) is strained and the columnar growth in the reoriented layer (OR2) is relaxed. These differences may arise from the deposition method used as well as the stoichiometry of the films (i.e., oxygen incorporation/strontium doping).
V. CONCLUSIONS
We observe a crystallographic reorientation in growth of highly oxygenated epitaxial LSNO thin films grown on STO substrate. An experimental design parameter space is determined for various growth orientation and the role of oxygen pressure during synthesis is highlighted. Due to the highly anisotropic nature of ionic conductivity in strontium-doped La2NiO4, the ability to grow films of different microstructure could be of interest in further exploration of carrier conduction properties in this interesting materials system.
ACKNOWLEDGMENT
The authors acknowledge NSF grant CCF-0926148 for financial support.