Implications
Single-step is a coherent method for combining phenotypic, pedigree and genomic information for genetic evaluation, and can be applied in situations where the traditional pedigree-based method is used. In this study, we demonstrate that a single-step method with an adjusted genomic relationship matrix in general performs well. The adjustment of the genomic relationship matrix is simple and easy to implement. Therefore, it is in principle straight-forward to incorporate the proposed method into an existing genetic evaluation system.
Introduction
Genomic selection has been widely applied in dairy cattle breeding (Hayes et al., Reference Hayes, Bowman, Chamberlain and Goddard2009; Loberg and Dürr, Reference Loberg and Dürr2009; VanRaden et al., Reference VanRaden, Van Tassell, Wiggans, Sonstegard, Schnabel, Taylor and Schenkel2009), and recently also in pig breeding (Brune, Reference Brune2011; Forni et al., Reference Forni, Aguilar and Misztal2011; Ostersen et al., Reference Ostersen, Christensen, Henryon, Nielsen, Su and Madsen2011). Genetic evaluation methods that incorporate the genomic information is a hot research topic.
The method that has traditionally been used in genetic evaluation systems is based on a linear mixed model, where genetic effects are correlated between animals with a covariance structure proportional to the additive relationship matrix determined by pedigree. This pedigree-based method relates phenotypes to genetic effects, while adjusting for fixed and non-genetic random effects, and it provides predictions for all animals in the pedigree. The initial methods for incorporating genomic information into genetic evaluation were multi-step methods (see for example Hayes et al., Reference Hayes, Bowman, Chamberlain and Goddard2009 and VanRaden et al., Reference VanRaden, Van Tassell, Wiggans, Sonstegard, Schnabel, Taylor and Schenkel2009). These methods consist of (1) constructing a response variable for the genotyped animals that summarises the phenotypic information, (2) a genomic prediction method that associates the response variable to the marker information and (3) blending genomic predictions with parent average estimated breeding values (EBV). Ostersen et al. (Reference Ostersen, Christensen, Henryon, Nielsen, Su and Madsen2011) studied multi-step methods consisting of the first two steps above for genomic prediction of daily gain (DG) and feed conversion ratio (FCR) in Danish Duroc pigs, and concluded that deregressed estimated breeding values (DR-EBV) should be used as response variable and that a genomic BLUP (GBLUP) method performed equally well compared with other genomic prediction methods. A multi-step method provides predictions for genotyped animals, but obtaining predictions for non-genotyped animals is not straight-forward. Recently, a single-step method (Legarra et al., Reference Legarra, Aguilar and Misztal2009; Aguilar et al., Reference Aguilar, Misztal, Johnson, Legarra, Tsuruta and Lawlor2010; Christensen and Lund, Reference Christensen and Lund2010) has been proposed, which on the one hand extends the pedigree-based method by incorporating marker information into the relationship matrix, and on the other hand extends the GBLUP method to non-genotyped animals. Single-step methods provide predictions for all animals in the pedigree. We expect that for prediction of genotyped animals, single-step methods are at least as accurate as a multi-step method, and that both outperform the pedigree-based method in this respect. Furthermore, the single-step methods include information about Mendelian inheritance through markers, thereby providing a more accurate modelling, and we therefore conjecture that for non-genotyped animals single-step methods also produce more accurate predictions than the pedigree-based method.
The essential component of the single-step method is that the genomic relationship matrix for genotyped animals is extended using pedigree information to a combined relationship matrix for all animals. The combined relationship matrix provides a coherent framework for genetic evaluations, however, there are some practical issues related to the construction of the genomic relationship matrix itself. The single-step method in theory requires that the genomic relationship matrix is constructed using the allele frequencies in the founder population of the pedigree, but these are not feasible to compute with sufficient accuracy in practice since founder animals are usually not genotyped. Two obvious alternatives are to use either observed allele frequencies or assume that allele frequencies are equal to 0.5 instead. Forni et al. (Reference Forni, Aguilar and Misztal2011) and Chen et al. (Reference Chen, Misztal, Aguilar, Legarra and Muir2011) concluded that using observed allele frequencies resulted in the most accurate predictions. In addition, adjustments to the genomic relationship matrix may be needed to make the genomic relationship matrix and the pedigree-based relationship matrix more compatible. Forni et al. (Reference Forni, Aguilar and Misztal2011) suggested to scale the genomic relationship matrix, whereas Chen et al. (Reference Chen, Misztal, Aguilar, Legarra and Muir2011) and Vitezica et al. (Reference Vitezica, Aguilar, Misztal and Legarra2011) suggested that a small number should be added to all elements of the genomic relationship matrix. Here, we suggest to both scale and add a small number to the elements in the genomic relationship matrix to make it compatible to the pedigree-based relationship matrix. We expect that the single-step method with this adjusted genomic relationship matrix (hereafter referred to as ‘adjusted single-step method’) would produce more accurate predictions and in general behave better than the original single-step method.
Genetic evaluation may be single-trait or multi-trait evaluation. Incorporating marker information into multi-trait genetic evaluation is feasible for both single-step methods (Tsuruta et al., Reference Tsuruta, Misztal, Aguilar and Lawlor2011) and GBLUP (Calus and Veerkamp, Reference Calus and Veerkamp2011). FCR is a trait of high economic importance in pig breeding. However, it is expensive to record, and therefore genetic evaluations for FCR usually combine information from DG, which is strongly correlated with FCR and is easy to record. The genetic evaluation for FCR is then based on a multivariate model including both DG and FCR, resulting in higher accuracy of prediction for FCR. Similar to using the bivariate model and pedigree-based method, one may conjecture that a bivariate model with a single-step method and a bivariate GBLUP could also be used as tools to improve the accuracy of predictions for FCR.
The specific aims of this study on DG and FCR in Danish Duroc pigs were to demonstrate that (1) single-step methods are at least as accurate as GBLUP for prediction of genotyped animals, and that both outperform the pedigree-based method in this respect, (2) single-step methods provide more accurate predictions than the pedigree-based method for non-genotyped animals, (3) adjusted single-step method produces more accurate predictions and behave better than the original single-step method, and (4) bivariate models improve accuracy of predictions for FCR, no matter which of the methods are used.
Material and methods
The pedigree-based, original single-step, adjusted single-step and GBLUP methods were compared for prediction of DG and FCR in Danish Duroc pigs. The records were split into a training dataset and a validation dataset, and corrected phenotypes in the validation dataset were used to compute the accuracy of predictions.
Data
Two traits were analysed: average daily gain (DG = weight gain/days) and FCR (FCR = feed intake/weight gain) in the interval 30 to 100 kg, both recorded from 1992 and onwards. Records of DG were on 330 302 animals, among which 25 900 animals also had FCR records. The animals with FCR records were all males, and most litters only had one or two animals with FCR records. The pedigree was traced back to year 1984, no animals were imported into the system and nearly all great-grandparents of animals with records were known. A similar dataset was studied in Ostersen et al. (Reference Ostersen, Christensen, Henryon, Nielsen, Su and Madsen2011), where further details can be found. Marker data were obtained for 2668 animals (born between 1996 and 2010) using the Illumina PorcineSNP60 BeadChip (Illumina, San Diego, CA, USA). All genotyped animals had a DG record, but only 1474 had an FCR record. The single-nucleotide polymorphism (SNP) data were edited using the same criteria as in Ostersen et al. (Reference Ostersen, Christensen, Henryon, Nielsen, Su and Madsen2011). After editing, there were 25 720 SNP markers available.
Models
Here, the pedigree-based, the original single-step, the adjusted single-step and GBLUP methods are described.
Pedigree-based
Both univariate and bivariate animal models for DG and FCR were studied. The models were based on the routine evaluation model in the Danish Duroc breeding programme. The fixed effects included start weight, herd-week-section, and for DG also sex. The random effects included pen and additive genetic effect. Litter was also included as random effect for DG. The genetic effect had a variance–covariance matrix with structure equal to the additive relationship matrix A constructed from the pedigree. For the bivariate model, the pen effects for the two traits were assumed to be uncorrelated. Variance components were estimated using Restricted Maximum Likelihood, and predicted breeding values were BLUPs implemented in software DMU (Madsen and Jensen, Reference Madsen and Jensen2010).
Original single-step
The models and inferences were similar to the pedigree-based models described above, with the exception that the structure of the variance–covariance matrix of the genetic effect was a combined relationship matrix (Legarra et al., Reference Legarra, Aguilar and Misztal2009; Aguilar et al., Reference Aguilar, Misztal, Johnson, Legarra, Tsuruta and Lawlor2010; Christensen and Lund, Reference Christensen and Lund2010)

where the division of the matrix is according to whether the animals have been genotyped or not. The matrices A 11, A 22 and A 12 are submatrices of A containing relationships among genotyped, among non-genotyped and between genotyped and non-genotyped animals, respectively, and superscript T indicates the transpose of a matrix. For the subset of genotyped animals

where the parameter w is the fraction of the genetic variance not captured by markers and G is the genomic relationship matrix in VanRaden (Reference VanRaden2008)

Here, m is a matrix with entries mij
= −1, 0, 1, when the SNP
j
of individual i is homozygote for the first allele, heterozygote, and homozygote for the second allele, respectively, 1 is a vector of ones and  is a vector with
 being the observed average of marker j across animals, corresponding to using observed frequencies, pj
, of the second allele. The parameter
 is scaling the genomic relationship matrix.
Adjusted single-step
For the combined relationship matrix H in equation (1) the relationship between non-genotyped animals contains two terms, A
22 is the expected relationship based on pedigree and  is the deviation from the expected relationship due to genomic information on relatives. The matrix Gw
in equation (2) here enters as Gw
−A
11 and this shows clearly that Gw
and A
11 should be compatible, that is, for the genotyped animals, the genomic relationship matrix G in equation (3) and the expected relationship matrix based on pedigree A
11 should be compatible. Forni et al. (Reference Forni, Aguilar and Misztal2011) suggested that G should be scaled such that the average of diagonal elements equal the average of diagonal elements of A
11, whereas Chen et al. (Reference Chen, Misztal, Aguilar, Legarra and Muir2011) and Vitezica et al. (Reference Vitezica, Aguilar, Misztal and Legarra2011) suggested that a small number should be added to all elements of G such that the average of all elements equal the average of elements of A
11. Here, we combined these two ideas and adjusted G to

where β and α solved the system of equations

An alternative way of estimating β and α in equation (4) is discussed in the supplementary material.
GBLUP
Alternatives to single-step methods are multi-step methods, where the procedure consists of several steps. Here, we used DR-EBV with parent average removed as response variable and GBLUP as the genomic model. The procedure was as in Ostersen et al. (Reference Ostersen, Christensen, Henryon, Nielsen, Su and Madsen2011), and is only briefly described here. First, EBV and associated reliabilities were obtained using the pedigree-based method described above. Second, the DR-EBV were computed using the procedure of Garrick et al. (Reference Garrick, Taylor and Fernando2009). Third, the genomic model used DR-EBV as response variable and assumed that the genetic effect had a variance–covariance matrix with structure G shown above, and the residual variance had weights computed from reliabilities of DR-EBV according to Garrick et al. (Reference Garrick, Taylor and Fernando2009). Further details can be found in Ostersen et al. (Reference Ostersen, Christensen, Henryon, Nielsen, Su and Madsen2011). For the bivariate GBLUP, the procedure was similar with the differences being that, the EBV and associated reliabilities were obtained using the pedigree-based bivariate model for the two traits, and a bivariate genomic model was used to predict genomic breeding values (GBV).
Comparison of methods
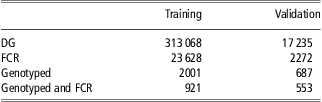
The predictive abilities of the different methods were investigated by splitting the records into a training dataset and a validation dataset by date 1 October 2008. To avoid having several generations of animals in the validation dataset, only animals with both parents in the training dataset were included. Table 1 provides an overview of the numbers of animals in the different datasets.
Numbers of animals with records of DG and FCR in the training and in the validation dataset, respectively, as well as the numbers of genotyped animals in the two datasets

DG = daily gain; FCR = feed conversion ratio.
Note: all genotyped animals have DG record, but only some have FCR record.
The training dataset was used for estimation of model parameters and for predicting GBV of animals in the validation dataset for the different methods. To avoid use of overlapping information between the reference and validation datasets (Amer and Banos, Reference Amer and Banos2010), we based the validation on phenotypes corrected for fixed effects and non-genetic random effects. The accuracy of prediction is reflected by the validation correlation Cor(GBV, yc
), where  is phenotype corrected for fixed effects and other random effects for DG and FCR, respectively. These corrected phenotypes were computed using the pedigree-based bivariate model presented above on the full dataset. The comparison of the different methods was therefore based on these validation correlations, and differences were assessed using the Hotelling–Williams t-test (Dunn and Clark, Reference Dunn and Clark1971; Revelle, Reference Revelle2010) at confidence level 5% as in Ostersen et al. (Reference Ostersen, Christensen, Henryon, Nielsen, Su and Madsen2011). Some R code for the Hotelling–Williams t-test is provided in the supplementary material. Furthermore, to assess possible inflation of predictions, a regression of yc
on GBV was made and it was investigated whether the regression coefficient was close to one. These comparisons were made for all animals in the validation dataset and for the two subgroups of genotyped and non-genotyped animals. Finally, estimated genetic trends were studied for the two single-step methods and the pedigree-based method, by computing averages of predicted genetic values by birth year.
Results
The averages of diagonal and all elements of A 11 were 1.145 and 0.298, respectively, whereas for G they were 0.985 and 0, respectively. These numbers resulted in parameter values α = 0.298 and β = 0.859 in equation (4) for the adjustment of G. Investigations showed that the validation correlations Cor(GBV, yc ) were not very sensitive to the value of w in equation (2), with the optimal value of w being in the range 0.15 to 0.3 (see supplementary material). Here, we only present results with w = 0.25.
DG – univariate analysis
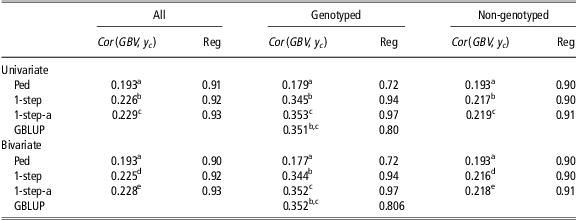
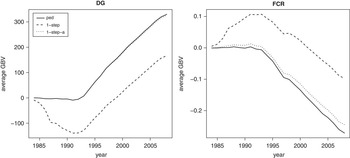
For the univariate analysis of DG, Table 2 shows that the predictions using the single-step methods have a higher validation correlation and therefore are more accurate than predictions using the pedigree-based method for both genotyped and non-genotyped animals. It is also seen that the adjusted single-step method is more accurate than the original single-step method. For the subset of genotyped animals, the predictions using GBLUP are slightly less accurate than the adjusted single-step method (although not statistically significant). The regression coefficients are not very different from one for any of the three methods when studying all animals. For the subset of genotyped animals the regression coefficients are somewhat smaller than one for the pedigree-based method and GBLUP. The estimated genetic trends in the left plot of Figure 1 are nearly identical for the pedigree-based and the adjusted single-step method, but different for the original single-step method. All three methods clearly demonstrate the genetic increase in DG from 1992 and onwards, but the genetic trends between years 1984 and 1992 clearly differ, with the original single-step method showing a genetic decrease and the two other methods showing no genetic change.
Daily gain

GBV = genomic breeding values; yc = corrected phenotypes; Reg = regression coefficients; Ped = pedigree-based method; GBLUP = genomic BLUP.
Correlations between GBV and yc and Reg for regression of yc on GBV for the Ped, the original single-step method (1-step), the adjusted single-step method (1-step-a) and the GBLUP method.
Results are presented from both a univariate analysis and bivariate analysis with feed conversion ratio as secondary variable, and for all animals in the validation dataset and the two subsets of genotyped and non-genotyped animals
Superscripts indicate groups of correlations where the pairwise differences are not statistically significant (P < 0.05) according to the Hotelling–Williams t-test. The superscripts should not be interpreted across columns.
Average genetic values by birth year for DG (left plot) and FCR (right plot) estimated using the pedigree-based method (solid line), the original single-step method (1-step, dashed line) and the adjusted single-step method. DG = daily gain; FCR = feed conversion ratio; Ped = pedigree-based method.

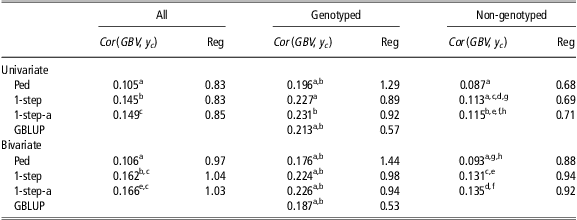
FCR – univariate analysis
Table 3 shows similar results to above. Again, single-step methods are more accurate than the pedigree-based method for both genotyped and non-genotyped animals (although the differences are not statistically significant for the subset of genotyped animals), and the adjusted single-step method is more accurate than the original single-step method. For the subset of genotyped animals, GBLUP is less accurate than the two single-step methods, although the difference is not statistically significant. The regression coefficients are somewhat smaller than one for the pedigree-based method and the two single-step methods when studying all animals. For the subset of genotyped animals, the regression coefficient is smaller than one for GBLUP and larger than one for the pedigree-based method. The estimated genetic trends in the right plot of Figure 1 show a story similar to the genetic trends for DG. The genetic improvement (reduction) of FCR from 1992 and onwards is clearly visible, and the reverse (increasing, here) genetic trend between 1984 and 1992 for the original single-step method is also seen.
Feed conversion ratio

GBV = genomic breeding values; yc = corrected phenotypes; Reg = regression coefficients; Ped = pedigree-based method; GBLUP = genomic BLUP.
Correlations between GBV and yc and Reg for regression of yc on GBV for the Ped, the original single-step method (1-step), the adjusted single-step method (1-step-a) and the GBLUP method.
Results are presented from both a univariate analysis and bivariate analysis with daily gain as secondary variable, and for all animals in the validation dataset and the two subsets of genotyped and non-genotyped animals
Superscripts indicate groups of correlations where the pairwise differences are not statistically significant (P > 0.05) according to the Hotelling–Williams t-test. These superscripts should not be interpreted across columns.
Bivariate analysis
The results from the bivariate analysis in Tables 2 and 3 are similar to those from the univariate analyses above in terms of accuracy of prediction. The regression coefficients for both DG and FCR are not very different from one for any of the three methods when studying all animals. For the genotyped animals, the regression coefficients for GBLUP are smaller than one, in particular for FCR. When comparing results from bivariate analyses with results from univariate analyses, the accuracy for FCR increases (although not statistically significant) and the accuracy for DG decreases slightly (differences in the final decimal) for the two single-step methods. For the subset of genotyped animals, a decrease was seen in accuracy for all four methods, in particular for GBLUP (not statistically significant). The regression coefficients for FCR are closer to one in the bivariate analysis compared with the univariate analysis for the pedigree-based and the two single-step methods, but not for GBLUP. The estimated genetic trends (results not shown) are qualitatively similar to the univariate results.
Discussion
The results show that the three methods with marker information (two single-step methods and GBLUP) produce more accurate predictions of genotyped animals than the pedigree-based method. In addition, single-step methods produce more accurate predictions for non-genotyped animals. Therefore, extra genetic gain can be expected by using genomic selection, and the better prediction for non-genotyped animals implies that a single-step method can completely replace a pedigree-based method in a genetic evaluation system.
The adjusted single-step method performs better than the original single-step method in two senses. First, more accurate predictions were obtained in both the univariate and the bivariate analyses. Second, for the original single-step method a reverse genetic trend was seen for the very old animals born between 1984 and 1992. Since there were no data records on animals born before 1992, this reverse genetic trend is clearly an artifact of the original single-step method. The adjusted genomic relationship matrix Ga = βG + α is more compatible to the matrix A 11 than G is. The actual parameter values α and β in this paper gives a matrix Ga = 0.859G + 0.298 which is nearly on the form (1 − γ/2)G + γ considered in Vitezica et al. (Reference Vitezica, Aguilar, Misztal and Legarra2011) and Powell et al. (Reference Powell, Visscher and Goddard2010), with γ = 0.298 equal to twice the average expected relationship of gametes. The matrix G reflects relationships relative to the population of genotyped animals and an adjustment (1 − γ/2)G + γ would reflect a translation from these relationships to relationships relative to the base population defined by pedigree; see Vitezica et al. (Reference Vitezica, Aguilar, Misztal and Legarra2011) and Powell et al. (Reference Powell, Visscher and Goddard2010). Therefore, the better compatibility of Ga = βG + α to A 11 is because the relationships in the two matrices become relative to the same base population. Note that there is a small difference between the adjustment Ga = 0.859G + 0.298 and the adjustment (1 − γ/2)G + γ = 0.851G + 0.298. The expected average relationship of gametes, γ/2 = 0.149, is computed assuming no structure in the population. But the population of genotyped animals is structured, as it consists of animals born in different periods of times (and some being direct descendants of others). Powell et al. (Reference Powell, Visscher and Goddard2010) only considered translations from a current population to an old population, and they did not claim that their approach should be applied in a population consist of animals living in different periods of time. We suggest that the adjustment Ga = βG + α is more generally applicable than the adjustment (1 − γ/2)G + γ. In summary, the better compatibility between Ga = βG + α and A 11 explains the better performance of the adjusted single-step method compared with the original single-step method.
The results from the bivariate analysis show that, compared with the univariate analysis, both bivariate single-step methods improve the accuracy of predictions somewhat, and also have regression coefficients closer to one for FCR. This shows that for a sparsely observed trait, a single-step method may be used as a tool to improve predictions. However, predictions for DG are slightly less accurate than in the univariate analysis which is an indication that this bivariate analysis is not entirely unproblematic. We interpret this as an indication of a possible problem with the structure of the bivariate model. The trait FCR is the ratio between feed intake and weight gain, and the association between FCR and DG then becomes the association between a ratio and its denominator. The poor statistical properties of FCR are well-known (Gunsett, Reference Gunsett1984) and using a linear index instead of FCR has been proposed (Gunsett, Reference Gunsett1984; Hoque et al., Reference Hoque, Suzuki, Kadowaki, Shibata and Oikawa2007). To summarise, a multi-trait single-step method may replace a multi-trait pedigree-based method as a tool to improve the accuracy of predictions for a sparsely observed trait.
For the subset of genotyped animals only few of the differences in accuracy are statistically significant. In addition, accuracies for FCR are smaller in the bivariate analysis compared with the univariate analysis for all four methods, and the regression coefficients are much different from one for the pedigree-based method and GBLUP. First, the number of genotyped animals is small compared with the total number of animals, which causes that fewer differences are statistically significant. Second, the smaller accuracies for FCR in the bivariate analysis are far from being of any statistically significance (P-values in the range 0.33 to 0.70). Third, the regression coefficients being lower than one for GBLUP is a well-known phenomenon, which may partly be handled by the usual third step (blending) in a multi-step method. Finally, the subset of genotyped animals is not a random sample of animals in the validation dataset. Actually, the genotyping was made after the animals had own records of these two traits, and two of the criteria that entered into the decision on which animals to genotype were the selection index, and existence of own FCR record. To conclude, in this study the comparison of methods based on the subset of genotyped animals is not so informative and also not unproblematic.
In this paper, differences in validation correlation between methods are assessed with the Hotelling–Williams t-test. Most previous papers on genomic evaluation have not made any assessment of statistical significance of differences in accuracy between methods. The likely reason for this is that confidence intervals for accuracies of different methods are often highly overlapping, which falsely gives the impression of statistical non-significance. The Hotelling–Williams t-test takes into account the strong correlation of predictions from different methods, and is therefore a much more powerful test. The test is known in psychology (Revelle, Reference Revelle2010), but does not seem to be much known in other scientific fields. In this study, the statistical significances reported in Tables 2 and 3 may puzzle some readers. For example, for the univariate analysis of FCR and the subset of genotyped animals, the validation correlation of adjusted single-step is largest (Cor(GBV, yc ) = 0.231) followed by original single-step (Cor(GBV, yc ) = 0.227) and GBLUP (Cor(GBV, yc ) = 0.213), but only the difference between adjusted single-step and original single-step is statistically significant. The explanation for this phenomenon is that the Hotelling–Williams t-test takes the correlation between predictions into account, and the correlation between the predictions from the two single-step methods (0.999) is very high, whereas the correlations between GBLUP and each of the single-step methods (0.928 and 0.927) are smaller. Another example is DG using the adjusted single-step method, where the difference between the univariate (Cor(GBV, yc ) = 0.229) and the bivariate (Cor(GBV, yc ) = 0.228) prediction is statistically significant. The explanations are: first, the comparison is based on 17 235 records; and second, the correlation between the two predictions (0.997) is very high. The Hotelling–Williams t-test is indeed a powerful and very useful test for comparisons of genomic evaluation methods.
Finally, a word of caution should be said about interpreting the correlations in Tables 2 and 3. These numbers should not be used directly to compute any actual gain by using genomic selection with a single-step method compared with the traditional selection using a pedigree-based method, or actual gain by using a bivariate model compared with a univariate model. In this study, the predicted GBV for the validation population are based on the assumption that the phenotypes for these animals are unknown, which does not correspond to a common scenario in pig breeding where the phenotypes for some traits would be known at the time of selection. The numbers in Tables 2 and 3 only provide support for preferring some models to others. Predicting genetic gain by genomic selection in a pig breeding scheme would be an interesting topic for future research.
Conclusions
Single-step methods provide more accurate predictions than the pedigree-based method for both genotyped and non-genotyped animals, and similar accuracies compared with GBLUP for genotyped animals. In addition, the adjusted single-step method produce more accurate predictions and behave better than the original single-step method. Finally, a single-step method may replace a pedigree-based method as a tool to improve the accuracy of predictions for a sparsely observed trait.
Acknowledgements
The work was performed in a project funded through the Green Development and Demonstration Programme (grant no. 3405-11-0279) by the Danish Ministry of Food, Agriculture and Fisheries, the Pig Research Centre and Aarhus University. The authors wish to thank Zulma Vitezica for showing a pre-published version of Vitezica et al. (Reference Vitezica, Aguilar, Misztal and Legarra2011).
Supplementary materials
For supplementary material referred to in this article, please visit http://dx.doi.org/doi:10.1017/S1751731112000742