1. Introduction
The slow recovery of the US economy from the Great Recession created concerns about demand-side secular stagnation (Summers (Reference Summers2014)); however, headline output gap estimations did not show a persistent economic slack over the last business cycle. The Congressional Budget Office (CBO) and the Hodrick–Prescott (HP) filter estimations pointed to a narrowing output gap over 2010–2018 and an overheating since early 2018. The Federal Reserve started to raise policy rates in late 2016, believing that the economy was approaching its full capacity, based on Greenbook projections. However, unemployment continued to decline to historically low levels, and inflation remained stable. In his 2019 testimony, Fed chair Jerome Powell said, “[…] monetary policy hasn’t been as accommodative as we had thought” (Li (Reference Li2019)).
Abandoning expansionary policies despite the concerns about a lasting economic slack raised questions about the reliability of the headline output gap estimations. A common feature of the headline output gap measures is not taking sectoral heterogeneity into account. CBO estimates the potential output and output gap of the US economy by the production function approach applied to households, nonprofit institutions, nonfarm business sector, farms, and government (Shackleton (Reference Shackleton2018)). Although CBO uses a sectoral method, its sectoral decomposition does not overcome the aggregation bias because most of the output (around 75%) is produced by only one sector (nonfarm business). As I discuss in detail in Section 2, CBO’s estimations have been controversial due to the natural rate hypothesis and frequent revisions to potential output, which constantly converges to actual output (Coibion et al. (Reference Coibion, Gorodnichenko and Ulate2018), p. 352). HP filter, on the other hand, assumes a state-space form, in which output gap becomes the white noise measurement error that “exhibit[s] no discernible patterns” (Hamilton (Reference Hamilton2018), p. 4). A major drawback of the HP filter is backward revisions to the trend after new data become available that creates spurious output gaps before recessions (Cerra and Saxena (Reference Cerra and Saxena2017), p. 12). HP filter is applicable at the sectoral level; however, it cannot reveal the sectoral heterogeneity with a constant smoothing parameter that reflects aggregate business cycle properties. Fed’s Greenbook forecasts are weighted combinations of statistical filters and more theoretical models where the weights are based on policymakers’ judgments (Coibion et al. (Reference Coibion, Gorodnichenko and Ulate2018), p. 354).
The unsatisfactory performance of the headline estimations of the output gap gave rise to alternative measurements. Owyang et al. (Reference Owyang, Guisinger and Shell2018) estimate the US output gap in the last business cycle by unobserved components (UC) and multivariate unobserved components (MUC) models. The UC model output gap does not recover after the Great Recession, and for 2015, it predicts an excess capacity reaching almost
 $\$1$
trillion (in 2009 dollars). The MUC output gap declines more than the UC model estimations in the last business cycle and shows an excess capacity of over
 $\$1$
trillion in 2015. Coibion et al. (Reference Coibion, Gorodnichenko and Ulate2018) estimate potential output using three alternative methods (structural VAR models of Blanchard and Quah (Reference Blanchard and Quah1989), Gali (Reference Gali1999), and Cochrane (Reference Cochrane1994)) by imposing long-run restrictions on output shocks to distinguish the ones which can affect long-run growth. Their findings point to a larger negative output gap than CBO and the HP filter as of early 2017, ranging from 5% to 10%. Fontanari et al. (Reference Fontanari, Palumbo and Salvatori2019) find a negative output gap for late 2017 using Okun’s law with a target unemployment rate of 3.4%, the lowest since 1960.
Although alternative potential estimations capture the economy-wide slack better than CBO and the HP filter, they continue to rely on aggregate data and assume the same cycle for each sector. However, each sector has its cycle, which does not necessarily match the business cycle (Burns and Mitchell (Reference Burns and Mitchell1946)). Cycles of manufacturing, retail trade, transportation, arts-entertainment, and food-accommodation follow business cycle fluctuations closely. In contrast, others present less cyclicality than the business cycle, such as information, real estate, education, healthcare, and government. The magnitudes of sectoral cycles are also different from the macroeconomic cycles as sectors do not grow in balance with GDP. Information, finance, real estate, healthcare, and professional-business services have grown faster than GDP since 1980. In contrast, the growth of agriculture, mining, and utilities has been lower than the macroeconomic growth rate post-1980. Missing the sectoral dynamics creates the aggregation bias and hides the details about the distribution of the output gap.
Burns and Mitchell (Reference Burns and Mitchell1946) estimate specific cycles of various economic series by first identifying their turning points (peaks/troughs). Then, they calculate the average value of each series over each cycle (from trough to trough) and convert the series into percentages of the calculated averages (Burns and Mitchell (Reference Burns and Mitchell1946), pp. 24−25). Instead of aggregating specific cycles to derive the aggregate output gap, Burns and Mitchell (Reference Burns and Mitchell1946) use the sectoral information (with judgmental weights on individual series) to predict the turning points of the business cycle. Similarly, the National Bureau of Economic Research (NBER) tracks several economic variables (such as personal income less transfer payments, and payroll employment) without giving formal weights to any of them in dating business cycle turning points.Footnote 1 However, NBER does not publish potential output and output gap series for the US.
There are studies that use several cyclical indicators with nonparametric approaches to derive the common trend of the business cycle. Pybus (Reference Pybus2011) estimates the UK’s output gap based on a principal component analysis (PCA) applied to survey-based indicators such as recruitment difficulties of industries and capacity utilization rates of manufacturing and services firms. This method estimates “the weight to be placed on each series based on the correlation of the dataset” (Murray (Reference Murray2014), p. 27). Erdogan Cosar et al. (Reference Erdogan Cosar, Kosem and Sarikaya2013) apply a similar method to Turkey to get a proxy for the output gap from survey-based variables without referring to aggregate data or statistical filters. Although PCA can bring detailed sectoral information together, it has two disadvantages. First, there is significant room for judgment in determining the mean and the standard deviation of the principal component of the series (Murray (Reference Murray2014), p. 26). Second, this method looks for an aggregate factor behind sectoral cycles with the belief that sectoral cycles are driven by the business cycle. However, each sector has its specific cycle, as Burns and Mitchell (Reference Burns and Mitchell1946) argue; therefore, it is possible that idiosyncratic sectoral shocks drive the business cycle fluctuations (Foerster et al. (Reference Foerster, Sarte and Watson2011), Atalay (Reference Atalay2017)).
This paper contributes to the output gap literature from a sectoral perspective by estimating the US output gap over 1948–2020 through a bottom-to-top approach. I model cycles of 20 two-digit sectors based on their investment cycles, which signal sectoral bottlenecks and inflationary pressures. I first identify peak years of sectoral investment expenditures and define the segment of the output series between two peak years as a cycle in the tradition of Burns and Mitchell (Reference Burns and Mitchell1946). Then, I apply the peak-to-peak method to sectoral output, which can be classified under nonparametric methods, to get sectoral potential levels (see Harding and Pagan (Reference Harding and Pagan2002) and Harding and Pagan (Reference Harding and Pagan2005) for a discussion of the classical cycle and nonparametric approaches). I take the value-added shares of the sectors as their weights in aggregation. Decomposing the value-added into sectoral components solves the weighting problem in Burns and Mitchell (Reference Burns and Mitchell1946) and the PCA. I refer to this method as investment peak-to-peak (IPP) to distinguish it from peak-to-peak.
After estimating sectoral output gaps, I first calculate their weighted mean and find generally negative output gaps post-1990. Then, I explore different aggregation techniques, such as the weighted quartiles. Results show that the output gap of bottleneck sectors (weighted Q3) is correlated strongly with the core personal consumption expenditures (PCE) inflation both before and after the mid-1980s. The output gap of slack sectors (weighted Q1), on the other hand, shows the spare capacity in the economy better than the weighted mean. Policymakers can track bottleneck sectors to control inflationary pressures while targeting slack sectors to stabilize the output at its potential.
The paper has two policy conclusions. First, the Phillips curve is alive with the correct economic slack measures. In recent decades, the relation between headline output (or unemployment) gap measures and inflation has weakened, which created concerns about the policy value of Phillips curves. My estimations show that both the weighted Q3 and the weighted mean output gaps predict inflation better than the headline measures in an anchored expectations specification of the Phillips curve. My results also explain the missing deflation during the Great Recession and inflation in the following recovery by the stability of the output gap of bottleneck sectors around
 $0$
over 2008–2019, unlike the early post-war recessions and recoveries.
Second, secular stagnation is not an inevitable feature of the American economy. My findings point to insufficient stabilization policies rather than structural factors in explaining secular stagnation. According to the weighted mean output gap, there was a spare capacity of around 1% in 2019, coming from wholesale trade, information, management of companies, arts-entertainment, and government. Policymakers could have eliminated the output gaps of these sectors without creating inflationary pressures. My estimations also show that the economic slack in 2020 was above 6%, which is more than the CBO’s estimations (5%) and the HP-filtered output gap (3%).
The paper is organized into five sections. In Section 2, I discuss the existing output gap measures in comparison to my methodology. In Section 3.1, I describe how I model sectoral cycles in detail on manufacturing and government, as representatives of cyclical and less cyclical sectors. I report output gaps at the aggregate by the weighted mean and weighted quartiles in Section 3.2 and compare them to CBO, the HP filter, and Fed’s Greenbook forecasts. In Section 4, I estimate Phillips curves with different quartiles of the sectoral distribution and discuss the contemporary macroeconomic significance of my findings in connection with the secular stagnation hypothesis. Section 5 is the conclusion.
2. The existing output gap measures
In the literature, there is not an agreed-upon definition of what potential output means. Blecker and Setterfield (Reference Blecker and Setterfield2019) discuss two definitions: Full employment output and full capacity output. Full employment output assumes that potential is constrained by the availability of labor, whereas full capacity assumes a labor abundant economy in which capital is the constraining factor of production. Full utilization of capacity corresponds to the output level, which minimizes the costs of production. Producing above the full capacity output is possible but not desired due to rising overtime payments and more frequent breakdown of the machinery, as discussed by Blecker and Setterfield (Reference Blecker and Setterfield2019). Therefore, if a firm operates above its full capacity for a sustained period, it will invest more to increase its productive capacity. This approach fits well with the investment method used in the paper for estimating output gaps of sectors.
Shaikh and Moudud (Reference Shaikh and Moudud2004, p. 2) define potential output as “the desired level of output from given plant and equipment” and mention that economic capacity does not necessarily require full employment of the labor force. Nikiforos (Reference Nikiforos2016, p. 439) divides the economic capacity into preferred capacity that refers to production level, which minimizes cost, and practical (full) capacity that assumes maximum use of non-quasi-fixed inputs of production. The Federal Reserve Board (FRB) takes the full capacity definition from Survey of Plant Capacity (SPC) as the level of output “under normal and realistic operating conditions,” as reported by Nikiforos (Reference Nikiforos2016, p. 446). On the other hand, Dynamic Stochastic General Equilibrium (DSGE) models assume that potential output is the output without nominal frictions (Smets and Wouters (Reference Smets and Wouters2007)). CBO defines potential output as “a measure of maximum sustainable output—the level of real GDP in a given year that is consistent with steady growth and a stable rate of inflation.” (Shackleton (Reference Shackleton2018), p. 3) and Borio et al. (Reference Borio, Disyatat and Juselius2017) add financial neutrality to the definition of sustainability. I define potential output as the maximum attainable, non-inflationary level of output.
As in the case of the definition of potential output, there is no consensus on a standard approach to estimating it. One strand of the literature estimates the potential output by using the aggregate output data and applying parametric approaches: Either a theoretical model such as a production function or statistical filters such as the HP filter to derive the trend of the output series.
CBO uses the production function approach to estimate the potential GDP of the US economy. Shackleton (Reference Shackleton2018, p. 8) defines the general methodology as first estimating potential labor force and potential employment, then distributing it to the sectors of the BEA (households, nonprofit institutions, nonfarm business sector, farms, and government), and estimating the potential output of each industry by its production function.Footnote 2
For the nonfarm business that makes almost 75% of the US economy, CBO uses a Solow growth model that combines potential labor hours
 $\left(L^*_t\right)$
, capital service
 $\left(K_t\right)$
, and potential total factor productivity
 $\left(A^*_t\right)$
under a Cobb−Douglas production technology (constant
 $c$
is needed because right-hand side variables are index values).
 \begin{equation} {log}\!\left(\textrm{GDP}^*_t\right)={log}\!\left(A^*_t\right)+\left(1-\alpha _t^*\right) {log}\!\left(L^*_t\right) + \alpha _t^* {log}(K_t) + c, \end{equation}
CBO estimates a variable’s trend by using the employment gap as a proxy for business cycle fluctuations. The employment gap is defined as the percent difference between actual employment and potential employment, calculated as potential labor force times one minus the natural rate of unemployment. CBO adjusts for cyclical movements of a series by a methodology called piecewise log-linear regression with time trends.Footnote
3
Potential labor hours
 $\left(L^*_t\right)$
and total factor productivity
 $\left(A^*_t\right)$
are estimated in this way; however, capital input
 $\left(K_t\right)$
is left as it is because marginal productivities of different types of capital “already represent the potential contribution of capital to output.” (Owyang et al. (Reference Owyang, Guisinger and Shell2018), p. 300) Lastly, CBO smooths the capital share by the HP filter and weights growth rates of inputs by
 $(1-\alpha ^*)$
and
 $\alpha ^*$
, respectively.
There are many problems with the CBO’s estimations. First, the existence of a production function is controversial. Felipe and McCombie (Reference Felipe and McCombie2014) argue that aggregate production function is a direct transformation of the national accounting definition of the gross value-added as the compensation of employees plus gross operating surplus. When market values of labor and capital inputs are used for aggregation, the Cobb−Douglas production function necessarily fits data because this is how data are compiled in national accounts.
Second, CBO’s potential output, believed to be determined by supply-side factors such as productivity and labor force growth, constantly converges to actual output by eliminating output gaps. One of the reasons for the convergence is frequent revisions to potential output. Figure 1 shows the revisions in the last business cycle.
Potential output estimations of CBO with log deviations from Q1 2007.

Another reason for the convergence is the natural rate of unemployment, which is at the center of cyclical adjustments through the piecewise log-linear regressions. However, the natural rate is unobserved and theory-dependent. Blanchard (Reference Blanchard2018) discusses the recent evidence against the two hypotheses coming with the natural rate: Independence and accelerationist. The permanent loss in output after recessions questions the validity of the independence hypothesis. The accelerationist hypothesis is also controversial because deflation did not occur when unemployment was above its long-run rate during the Great Recession and inflation was stable in the following recovery while unemployment was at historically low rates.
The IPP method has several advantages compared to CBO. First of all, it predicts inflation better than the CBO, as I discuss in detail in 4.1. Second, it does not assume the existence of either a production function or a natural rate of unemployment. Third, it does not require the information of business cycle peaks from NBER, which generally comes with a lag. Finally, it uses more disaggregated sectoral data and shows bottleneck and slack sectors separately in addition to the economy-wide gap.
Another theoretical approach to estimate potential output is via Okun’s Law, which posits an empirical relationship between the output gap and unemployment gap, calculated for a reference rate. This rate is generally taken as the natural rate of unemployment; however, Fontanari et al. (Reference Fontanari, Palumbo and Salvatori2019) use different target rates to estimate the potential output of the US over 1959–2017. By setting three different unemployment regimes (low (
 $u \leq 5.2$
), medium (
 $5.3\leq u \leq 6.6$
), and high (
 $u \geq 6.7$
)) and two target unemployment rates (
 $u^*=4$
and
 $u^*=3.4$
), they estimate two potential output series, both of which give larger output gaps than CBO’s estimates. León-Ledesma and Thirlwall (Reference León-Ledesma and Thirlwall2002) also use Okun’s law to estimate the potential output, but they interpret the growth rate, which leaves the unemployment rate constant in Okun’s equation, as the natural rate of growth. For the US economy over 1961–1995, the natural growth rate is estimated as 2.99%, which is lower than the CBO potential output growth (3.33%) over the same period.
On the other hand, statistical filters derive potential output from the actual output by filtering out the actual output series’ trend by minimizing cyclical fluctuations or bringing some business cycle models to estimate the output gap. The most common filter is the HP filter that minimizes the sum of squares of the output gap plus the fluctuations in the trend through a smoothing parameter
 $\lambda$
:
 \begin{equation} \min _{y^*} \left(\sum _{t=1}^T\left(y_t-y_t^*\right)^2+\lambda \sum _{t=2}^{T-1}\left(\Delta y_{t+1}^*-\Delta y_t^*\right)^2\right). \end{equation}
As
 $\lambda$
approaches zero, trend output converges to actual output, and as it rises, trend output becomes smoother. Hamilton (Reference Hamilton2018) shows that the solution to the minimization problem is equivalent to
 $y^*$
filtered from the following state space form when
 $\lambda =\sigma _1^2/\sigma _2^2$
:
 \begin{equation} y_t=y_t^*+e_t, e_t \sim N\!\left(0,\sigma _1^2\right), \end{equation}
 \begin{equation} \Delta y_t^*=\Delta y_{t-1}^*+u_t,u_t \sim\! N\left(0,\sigma _2^2\right). \end{equation}
The HP filter assumes that the cycle
 $e_t$
is serially uncorrelated,
 $\lambda$
is fixed and
 $e_t$
and
 $u_t$
are uncorrelated (Grant and Chan (Reference Grant and Chan2017)). Owyang et al. (Reference Owyang, Guisinger and Shell2018) argue that choosing the correct
 $\lambda$
is one of the problems in using the HP filter. Another issue is the usage of past and future levels in the optimization to derive the trend output at any point in time. As Hamilton (Reference Hamilton2018) shows, the cycle component of the HP filter has an artificial predictive power that comes from its dependence on future values. The internalization of future recession information creates spurious positive output gaps before downturns in GDP (Cerra and Saxena (Reference Cerra and Saxena2017), p. 12).
These are not arguments against the use of HP filter given that we cannot observe trend output which very much depends on theory. Canova (Reference Canova2020) shows that the HP filter works better than other filters in measuring turning points and the average duration/amplitude of the business cycle expansions and contractions. It is also possible to augment the HP filter by relaxing one or more of the assumptions. Grant and Chan (Reference Grant and Chan2017) let HP cycles be serially correlated and find a good data fit. Borio et al. (Reference Borio, Disyatat and Juselius2017) update HP filter by adding financial variables such as credit growth and housing prices to the measurement equation to inform the output gap better about the financial cycle. It is also possible to mute the future dependence of the filter by limiting the available information with the one-sided version.
Although HP filter can be applied to sectoral data, with a constant
 $\lambda$
over sectors, it will impose a similar cycle/trend variability to different sectors.Footnote
4
The common
 $\lambda$
values in the literature are based on US business cycle fluctuations and imposing them on different sectors is looking at sectoral cycles from the lens of the aggregate cycle.Footnote
5
In this paper, however, I assume that each sector has its own business cycle. Unlike the HP filter, the IPP method estimates output gap of each sector separately in a model-free way. It does not impose a state-space representation as the true data generation process. It does neither define the output gap as a white noise nor assume that potential output is integrated of order
 $2$
.
Coibion et al. (Reference Coibion, Gorodnichenko and Ulate2018) discuss alternative potential output estimations, which impose long-run restrictions on output shocks to decompose the trend from cycles. Using a structural bivariate VAR model of change in real output and unemployment with their eight lags, Blanchard and Quah (Reference Blanchard and Quah1989) decompose real output shocks into the trend (with muting demand shocks) and cycles (with zero supply shock). Coibion et al. (Reference Coibion, Gorodnichenko and Ulate2018) apply this method to the post-Great Recession and observe an output gap of around 6% in early 2017. Gali (Reference Gali1999) also uses a structural bivariate VAR model of productivity and hours by identifying technology and nontechnology shocks. The restriction is that only technology shocks can change productivity growth in the long run. Coibion et al. (Reference Coibion, Gorodnichenko and Ulate2018) estimate potential output based on this method and find an output gap above 10% in 2017. Lastly, Coibion et al. (Reference Coibion, Gorodnichenko and Ulate2018) discuss Cochrane (Reference Cochrane1994)’s definition of potential output with respect to the consumption share of output. By referring to the permanent income hypothesis, Cochrane (Reference Cochrane1994) argues that any shock to actual output that leaves consumption level unchanged is a transitory shock because otherwise, consumers would change their expectations and consumption decisions. Cochrane (Reference Cochrane1994) uses a bivariate VAR model of changes in consumption and output with their two lags while using the consumption/output ratio as one of the explanatory variables. By using this method, Coibion et al. (Reference Coibion, Gorodnichenko and Ulate2018) estimate an output gap above 10% for 2017. Although these estimates point to a larger negative output gap than my estimations in the last business cycle, they do not inform policy about bottleneck and slack sectors.
Owyang et al. (Reference Owyang, Guisinger and Shell2018) discuss two advanced filters: UC and MUC. UC assumes that actual output is the sum of potential output, which follows a random walk with drift, and an AR(p) cyclical term (Owyang et al. (Reference Owyang, Guisinger and Shell2018), p. 301). MUC adds a theoretical relationship between potential output and inflation and allow inflation to affect the potential output levels. This method decomposes actual output and inflation to their trends that follow random walks with drift and cycles which show a VAR(p) structure. Owyang et al. (Reference Owyang, Guisinger and Shell2018) estimate the output gap of the US over 1950–2015 by UC and MUC models. UC model shows a persistently negative output gap until the mid-1970s and a positive output gap over 1990–2009. After the Great Recession, the output gap declines below zero and does not recover. In 2015, the UC model predicts an excess capacity reaching almost
 $\$1$
trillion (in 2009 dollars). On the other hand, the MUC model fluctuates around full capacity over 1950–1990, and after that, it shows a persistent overheating until the Great Recession. MUC output gap declines more than UC in the last business cycle and shows an excess capacity of over
 $\$1$
trillion in 2015. Although these models are also applicable to sector-level data, they impose more restrictions on potential output and trend inflation (with the random walk with drifts assumption) than my methodology.
The common feature of the parametric approaches is their strong priors about the cyclical and permanent components of output. On the other hand, there are model-free approaches in the literature that do not refer to filtering techniques or the natural rate hypothesis to estimate potential output. One such method is to use the survey data of plant capacity such as Shaikh (Reference Shaikh1987) or average workweek of capital estimations either based on the changes in the shift structure as used by Nikiforos (Reference Nikiforos2016) or actual electricity consumption over a theoretical maximum, as calculated by Foss (Reference Foss1963). The FRB publishes capacity utilization rates of manufacturing, mining, and utilities based on the SPC of the US Census Bureau to track sectoral bottlenecks and inflationary pressures (Morin and Stevens (Reference Morin and Stevens2004)). There were other capacity measures published by McGraw-Hill and BEA based on company survey data and by the Wharton school based on the peak-to-peak method applied to the Federal Reserve’s industrial production series back in the 1970s and the 1980s (Ragan (Reference Ragan1976)). Although these methods rely on independent measures of capacity, their scope is limited because they cover only manufacturing, mining, and utilities, which produce around 15% of the US value-added today. Given the absence of survey-based utilization data for services, this paper extends the peak-to-peak method to all sectors of the economy to estimate the economy-wide output gap and its sectoral distribution.
3. Sectoral estimation of the output gap
I decompose the US economy into the two-digit sectors of the North American Industry Classification System: Agriculture, mining, utilities, construction, manufacturing, wholesale trade, retail trade, transportation and warehousing, information, finance, real estate, professional services, management of companies, administrative services, education, healthcare and social assistance, arts-entertainment, food-accommodation, other services, and government. I use BEA’s chain-type quantity indexes for investment in fixed asset by industry and double-deflated real value-added by industry data over 1948–2020 to estimate each sector’s potential output and the output gap. I use annual data because investment data are not available at the quarterly frequency and the quarterly sectoral value-added data do not go back before 2005. I assume that each sector is at its potential in 1948, a peak year of GDP.
3.1 Modeling Sectoral Cycles
I define a cycle as the segment of a series that lies between two peaks. This cycle description is very similar to Burns and Mitchell (Reference Burns and Mitchell1946)’s specific cycles, which are later classified under the turning point cycles by Harding and Pagan (Reference Harding and Pagan2005). I first examine the real value-added of each sector and estimate the sectoral potential (or trend component) for each cycle.
A natural way to interpret potential output is as a ceiling for actual output that is determined by the full utilization of available resources. Okun (Reference Okun1963)’s conceptualization and estimation of potential output fit this definition. With his plucking model, Friedman (Reference Friedman1964) also adopts the ceiling approach and defines business cycles as temporary downward deviations from the peak output level.Footnote 6 This is in stark contrast with defining potential output as an average of booms and busts that is implied by the natural rate hypothesisFootnote 7 and statistical filters that assume symmetric cycles around trends. With the ceiling approach, stabilization policy can increase the average growth rate and bring welfare gains by reducing asymmetric business cycle fluctuations (Dupraz et al. (Reference Dupraz, Nakamura and Steinsson2019)).
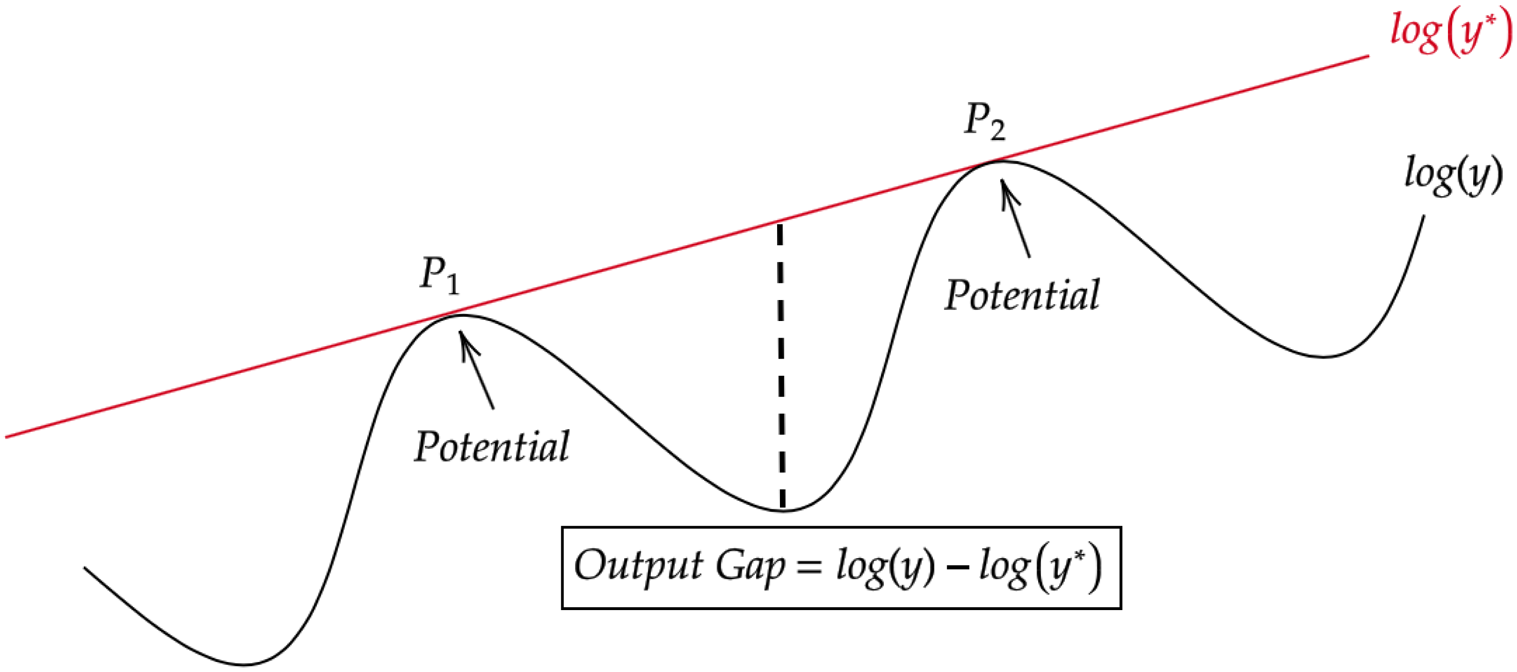
The ceiling approach can be modeled in a nonparametric way by the peak-to-peak method, which defines peaks of output series as the potential output, and linearly interpolates it to the years between peaks and linearly extrapolates to the years after the last peak. This method assumes that the ceiling is constrained by the local maxima of the output series. The growth rate of potential is cycle-specific and is updated once a cycle is completed; however, the changes to potential growth are not sharp as one would expect from slow-moving supply side constraints. Figure 2 shows how this method works for an arbitrary sector where
 $y$
is the real value-added of the sector and
 $y^*$
is the estimated potential output. Output gap becomes the output series
 $\textrm{log}(y)$
less the permanent component
 $\textrm{log}(y^*)$
, which is generally a deflationary gap (Kim and Nelson (Reference Kim and Nelson1999), p. 318).
An illustration of the peak-to-peak method.
Peak-to-peak works well for cyclical sectors such as construction, manufacturing, retail trade, transportation, arts-entertainment, and food-accommodation, which make regular peaks in line with the business cycle fluctuations. However, it creates unreliable output gaps for less cyclical sectors (information, administrative services, healthcare, government, and education), which have produced more of the US value-added in recent decades. For example, the value-added of information, administrative services, and education reached their first peaks in the 1970s or the early 1980s. Peak-to-peak gives unrealistic output gaps for these sectors over more than 30 years. The problem with the government is even more prominent when peak-to-peak is directly applied to value-added. The government had only one peak in 2010, and until then, peak-to-peak gives persistent overheating, which does not make economic sense.
In addition to its practical shortcoming, peak-to-peak method creates a policy-related problem that comes from how it defines the potential. Potential output is unobservable and its definition depends on how one sets policy objectives. Currently, inflation-targeting central banks define potential output as the maximum non-inflationary level of output. Peak-to-peak method, on the other hand, only uses the local maxima of a series in measuring potential, therefore its estimates do not give information about whether the estimated potential is compatible with price stability.
The limitation of the peak-to-peak is also related to its model-free nature. In the absence of new peaks, there is no information that can be utilized to update the deterministic potential output growth rate. There are two possible solutions to this problem. The first approach is to define a stochastic growth rate to potential output. Grant and Chan (Reference Grant and Chan2017) add a stochastic trend growth to an UC model that can capture the variation in the trend. Similarly, Kim and Nelson (Reference Kim and Nelson1999)’s plucking model contains a stochastic trend growth that allows them to model productivity slowdown in the postwar US. Guérin et al. (Reference Guérin, Maurin and Mohr2015) model regime-dependent potential output growth in a Markov-switching framework for the Euro Area. The second approach, which is a direct extension of the model-free method of the paper, is decomposing sectoral output data more to look for the source of cyclical movements. Since the output is an aggregate measure that includes final private consumption, private investment expenditures, government expenditures, and net exports, it is possible that the cyclical component is dominated by less volatile parts, which result in missing peaks for some sectors.
Figure 3 decomposes GDP into final uses with all expenditures equal to 100 in the first quarter of 1947.Footnote 8 Investment is by far the most cyclical component of GDP with sharp declines during recessions which start before NBER recessions and last longer. Consumption and government expenditures have longer cycles and little variation around their long-run trends. Hodrick and Prescott (Reference Hodrick and Prescott1997) also confirm this: “Cyclical consumption varies only one-half and investment three times as much as does cyclical output” (Hodrick and Prescott (Reference Hodrick and Prescott1997), p. 2). It is as if business cycle fluctuations are driven by private investment cycles.Footnote 9
Real final expenditures over Q1 1947–Q4 2020 in index values.

Investment cycles also give better information about price pressures compared to peak-to-peak. The economic rationale comes from the fact that firms invest more in fixed assets (equipment, structure, and intellectual property products) when they operate near or above their potential. An increase in investment expenditures is a sign of overheating in a firm, pushing production costs up due to overtime payments, bottlenecks in input markets, and rising overheads (Blecker and Setterfield (Reference Blecker and Setterfield2019), p. 160). Therefore, output gap estimations based on investment cycles will be signaling sectoral bottlenecks and economy-wide inflationary pressures better than peak-to-peak. As more firms in a sector face capacity constraints, sectoral investment expenditures will rise and make a peak at what I define as sectoral potential.Footnote 10
I take the value-added of the sector in peak years of investment expenditures as its potential output and linearly interpolate it to other years in the investment cycle by assuming a constant growth rate between any two peaks. For the years after the last peak, I linearly extrapolate the last calculated trend.Footnote 11 I name this method as IPP. Note that I am not replacing output gaps with investment gaps, that is, actual investment expenditures over their trends. I am still decomposing the output into trend and cycle, but taking peak years from investment cycles instead of output cycles.Footnote 12
IPP method gives more reliable output gaps than peak-to-peak because investment expenditures are cyclical even for the sectors with less cyclical output. In Figure 4, I describe how this method applies to manufacturing and government in comparison to peak-to-peak estimates. For manufacturing, the two methods give similar output gaps (though not identical because investment and value-added cycles do not coincide). IPP signals the overheating of the 1970s and the late 1980s better than peak-to-peak. However, for the government, there is a significant difference between them. Peak-to-peak gives a continuous overheating, lasting more than 60 years, while the IPP output gap fluctuates within a narrow band around
 $0$
over 1948–2020.
Potential outputs (on the left panel) and output gaps (on the right panel) of manufacturing and government by the peak-to-peak and investment peak-to-peak (IPP) methods over 1948–2020.

3.2 Aggregate Output Gaps Over 1948–2020
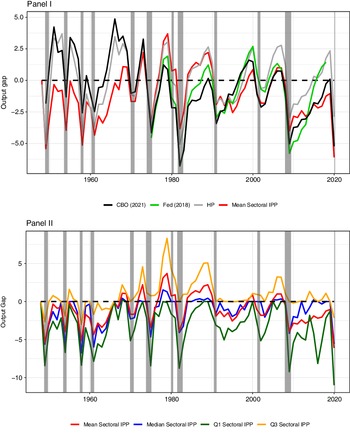
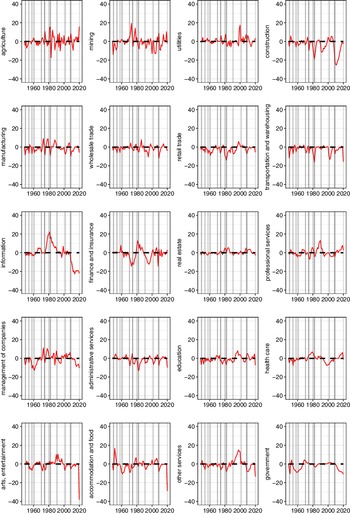
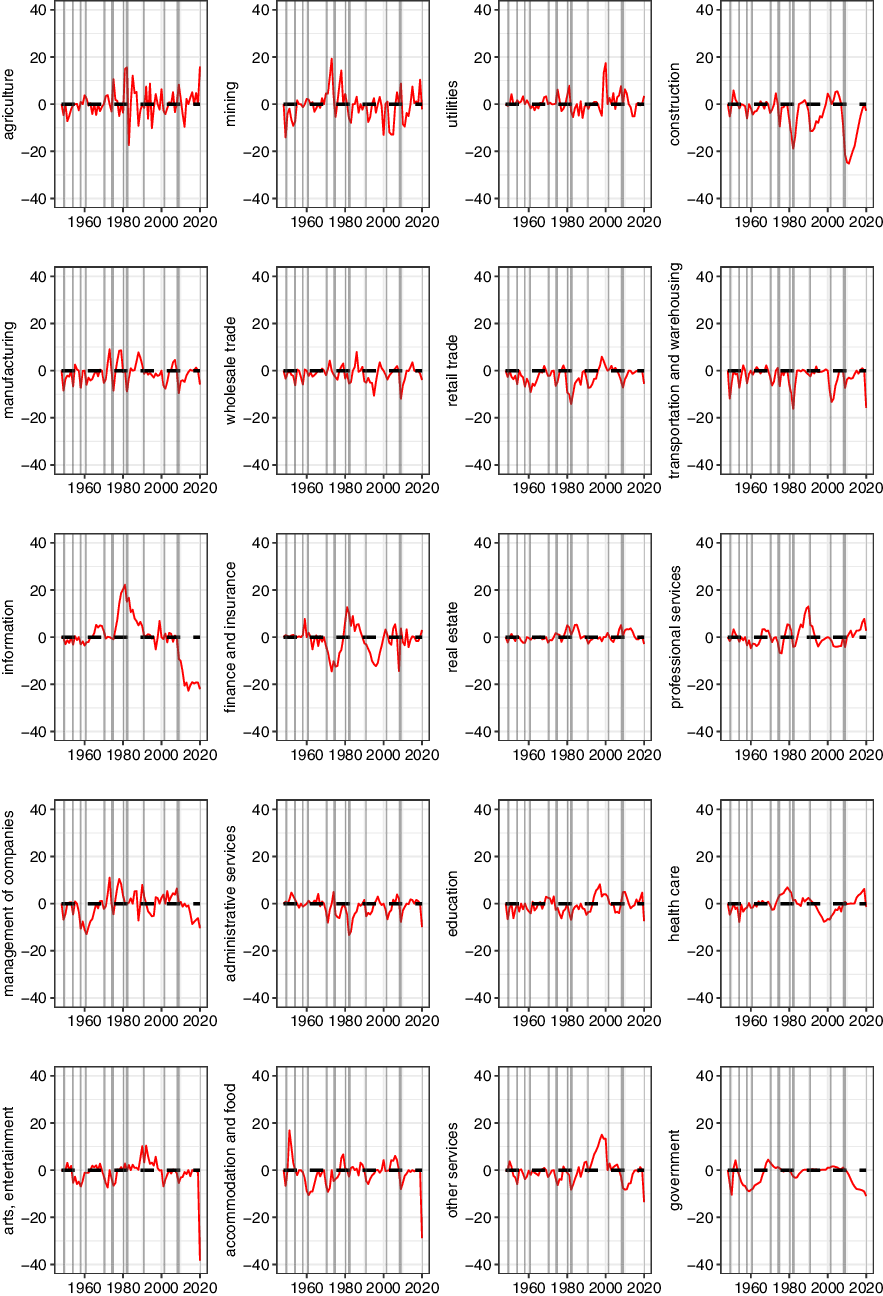
After I estimate output gaps of 20 sectors over 1948–2020, which are in Appendix A, I weight them by each sector’s value-added share and get the aggregate output gap as the weighted mean of sectoral output gaps. I compare the weighted mean IPP to CBO (2021), HP-filtered series (with the smoothing parameter
 $\lambda =100$
),Footnote
13
and Fed’s Greenbook estimates (available from 1975 to 2018 with a three-year lag) in Figure 5 Panel I.
Output gaps estimated by the weighted mean and quartiles of IPP, CBO, Fed’s Greenbook estimates, and the HP filter over 1948–2020.
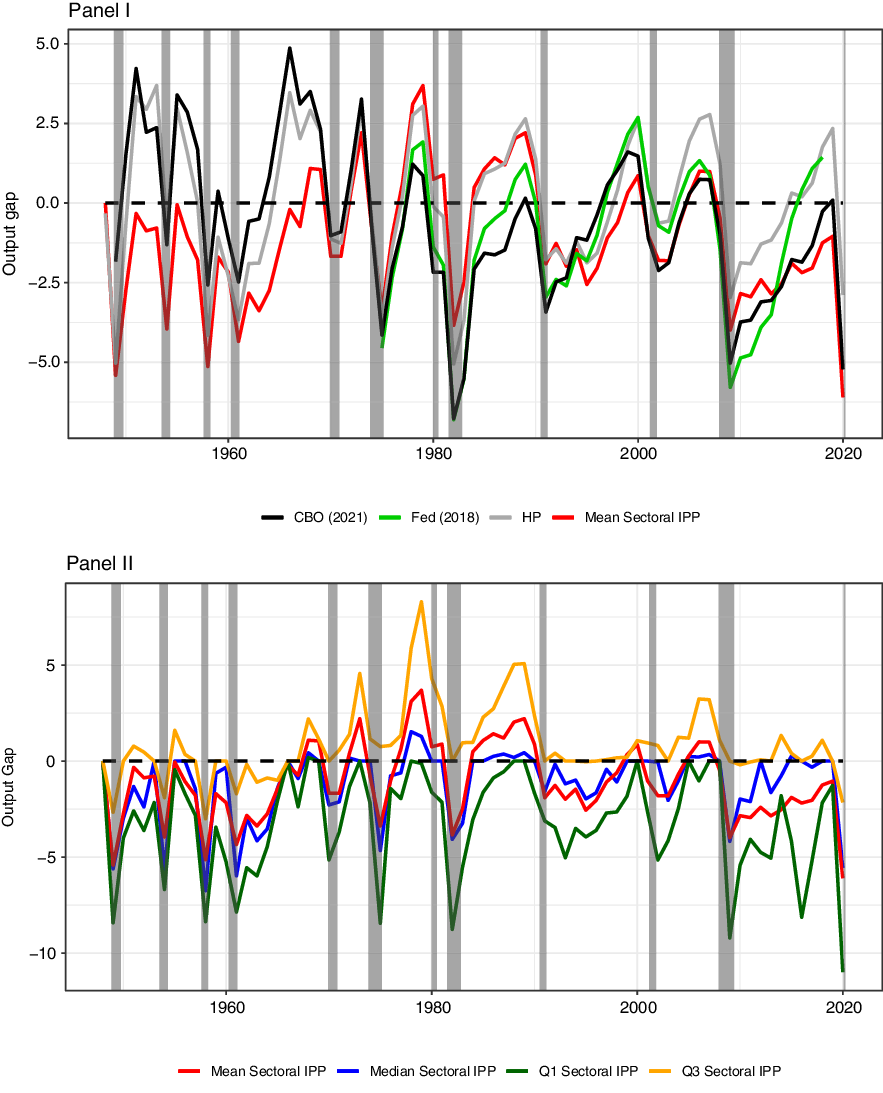
The weighted mean IPP estimates output gaps lower than other methods before 1970. This is mainly related to high productivity growth in the early post-war years. This finding is in line with the inflation trend, which is shown in Appendix B with IPP output gaps. In particular, core PCE inflation was below the long-run target rate of 2% from 1960 to 1965 for when my method estimates negative output gaps, not only on average but also at sectoral levels. The strong demand of the 1970s together with the decline in productivity (and negative supply shocks) creates an upward trend in the mean IPP, which makes a peak in the late 1970s, and thereafter shows a decades-long decline. It signals the overheating in the 1970s better than CBO and the Fed by following a similar path to the HP filter.Footnote 14
On the other hand, unlike the HP filter, the mean IPP generally estimates negative output gaps since 1990, except for the peak years of business cycles, therefore capturing chronic demand-side problems of recent decades. During the 1991−2001 recovery, a period of rapid technological progress, the mean IPP is lower than the other three output gaps. In the last business cycle, it shows a sluggish and incomplete recovery, which is in line with secular stagnation concerns. Slow and incomplete recoveries post-1990 are also defined as jobless recoveries because output quickly catches its trend after recessions (based on traditional approaches), but unemployment remains high compared to its pre-recession levels (see Calvo et al. (Reference Calvo, Coricelli and Ottonello2012)). I argue that output did not recover quickly after the 1991 and 2009 recessions as suggested by CBO and the HP filter.
The weighted mean is only one measure for the aggregate output gap, and it hides the details about the distribution that can be vital for policy purposes. A major advantage of the sectoral approach is the information it provides about the distribution of output gap over sectors. In Figure 5 Panel II, I plot the weighted quartiles of the distribution to explore the policy implications of my estimates. Weighted Q1 represents slack sectors, and weighted Q3 is a proxy for bottleneck sectors.
Median and mean IPP generally move together; however, the median stays closer to full capacity than the mean in the overheating periods. This finding suggests that the distribution of the output gap is positively skewed during strong expansions, and the magnitude of overheating in bottleneck sectors pushes the mean up. Q3 IPP shows sharp ups during expansions (except the 1991−2001 and 2009−2019 recoveries), thus supporting this claim. Also, Q3 IPP tracks inflation trends closely, such as the double peaks of the 1970s and stability since 1990. Q1 IPP, on the other hand, shows the depth of recessions and slow recoveries post-1980, hidden in the mean estimates. Policymakers can, therefore, use Q3 IPP for predicting inflation and track Q1 IPP for measuring the spare capacity in the economy.
4. Policy Implications
Relying on the weighted mean estimates for predicting inflation and measuring economic slack will misinform policy because it requires the output gap distribution to be uniform over sectors. Although this is not the case, as Figure 5 Panel II clearly shows, the weighted mean will still work as long as it is correlated strongly with the output gaps of bottleneck and slack sectors. Until 1990, the weighted mean output gap correctly signaled Q3 and Q1 IPP; however, the harmony between the series broke down after that. A good example is the 1990-2001 cycle when Q3 IPP stayed constant at
 $0$
, and the mean and Q1 IPP showed U-shaped long recoveries. A similar pattern can be observed in the last business cycle where Q1 and mean IPP followed L-shaped incomplete recoveries (reminding secular stagnation), and Q3 IPP remained stable at full capacity (similar to inflation). The lower correlation between bottleneck and slack sectors of the economy since 1990 invites policy tools targeting inflation and economic slack separately. My findings suggest that it is possible to predict inflation by the Q3 IPP output gap and combat secular stagnation by eliminating the Q1 IPP output gap, as I discuss in detail in Subsections 4.1 and 4.2, respectively.
4.1. Phillips Curve Estimations
The output gap is an important policy variable for inflation-targeting central banks in predicting future inflation. However, in recent decades, the relation between inflation and unemployment has weakened, which raised questions about the policy value of economic slack measures. The sharp rise in unemployment during the Great Recession did not create deflation as predicted by the accelerationist theory. Similarly, the record low unemployment rates of recent years did not bring accelerating inflation. In his 2019 testimony, Fed chair Powell said, “The relationship between the slack in the economy or unemployment and inflation was a strong one 50 years ago … and has gone away” (Li (Reference Li2019)).
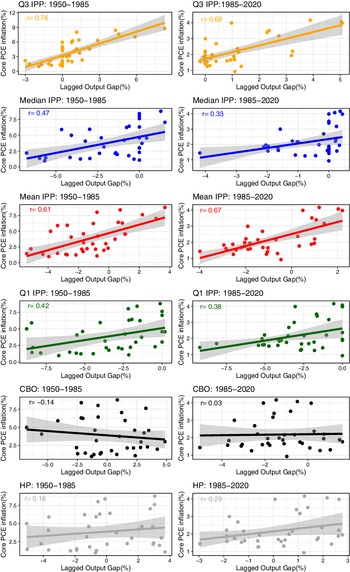
I argue that the output gap still signals inflation, however, headline output gap estimations do not measure economic slack correctly. I estimate Phillips curves over 1950–2020 with six different output gaps (Mean IPP, Median IPP, Q1 IPP, Q3 IPP, CBO, and the HP filter). I divide the sample at 1985 because inflation has remained stable and the slope of the Phillips curves declined significantly since then (see Blanchard et al. (Reference Blanchard, Cerutti and Summers2015)). I first plot scatter plots with core PCE inflation rates on the vertical axis and lagged output gaps on the horizontal axis.
Scatter plots in Figure 6 show that the correlation between inflation and CBO output gap is negative over 1950–1985, and it is almost zero over 1985–2020. The correlation is also very weak for the HP filter over both periods. Among IPP output gaps, the correlation with inflation is weak for Q1 and median; however, it is quite strong for mean and Q3. In particular, Q3 IPP output gap alone explains half of the variation in inflation in both periods.
Then, I estimate the following anchored expectations Phillips curve:
 \begin{equation} \pi _t=\alpha +\beta\! \left(y_{t-1}-y_{t-1}^*\right)+u_t, \end{equation}
where
 $\pi _t$
is the core PCE inflation,
 $\alpha$
is the target inflation rate,
 $(y_{t-1}-y_{t-1}^*)$
is the output gap, and
 $u_t$
is an independent and identically distributed disturbance term. Blanchard (Reference Blanchard2016) argues in favor of the level to level specification post-1990, and Ball and Mazumder (Reference Ball and Mazumder2019) find a strong fit with anchored expectations (and short-term unemployment gap) since 1985.
Tables 1 and 2 show linear regression results with robust standard errors for the 1950–1985 and 1985–2020 periods, respectively. Slope coefficients of the mean and Q3 IPP are statistically significant at 1% over both periods, but they decline from the
 $(0.7-0.8)$
band over 1950–1985 to around
 $0.4$
after 1985.
 $R^2$
values do not decline much after 1985, even with a slight increase in the
 $R^2$
of mean IPP. Slopes of the Phillips curves with CBO and HP-filtered output gaps are not significant in any period. With the median and Q1 IPP, slope coefficients become insignificant post-1985.
Phillips curves over 1950–1985 and 1985–2020 with six output gap measures.

I also estimate expectations-augmented Phillips curves in Appendix C with Friedman (Reference Friedman1968)’s adaptive expectations over 1950–1985, and with 10-year inflation forecasts of the Survey of Professional Forecasters over 1985–2020, following Ball and Mazumder (Reference Ball and Mazumder2019). With the inclusion of expectations, the fit of the Phillips curves improves substantially for all output gaps. Only Q3 IPP stays significant over both periods, and its slope coefficient declines slightly from
 $0.26$
to
 $0.2$
.
The decline in the slope of the Phillips curve after the mid-1980s is in line with the literature (Blanchard (Reference Blanchard2016)); however, it does not indicate a weaker relation between economic activity and inflation compared to pre-1985. Q3 IPP, in particular, signals inflation strongly throughout the whole period. This evidence suggests that policymakers can keep an eye on Q3 IPP to control inflationary pressures.
However, why does Q3 IPP give more information about inflation than other measures, particularly the weighted mean, which is supposed to capture aggregate demand shocks? The answer can be found in the price-setting behavior of firms and downward nominal wage rigidity. When firms operate below their potential, they are likely to respond to a negative demand shock by lowering production and investment rather than lowering prices.Footnote 15 Therefore, slack sectors (Q1 IPP) are not likely to exert strong downward pressures on aggregate prices.Footnote 16 Similarly, firms with excess capacity will increase production faster than prices as a result of a positive demand shock until they reach their potential. The low correlation between Q1 IPP and inflation, therefore, is an expected result.
When firms face capacity constraints, they are likely to respond to a positive demand shock by increasing prices faster than production and investment. The strong demand over the 1960s and 1970s pushed the bottleneck sectors to bid up wages and input prices, therefore rising inflation. A decline in the Q3 IPP output gap below zero for a sustained period of time, on the other hand, would indicate deflationary pressure. The high correlation between Q3 IPP and inflation fits this framework. Since the weighted mean takes both slack and bottleneck sectors into account, it is expected to signal inflation better than Q1 IPP and worse than the Q3 IPP output gap.
Phillips curves with core PCE and six output gap measures over 1950−1985

Note: Standard errors are robust (Newey-West)
 $^{*}p \lt 0.1$
;
 $^{**}p \lt 0.05$
;
 $^{***}p \lt 0.01$
.
Phillips curves with core PCE and six output gap measures over 1985−2020
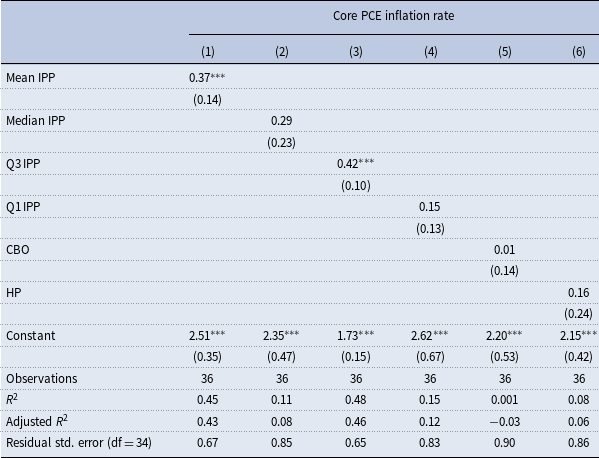
Note: Standard errors are robust (Newey-West)
 $^{*}p \lt 0.1$
;
 $^{**}p \lt 0.05$
;
 $^{***}p \lt 0.01$
.
This framework also helps explain why the sharp decline in the mean and Q1 IPP during the Great Recession did not push the economy into a deflationary spiral. As Figure 5 Panel II shows, Q3 IPP did not decline substantially below
 $0$
. Similarly, the recovery afterward did not generate severe inflation because Q3 IPP did not move up persistently, as it did during recoveries over 1970–1990, while many other sectors were suffering from insufficient demand, and the economic growth was unsatisfactory.
4.2. Secular Stagnation
The slow recovery of the US economy from the Great Recession created concerns about a secular decline in the US economy’s production capacity. Summers (Reference Summers2014) argues that US growth is in a long-term decline by referring to the secular stagnation concept of Hansen (Reference Hansen1939), who initially used it to describe the slow growth of the post-Great Depression years. Summers (Reference Summers2015) explains the US economy’s unsatisfactory recovery from the Great Recession by the excess savings over investment, which pushes the equilibrium interest rate below zero. Given the zero lower bound on the nominal interest rates, the adjustment occurs through a continuous decline in output, which leads to secular stagnation. Summers (Reference Summers2015) mentions the rise in profit share, fall in the price of investment goods, and globalization as possible reasons behind the savings glut.
Gordon (Reference Gordon2015), on the other hand, points to productivity slowdown as the reason behind supply-side secular stagnation. He argues that potential output grew even slower than the actual output in the last recovery, thus eliminating the output gap. From a distributional perspective, Kiefer et al. (Reference Kiefer, Mendieta-Muñoz, Rada and von Arnim2020) also discuss a decline in potential output growth post-2000. Eichengreen (Reference Eichengreen2014), however, does not give credit to the technological slowdown argument. Instead, he mentions the need for demand-boosting policies and investment in infrastructure, training, and education.
My findings point to decades-long incorrect macroeconomic policies behind secular stagnation, which did not stabilize the output at its potential. The conventional approach assumes that there exists a natural rate of unemployment, compatible with stable inflation, and policy should target keeping unemployment at that level. Apparently, this approach has failed in the last business cycle as historically low unemployment rates of recent years did not generate inflation, let alone accelerating inflation. The Fed chair Powell said in the same testimony, “We are learning that the neutral interest rate is lower than we had thought and … the natural rate of unemployment rate is lower than we thought” (Li (Reference Li2019)).
The Fed chair admits that macroeconomic policy could have generated more output and jobs without triggering inflation in the last business cycle. The IPP measures show that this has been the case since 1990 when the output gap of bottleneck sectors remained constant, and a substantial excess capacity existed in slack sectors. Unlike the headline measures, there was an aggregate slack of around 1% in 2019, the last peak of the business cycle. According to the IPP estimates, wholesale trade, information, management of companies, arts-entertainment, and government were below their potential in 2019.
The negative Q1 IPP output gap opens room for short-run demand supporting policies targeting the slack sectors. Giving more weight to eliminating the Q1 IPP output gap in policy settings could (and still can) increase the average growth rate and avoid secular stagnation. As Eichengreen (Reference Eichengreen2014) says, “if the US does experience secular stagnation over the next decade or two, it will be self-inflicted” (Eichengreen (Reference Eichengreen2014), p. 41).
5. Conclusion
In this paper, I develop a sectoral approach to the potential output estimation of 20 US sectors by the IPP method. I define potential output as the output at the peak years of sectoral investment cycles. For the years between peaks, I interpolate the potential by assuming a constant growth rate. For the years after the last peak, I extrapolate the linear trend coming from the last two peaks. The IPP method differs from existing methods in its reliance on sectoral output measures. I calculate the aggregate output gap first as a weighted mean of sectoral output gaps, which signals inflationary 1970s and chronic demand deficiency post-1990 better than CBO, the HP filter, and Fed’s Greenbook forecasts. The weighted quartiles of the distribution give more detailed information about bottleneck and slack sectors of the economy. The bottleneck sectors’ output gap correctly signals core PCE inflation over 1950–2020. Slack sectors show the depth of recessions and the painful recoveries in recent decades, which take first a U and then an L shape.
The weighted Q3 and mean IPP explain more than half of the variation in core PCE inflation with an anchored expectations specification of the Phillips curve. The decline in the slope of the Phillips curves post-1985 opens a larger room for demand supporting policies that are needed for combating secular stagnation. Policymakers can target the sectors with negative output gaps in designing short-run stabilization policies. Sector-level stabilization policies can bring the economy into its potential output while keeping inflation under control.
Signaling bottleneck and slack sectors of the economy separately and suggesting sector-level demand supporting policies to combat secular stagnation are particular strengths of the IPP method. However, two areas require further research to improve the IPP method. First, the model uses annual data because sectoral investment expenditures are available at the annual frequency. Using quarterly data, on the other hand, will increase the policy value of the estimates and inflation predictions. Second, I assume that each sector has its independent cycle; however, there may be cross-sectoral spillovers. For example, channeled demand to slack sectors might leak to bottleneck sectors and create inflationary pressures. Modeling sectoral cycles with a multivariate method that takes sectoral spillovers into account is part of my future research agenda.
Appendix A
Output gaps of 20 US sectors over 1948–2020.
Appendix B
Weighted mean and Q3 IPP output gaps together with core PCE gap (Core PCE inflation rate minus the long-run target rate of 2 percent) over 1948–2020.

Appendix C
Phillips curves with adaptive expectations over 1950–1985

Note: Standard errors are robust (Newey-West)
 $^{*}p \lt 0.1$
;
 $^{**}p \lt 0.05$
;
 $^{***}p \lt 0.01$
.
Phillips curves with Survey of Professional Forecasters’ inflation expectations over 1985–2020

Note: Standard errors are robust (Newey-West)
 $^{*}p \lt 0.1$
;
 $^{**}p \lt 0.05$
;
 $^{***}p \lt 0.01$
.