Introduction
The Argentine ant, Linepithema humile (Mayr) (Hymenoptera: Formicidae), is a global invasive species and is one of the most studied species in the world (Sanders & Suarez, Reference Sanders, Suarez and Richardson2011). Carbohydrates from hemipteran honeydew and extrafloral nectar are an important part of its diet and are a great driver of its invasive abilities (Lach, Reference Lach2003, Reference Lach2005, Reference Lach2007; Tillberg et al., Reference Tillberg, Holway, LeBrun and Suarez2007). For many decades considerable attention has been devoted to research on nectar feeding behavior, the distribution of sugar solutions within the colony and recruitment triggered by sugar baits (Heller et al., Reference Heller, Ingram and Gordon2008; Silverman & Brightwell, Reference Silverman and Brightwell2008; Nyamukondiwa & Addison, Reference Nyamukondiwa and Addison2014). Consequently liquid sugar baits have proven to be highly effective for control of L. humile (Boser et al., Reference Boser, Hanna, Faulkners, Cory, Randall and Morrison2014; Buczkowski et al., Reference Buczkowski, Roper, Chin, Mothapo and Wossler2014; Rust et al., Reference Rust, Soeprono, Wright, Greenberg, Choe, BVoser, Cory and Hanna2015).
In most eusocial insects, foraging tasks are performed by subsets of workers. Even in species with massive or group foraging, the coordination of such behavior is based on decisions made by each individual and on the communication between nestmates. These decisions are affected by the nutritional requirements of the colony and the quality of the food source (Cassill & Tschinkel, Reference Cassill and Tschinkel1999; Josens & Roces, Reference Josens and Roces2000; Cassill, Reference Cassill2003; Detrain & Deneubourg, Reference Detrain and Deneubourg2008; Dussutour & Simpson, Reference Dussutour and Simpson2008; Falibene & Josens, Reference Falibene and Josens2008). For nectivorous ants, sugar concentration affects feeding behavior; e.g. nectar acceptance, feeding time and volume ingested (Josens et al., Reference Josens, Farina and Roces1998; Schilman & Roces, Reference Schilman and Roces2006; Dussutour & Simpson, Reference Dussutour and Simpson2008). Furthermore, ingestion dynamics (i.e. intake rate) is affected by the physical properties of the nectar, particularly nectar viscosity (Josens et al., Reference Josens, Farina and Roces1998; Paul & Roces, Reference Paul and Roces2003), as well as by insect morphometry (Kingsolver & Daniel, Reference Kingsolver and Daniel1979; Heyneman, Reference Heyneman1983; Roubik & Buchmann, Reference Roubik and Buchmann1984; Harder, Reference Harder1986; Josens & Farina, Reference Josens and Farina2001). When leaving the nectar source, foragers also decide whether to recruit other nestmates or not (De Biseau & Pasteels, Reference De Biseau and Pasteels1994; Detrain & Deneubourg, Reference Detrain and Deneubourg2008). One of the main recruitment mechanisms is by trophallaxis, whereby a donor ant regurgitates the ingested solution which is offered as a drop between her mandibles from where one or more nestmates (the receiver ants) can drink.
Trophallaxis and recruitment are considered to be the link between individual behavior and group organization (Wilson, Reference Wilson1971; Breed et al., Reference Breed, Bowden, Garry and Weicker1996; Farina, Reference Farina1996; Mailleux et al., Reference Mailleux, Deneubourg and Detrain2000; Gordon, Reference Gordon2007; Hölldobler & Wilson, Reference Hölldobler and Wilson2008). This is because trophallaxis does not just serve as a means of food distribution; it also allows worker ants to acquire information, particularly for recruitment (McCabe et al., Reference McCabe, Farina and Josens2006; Provecho & Josens, Reference Provecho and Josens2009). In addition, other communicational channels could be involved in recruitment depending on the species. For example, different motor displays were described for specific species as fast walking or head waggle, which are modulated by the scout based on food quality for Solenopsis invicta (Cassill, Reference Cassill2003).
Although feeding behavior has already been studied in small colonies or ant groups in L. humile for different sucrose concentrations (Baker et al., Reference Baker, Key and Gaston1985; Silverman & Roulston, Reference Silverman and Roulston2001; Silverman & Brightwell, Reference Silverman and Brightwell2008), there is no information available on decision-making in individual workers for this species. Here we provide the first quantitative analysis of the how sucrose concentrations affect individual feeding dynamics, behavior, and post-feeding interactions among nestmates of L. humile.
Materials and methods
Laboratory conditions
Experiments were performed using four L. humile colonies that had been collected from their native range in Argentina at the Campus of the University of Buenos Aires (34°32″48.3′S; 58°26″21.0′W). Each colony was estimated to contain about 4000–5000 workers. The colonies were housed in our laboratory for at least 2 months prior to conducting the experiments.
Colonies were kept in artificial nests that consisted of large plastic boxes (30 × 50 × 30 cm3) with the sides painted with fluon to prevent the ants from escaping. The colonies were maintained in a temperature-controlled environment (25 ± 3°C) under a natural light-dark cycle. Ants were fed daily with honey–water and three times a week with fresh cockroaches (Blaptica dubia) or tinned meat. Water was provided ad libitum. For all experiments, the trials were performed over many days to achieve the required number of replication. Prior to conducting trials the colonies were subjected to a carbohydrate starvation period of 72–96 h. This period of starvation maintained a constantly high motivation for feeding during the trials. Colonies used in assays were given normal diets for at least 5 days before they were used again.
Individual feeding behavior
For each trial, one ant at a time was gently placed on a bridge (2 × 50 mm2) that ended in a feeding arena containing a drop (10 µl) of sucrose solution. This volume constituted an ad libitum source for this species as their crop load is between 0.1 and 0.5 µl (preliminary estimations). Ants were offered one of seven different sucrose concentrations: 5, 10, 20, 30, 40, 60 and 70% w/w. To avoid bias, we haphazardly chose the order of sucrose solutions used, and individual ants were only used once. We measured individual crop load volume by filming the ants from a lateral view whilst they were drinking using a camera-fitted stereomicroscope (Leica MZ8 – 25× magnification – with a Leica ICA camera). The amount of solution ingested was estimated as the difference in gaster volume before and after feeding (Mailleux et al., Reference Mailleux, Deneubourg and Detrain2000) which was calculated from the maximal length and height of the gaster before and after feeding. The width of the abdomen could not be seen on these lateral images. In order to estimate the relationship between this axis and the height in the lateral view, we performed preliminary measurements on 40 ants fed in similar conditions but filmed laterally and from above. We found that the relationship between width:height was 1.0:1.1 for both empty and filled gasters. We therefore approximated the abdomen to be an ellipsoid in order to calculate the volume of the gaster of each forager before (V i, initial volume) and after (V f, final volume) drinking. The volume of solution ingested (μl) was calculated as the difference between initial and final volumes (V = V f−V i). Feeding time (s) was also obtained from the videos and was defined as the time during which the ant's mandibles were in contact with the solution. A total of 271 ants were recorded feeding on the sucrose solutions (N 5 = 35; N 10 = 48; N 20 = 35; N 30 = 55; N 40 = 35; N 60 = 35, N 70 = 28).
Due to an unfortunate technical issue with the first set of recordings, of the 271 ants that ingested the sucrose solution we were only able to obtain uninterrupted video recordings for 164 individuals to measure feeding time. We compared these values among sucrose concentrations (N 5 = 20, N 10 = 20, N 20 = 20, N 30 = 36, N 40 = 20, N 60 = 20, N 70 = 28). From the volumes ingested and feeding durations we calculated intake rates (nl s−1) for individual ants and compared values among concentrations.
Trophallaxis and other social interactions
This experiment aimed to compare the post-feeding interactions between a donor and a group of receivers for four different sucrose concentrations: 5, 20, 40 and 60% w/w. For each trial, a group of ten ants was separated from one of the colonies and placed in a flask (diameter, 4.5 cm; height, 2 cm) that had plaster of paris on the floor and the inner sides coated with fluon. After an acclimation time of no <15 min, we removed one ant, the ‘donor ant’. This ant was allowed to climb onto a feeding arena (similar to the one describe in the previous experiment) to feed on one of the four sucrose solutions. When the ant stopped feeding for 10 s, we put a toothpick close to the ant for it to climb onto and we returned this ant to the flask. From this moment, the flask was filmed from above with a digital camera (Sony Handycam HDR-SR11) for 300 s. We chose this timeframe based on our observations in preliminary trials.
Once returned to the flask, donors immediately walked actively. Generally, after a short time, the donor ant would stop walking and expose a drop of regurgitated solution which other ants would ingest by trophallaxis.
The proportion of trophallaxis was calculated as the number of donor ants that offered their crop load within 300 s after being placed in the flask out of the total number of ants that accepted the solution offered (N 5 = 40; N 20 = 40; N 40 = 31; N 60 = 40).
Drop exposure latency was the time that each donor ant took to offer a small drop of the ingested solution to the nestmates. This behavior invariably led to trophallaxis between the donor ant and the receiver ants. The proportion of receivers was the number of ants that performed trophallaxis with the donor out of the nine ants present in the flask during the recording time. Delivery duration was measured as the uninterrupted time that the donor spent with at least a receiver in a delivery event of trophallaxis regardless of how many receivers were involved. During the 300 s of recording only one delivery event took place per donor ant. This event could involve one or several receivers.
We characterized and quantified the donor behavior from the moment the ant was returned to the flask until 30 s or drop exposure, whichever occurred first. We calculated Walking Activity as the number of times the ant crossed a line in a square grid dividing the arena, either until drop exposure latency or until 30 s within the arena. The 4 × 4 grid used was drawn on transparent acetate and placed on the monitor while playing the video (the side of each square of the grid represented 1.1 cm on the arena). We distinguished three behaviors performed by the donor ant; two of them necessarily involved a partner: Head Contacts and Head Jerking, whereas the other was performed by the donor alone: Gaster Waggle. These behaviors could occur in the recording period even if food offering did not.
Head Contacts were counted when the donor ant touched another ant's head; these recordings included any kind of contact (i.e. mandibular, antennal, etc.). Head Jerking occurred when the donor ant performed vigorous longitudinal jerking movements during head contacts. Therefore, Head Jerking is a subset of head contacts. Gaster waggle was a side-to-side movement of the donor ant's gaster that was sometimes performed before trophallaxis while the ant walked.
We calculated the proportion of the donor ants that performed each of these three behaviors from the total donor ants. Head contact and Head jerking instances were counted as discrete events and then divided by the time of the active period (i.e. time the ant remained in motion) to present them as rates (number of events per time unit). Gaster waggle was presented as an index (gaster waggle index) which was the time during which the ant moved her gaster relative to the time of the active period.
Statistical analyses
Feeding variables were analyzed using one-way ANOVA or Kruskal–Wallis (K–W) tests when normality assumptions were not met. In cases of significant differences, post hoc Tukey's for pairwise multiple comparisons (ANOVA), or two-tailed post hoc comparisons of mean ranks (K–W), were applied. Feeding time was fitted to a liner regression. Proportions for different solutions were compared using G-tests with corrected alpha when performing pairwise comparisons. ANOVA values were calculated for regression curves.
Results
Individual feeding behavior
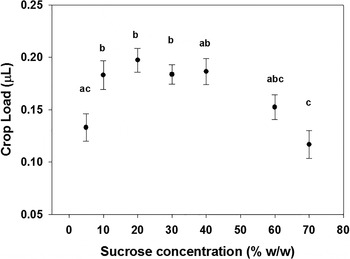
Feeding behavior varied among the solution concentrations. Mean crop load had a unimodal relationship with sucrose concentration, being lowest (0.11 and 0.13 µl) at the highest and lowest sucrose concentrations respectively, and highest (0.20 µl) at 20% sucrose concentration, with this variation differing significantly (ANOVA: F 6,264 = 5.51, P < 0.0001. fig. 1). The highest volume values recorded were about 0.39 µl, for 10 and 20% solutions, close to our maximum crop load observed for this species (data not shown).
Crop load (μl, mean ± SE) as a function of sucrose concentration for foraging ants collecting at an ad libitum source. Points with different letters differ significantly (Tukey, P < 0.05). N total = 271.

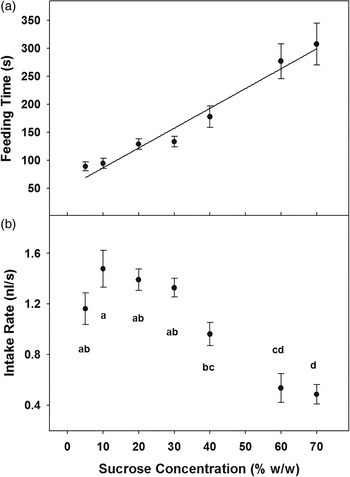
Feeding time increased linearly and significantly with increasing sucrose concentration (regression ANOVA; F 1,162 = 94.31, P < 0.0001. fig. 2a). Mean feeding time on the highest concentrate solution was 308 s (mean), with a maximum value of 934 s.
(a) Feeding time (s, mean ± SE) increased lineally with sucrose concentration (y = 51.5 + 3.5x) and (b) Intake rate (nl s−1, mean ± SE) decrease with sucrose concentration. Points with different letters differ significantly (Tukey, P < 0.05). N total = 164.

Feeding dynamics was also affected by the concentration of the solution ingested. Intake rate decreased with increasing sugar concentration with rates for concentrations of 40% or higher being significantly different than rates for concentrations of 30% or less (ANOVA: F 6,157 = 16.77, P < 0.0001). The highest intake rate was 0.09 µl min−1, being for 10% w/w, and the lowest rate was 0.029 µl min−1, being for 70% w/w.
Trophallaxis and other social interactions
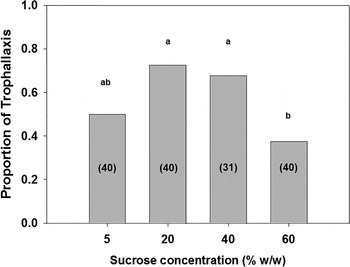
Of the 151 donor ants that ingested the solution only 85 offered a regurgitated drop. Of these 85, in 84 cases a receiver ant approached and drank from this drop (i.e. trophallaxis was established) within 300 s. Ants that had ingested intermediate sucrose concentrations of 20 and 40% were significantly more likely to perform trophallaxis (G test, G = 12.84; P = 0.005. fig. 3).
Probability of trophallaxis after donor ants ingested sucrose solutions and returned to the recording arena. Different letters above bars indicate statistical differences (G-test pairwise comparisons with corrected alpha; P = 0.005). Brackets indicate the number of ants for each treatment.

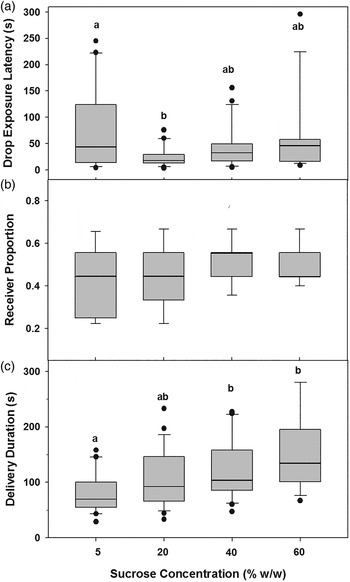
Sucrose concentration also affected the drop exposure latency. Ants that had ingested 20% sucrose solution were the quickest to offer a drop and were significantly faster (mean 25.9 ± 3.2 s) than the slowest which were those that ingested 5% sucrose (mean 77.7 ± 12.0 s) (K–W: H 3,85 = 9.52, P = 0.023. fig. 4a).
(a) Drop exposure latency (s), (b) Receiver proportion and (c) Trophallaxis duration (s) as functions of sucrose concentration. Drop exposure latency showed a minimum for 20% sucrose, significantly less than for 5%. Receiver proportion did not vary with sucrose concentration. Trophallaxis duration increased with sucrose concentration, with significant differences between 5 and 40% and between 5 and 60%. N: 5% = 20, 20% = 29, 40% = 21, 60% = 15. Boxes show quartiles, horizontal lines within each box represent medians, whiskers provide the extreme values and dots indicate outliers. In all graphs, different letters indicate statistical differences (K–W pairwise comp., P < 0.05).

The proportion of receiver ants did not differ significantly with sucrose concentration (K–W: H 3,85 = 3.24, P = 0.355. fig. 4b). Delivery duration increased with sucrose concentration, with that of the lowest concentration (5% sucrose, 81.5 s ± 5.9) being significantly shorter than for the highest concentrations of 40 and 60% (125.7 ± 9.5 s and 153.5 ± 10.9 s, respectively) (K–W: H 3,85 = 15.58, P = 0.0014. fig. 4c).
Donor behavior prior to food offering
Walking activity did not differ with the sucrose concentration being for 10%: 1.04 ± 0.5; for 20%: 1.00 ± 0.4; for 40%: 1.03 ± 0.6 and for 60%: 1.22 ± 0.6 line crossings (ANOVA: F 3,120 = 0.98, P = 0.41; for each concentration N = 31).
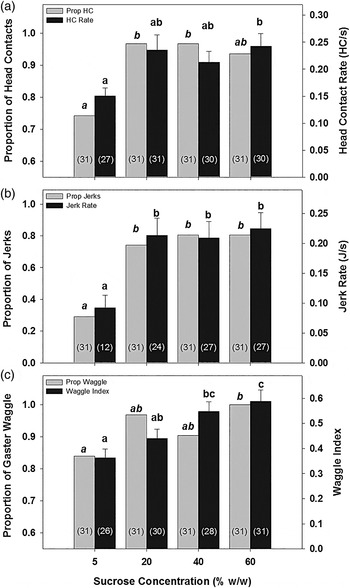
Head contacts, Head jerking (interactions between individuals) and gaster waggle (individual behavior) differed among the sucrose concentrations, predominantly with ants consuming the most dilute solution (5%) conducting the smallest proportion of behaviors (fig. 5) and also conducting significantly fewer movements than ants consuming all other sucrose concentrations (fig. 5) (proportion of head contacts: G = 12.377, P = 0.0062; head contact rate: H 3,118 = 7.997, P = 0.0461), (proportion of jerking: G = 25.996, P < 0.0001; jerking rate: H 3,90 = 11.394, P = 0.0098), (proportion of gaster waggle: G = 8.606; P = 0.0350; gaster waggle index F 3,120 = 7.952, P < 0.0001).
Donor ant behavior. Gray columns represent the proportion of total donor ants which performed the behavior, black columns represent the rate at which the behavior occurred (i.e. number of events during latency time). The gaster waggle index takes into account the time the ant waggled her gaster over the total walking time. All behaviors were affected by sucrose concentration; in particular, low concentration showed lower rates and proportions. (a) Head contact proportion and rate, (b) jerking proportion and rate and (c) gaster waggle proportion and index. Different letters above bars indicate statistical differences (G-test pairwise comparisons with corrected alpha; P < 0.05). Brackets indicate the number of ants in each treatment.

Discussion
Modulation of individual ingestion
Our study showed that sugar concentration can affect individual feeding behaviors as well as subsequent interactions between nestmates in the Argentine ant. Crop loads were largest for intermediate sucrose concentrations. Similar results have been observed in other ants (Camponotus mus: Josens et al., Reference Josens, Farina and Roces1998; and Rhytidoponera metallica: Dussutour & Simpson, Reference Dussutour and Simpson2008), in which dilute solutions also produced partial crop loads.
It has commonly been observed that nectivorous insects increment feeding time with increasing sucrose concentration (Josens & Farina, Reference Josens and Farina1997; Josens et al., Reference Josens, Farina and Roces1998; Detrain & Prieur, Reference Detrain and Prieur2014). This was also the case of L. humile in which feeding time increased linearly with increasing sucrose concentration. This linear pattern of increment differs from that observed in other ant species in which ingestion time increased exponentially (C. mus: Josens et al., Reference Josens, Farina and Roces1998; Falibene et al., Reference Falibene, de Figueiredo Gontijo and Josens2009; Lasius niger: Bonser et al., Reference Bonser, Wright, Bament and Chukwu1998; Detrain & Prieur, Reference Detrain and Prieur2014), coinciding with the increment of viscosity with concentration (Wolf et al., Reference Wolf, Brown, Prentiss and Weast1984). In the case of the ant Odontomachus chelifer, longer ingestion times were reported for medium and low concentrations (5–30%) compared with those observed for high concentrations (50–60%) (Ávila Núñez et al., Reference Ávila Núñez, Naya, Calcagno-Pissarelli and Otero2011); this could have been a consequence of their feeding habits, because they are predominantly predators even though they can have an opportunistic diet (Raimundo et al., Reference Raimundo, Freitas and Oliveira2009).
The intake rates also varied with sugar concentration. Theoretical models on feeding dynamics predict a decrement in intake rates with increasing sugar concentration due to the exponential increment in viscosity (Kingsolver & Daniel, Reference Kingsolver and Daniel1979, Reference Kingsolver, Daniel, Chapman and de Boer1995; Harder, Reference Harder1986; Kim et al., Reference Kim, Gilet and Bush2011). Our results are in agreement with this concept and also aligned with studies on individual food intake in which other ant species ingested solutions at different rates according to sucrose concentration (Josens et al., Reference Josens, Farina and Roces1998; Paul & Roces, Reference Paul and Roces2003; Ávila Núñez et al., Reference Ávila Núñez, Naya, Calcagno-Pissarelli and Otero2011).
Body size affects feeding performances; particularly, intake rate of sucrose solution increments with increasing ant size within a polymorphic species (C. mus: Josens, Reference Josens2002; C. rufipes and Atta sexdens: Paul & Roces, Reference Paul and Roces2003) as well as among species (Davidson et al., Reference Davidson, Cook and Snelling2004). Because of the small size of L. humile and its mechanism of ingestion by suction, it is expected that viscosity becomes a critical factor limiting intake rate for the more concentrated solutions (Kingsolver & Daniel, Reference Kingsolver, Daniel, Chapman and de Boer1995; Kim et al., Reference Kim, Gilet and Bush2011). Here, concentrations >30% w/w had significantly lower intake rates than 10%, with the highest values of intake rates being for 10 and 20%.
Modulation of trophallaxis and other social interactions
Contact between individuals within a colony enables information transfer (Wilson, Reference Wilson1971; Farina, Reference Farina1996; Hölldobler, Reference Hölldobler1999). Trophallactic contact in particular, allows foragers to empty their crop, distribute food, and exchange information about a particular food source (Farina & Grüter, Reference Farina, Grüter, Jarau and Hrncir2009). Even brief contacts with the drop offered are enough for the receiver ant to associate an odor with the sucrose present in the nectar, as has been shown in bees (De Marco & Farina, Reference De Marco and Farina2001) and the ant C. mus (Provecho & Josens, Reference Provecho and Josens2009). Additionally, brief contacts with a donor ant can stimulate foraging; in harvester ants, inactive foragers are activated to forage depending on the rate of interactions with successful foragers when they return to the nest (Gordon et al., Reference Gordon, Holmes and Nacu2008, Reference Gordon, Guetz, Greene and Holmes2011). In a similar way, honeybee foragers are stimulated to leave the hive by contact with returning foragers (Farina, Reference Farina1996).
Our experiments showed quantitatively for L. humile how the highest sucrose concentrations promote donor ants to perform a repertoire of motor displays and tactile interactions with nestmates. The proportion of donors that performed head contacts, head jerks and gaster waggles was lower for 5% w/w and those ants which did so, showed a lower rate. In the nest context, this would imply that a lower number of potential foragers would be stimulated when a scout returns from a low concentrate source rather than when she returns from a high concentrate source. In other species, high sucrose concentrations lead to an increase in the number of recruited ants (Detrain et al., Reference Detrain, Deneubourg, Pasteels, Detrain, Deneubourg and Pasteels1999; Detrain & Deneubourg, Reference Detrain and Deneubourg2008). Therefore, our results might explain possible mechanisms that might be involved in triggering the recruitment of L. humile workers to a sucrose source.
Head jerking and contacts plateaued at 20%, both in their rate and proportion. That could reflect that these variables reach a saturation value at a sucrose concentration of 20% w/w. It is possible that these behaviors may depend on some threshold of resource assessment, above which are triggered by the donor ant. However, other conditions, such as a shorter starvation, a different season of the year, etc. may result in a shift of the curves and reach saturation values at a different concentration.
The modulation of behaviors related to recruitment and also to nestmates’ response to these stimuli plays a key role not only in the selection of suitable food resources to forage, but also in the regulation of recruitment optimization according to colony's needs. Waggle motor displays and vibrations alert nestmates, which subsequently follow the recruiting leader ant to the food source in Camponotus socius and jerking movements are involved during recruitment to new nest sites (Hölldobler, Reference Hölldobler1971). Head jerking has been suggested to increase recruitment efficiency in other ant species (Sudd, Reference Sudd1957; Szlep & Jacobi, Reference Szlep and Jacobi1967; Szlep-Fessel, Reference Szlep-Fessel1970; Möglich & Hölldobler, Reference Möglich and Hölldobler1975; Van Vorhis Key & Baker, Reference Van Vorhis Key and Baker1986; Hölldobler, Reference Hölldobler1999). In L. niger, the starvation level was found not to affect the trail-marking intensity (Mailleux et al., Reference Mailleux, Detrain and Deneubourg2006), but the recruits’ response to the recruiter's signal was: if the starvation level increased, this induced more recruits and thus more workers foraging in starved colonies (Mailleux et al., Reference Mailleux, Buffin, Detrain and Deneubourg2010).
Some studies on ant recruitment refer to an ‘excited walk’ exhibited by the recruiter, especially after ingestion of a rich source (Sudd, Reference Sudd1957; Szlep & Jacobi, Reference Szlep and Jacobi1967; Szlep-Fessel, Reference Szlep-Fessel1970). In our recordings, we were able to observe that a greater proportion of donors that drank on a higher concentration also depicted a different, more ‘agitated’ walking style. Initially, we assumed that the difference was due to speed, but, at least in the conditions of the arena, we could not find any differences when comparing the walking activity among the groups. Nonetheless, after more detailed observation, we were able to characterize a new walking behavior, an intermittent waggle of the gaster from side to side. The gaster waggle occurred while the ants were walking, and its oscillation frequency proved to be very difficult to quantify as they were not filmed in high speed in order to be analyzed later in slow motion. In C. socius, the recruiting ant vibrates with the head and thorax between 6 and 12 strokes s−1 (Hölldobler, Reference Hölldobler1971). However, most studies referring to ‘excited walks’ were performed through naked-eye observations (Sudd, Reference Sudd1957; Szlep & Jacobi, Reference Szlep and Jacobi1967; Szlep-Fessel, Reference Szlep-Fessel1970); therefore, if any gaster waggle occurred, it could have not been detected as such. The donors that had ingested richer solutions exhibited this behavior more frequently; in the case of 60% w/w sucrose solutions, 100% of donors ‘waggled’. The function of this behavior remains unclear, though it is possible that in the nest, where density of individuals may be very high, the probability of encounters between the donor and inactive foragers would increase with this waggle. In addition, it could also facilitate the propagation of pheromones being released by the donor, which are essential for recruitment in this ant (Van Vorhis Key & Baker, Reference Van Vorhis Key and Baker1986).
Finally, trophallaxis was also influenced by sugar concentration. The probability of trophallaxis occurrence was minimal and the latency maximal for both 5 and 60% sucrose solutions, but the underlying mechanisms were probably different. Although low motivation for establishing contacts may explain the delay for donors that consumed 5% sucrose donors, the high motivation that triggered jerking and waggles before trophallaxis may explain the delay for 60% donors. In the nest context, donors that return from a rich nectar source would delay trophallaxis by performing contacts and motor displays to recruit inactivate foragers.
Liquid sugary baits laced with an active compound are generally preferred to solid or gel baits for controlling L. humile (Baker et al., Reference Baker, Key and Gaston1985; Klotz et al., Reference Klotz, Greenberg and Venn1998, Reference Klotz, Rust, Costa, Reierson and Kido2002; Rust et al., Reference Rust, Reierson, Paine and Blum2000; Silverman & Roulston, Reference Silverman and Roulston2001). Our results indicate that sugar solutions being used for baits should not be too dilute or too concentrated. On the one hand, dilute baits can generate low motivation, low rates of trophallaxes and reduce recruitment. On the other hand, too highly concentrated baits would lead to high time of feeding and trophallaxis, which would result in very long foraging cycles and partial crop loads. Thus, baits of intermediate sugar concentrations, ca. 20%, appear to be appropriate to add an active compound because they promote rapid foraging cycles, a high crop load per individual, and a high degree of stimulation for recruitment.
Because dilute baits require periodic cleaning to prevent sugar from fermenting and therefore need to be monitored and refilled frequently (Boser et al., Reference Boser, Hanna, Faulkners, Cory, Randall and Morrison2014; Buczkowski et al., Reference Buczkowski, Roper, Chin, Mothapo and Wossler2014), most commercially manufactured baits contain additives that increase viscosity or gelling improving bait stability, durability and ease of application. Our results put in evidence that one of the big challenges for Argentine ant control is the development of a device able to deliver dilute and stable baits.
Acknowledgements
We thank the two anonymous reviewers for their comments and Ben Hoffmann for his suggestions and editing corrections to improve this manuscript. This study was supported by funds from the National Council for Scientific and Technological Research from Argentina (PIP 112 201101 00472). The present work complies with the principles of animal care and also with the current laws of the country in which the experiments were performed.