DEFICITS AND DEBTS HAVE REDUCED FUNDING OF UNIVERSITIES IN THE EU
The pre-crisis period looked like bliss for European Universities: European universities might strengthen their dismal position in the rankings of top universities (Ritzen Reference Ritzen2010) as a result of the intentions of the Lisbon Strategy. The Bologna agreement, signed in 1999, defined the same study structure with a Bachelor, Master, and PhD degree and would allow for more competition in higher education between different EU countries enforcing an upward quality spiral.
The Lisbon Strategy was launched by the European Commission in 2000. The strategy aimed at making the EU “the most competitive and dynamic knowledge-based economy in the world” by 2010, focusing on research and higher education. Universities had become increasingly recognized as an essential part of the (sustainable) growth engine (Aghion and Howitt Reference Aghion and Howitt1997).
The pre-crisis period of 2000–2008 was also a time of high economic growth and decreasing unemployment virtually across the EU within a Europe which had just found a new form through the accession of eight new central and eastern European countries to the EU in 2004 and the subsequent accession of Romania and Bulgaria in 2007, bringing the number of countries in the EU at the beginning of the crisis to a total of 27.
But then, in September 2008, the financial and economic crisis hit the EU. Economic growth in the EU as a whole declined: during the period 2005–2014 accumulated economic growth amounted to no more than 9.3% with a deep recession in 2009 when the EU’s GDP declined by 4.5%. This resulted in lower than expected government revenues, while government expenditures kept rising in part due to earlier commitments and in part spurred by the crisis. In order to reduce government deficits below the 3% of GDP level mandated in the EU stability pact (a criterion agreed upon with the Maastricht Treaty), governments were compelled to react to the deep crisis with substantial budget cuts and by raising taxes as well as private contributions for government services.
Since 2014, all EU countries (except for Croatia, Cyprus, Italy, and Finland) have enjoyed positive growth rates (with Greece falling overboard again in 2015). Yet they still are grappling with high rates of government debt (to GDP), in part resulting from bail out costs of banks, so that debt levels are (often substantially) higher than the 60% allowed in the EU stability pact.
Government budget cuts and revenue-increasing measures had an impact on all domains of life. These cuts were strongly felt in European higher education, Footnote 1 where government is the major funder of higher education (approximately for 94% of the direct costs).
I will argue that for the EU, as a whole, the crisis has had a severe impact on the potential of universities to deliver high quality graduates and high quality research, while the effect on equality of access has been minimal or absent. However, the differences between EU countries are substantial. For ease of discussion, I combine the EU countries into three blocks (“North-west,” “South,” and “East”), even though substantial differences across and even within blocks may exist. The EU has mitigated the impact of the national budget cuts on the quality and quantity of higher education graduates. First, the standardization of academic programs and outcomes as agreed upon in Bologna continued during the crisis and was virtually completed by 2015 within the EU Footnote 2 . Second, the student mobility programs of the EU were increased, while thirdly the EU Research Programs (Framework Programs and Horizon 2020) compensated in part for the decreases in national funding for university research.
In section 2, I consider university funding and enrollment during the crisis. Section 3 looks into the potential damage in the EU as a result of the decrease in funding on outcomes of universities (in terms of the competencies of graduates, research performance, equality of access and innovation within universities). In section 4, these findings are juxtaposed against impressions of the US. The last section (5) presents conclusions and discussion.
UNIVERSITY FUNDING AND ENROLLMENT IN THE EU DURING THE CRISIS
The crisis took place at a time when European universities (in particular in the “old” EU) were more or less reaching “saturation” levels of participation after a period of several decades of fast increases in participation rates (the so-called “massification”). Massification was accompanied by decreasing per-student levels of funding and possibly by lower learning outcomes. European universities (with the exception of the UK Footnote 3 ) were underrepresented in the top university rankings that appeared in the early years of the twenty–first century.
Public Funding, Private Funding, and Student Aid Footnote 4 2008–2010
More than half of the 22 European countries and regions for which the European University Association collected data cut government expenditures for university education (including student aid) during the crisis (EUA 2014) with the greatest cuts in Greece and Hungary (greater than 40%). At the same time in just over a quarter of these 22 countries public funding for universities increased during the crisis. The countries where universities were hurt most by the crisis were those that had to seek refuge under the umbrella of EU-emergency funding, because their government debt was rising and they were unable to lend any more on the international capital markets: Cyprus, Greece, Ireland, Portugal, and Spain (to be called: the CGIPS-group).The countries who were less hard hit by the crisis generally retained their room for university funding. In most EU countries government funding per student went down without the legal ability of universities to raise tuition fees.
Public research expenditure shows a downward trend similar to that of per student funding. Public research as a percentage of GDP decreased in the EU during the period 2008–2013 (Eurostat data). However, the EU central budget played a compensatory role in funding university research. The EU “Framework Programs” and its 2013 successor (“Horizon 2020”) have become a major source of income for European research universities (around 8%). “Horizon 2020” showed a 30% increase in EU funding for research and innovation.
While there was hardly a political debate on the cuts in public expenditures to universities, the political discussions on higher education on tuition fees in combination with student aid were fierce. In 17 of the 32 European countries, policy reforms took place on tuition fees and student aid (Ritzen, Marconi, and Sasso Reference Ritzen, Marconi and Sasso2014). The subsequent reforms were not always in the same direction. In some countries, tuition fees were abandoned (like in Estonia, Germany and Turkey), but in others the student contribution was increased (in Ireland). Bulgaria and Hungary reformed their student loan systems. The UK has moved to tuition costs of £9000 while expanding the comprehensive social student loan scheme. In several EU countries, like the Netherlands and Finland, government proposals allowed universities to charge tuition fees for international students from outside the EU to broaden the funding base of universities.
Tuition fee policy was highly volatile, with some countries decreasing tuition fees that had increased them in the recent past (for example in Germany). Overall private contributions to higher education Footnote 5 rose slightly, but far from offset the cuts in public spending. Cuts in public education expenditures and the rare tuition increases were mostly the direct consequence of the deteriorating state of the economy of the country. Yet, the strength of the minister responsible for higher education within the cabinet could have been an important factor in averting budget cuts. The strength of the minister in the cabinet has to do with knowledge of the sector and political experience (Jacqmin and Lefebvre Reference Jacqmin and Lefebvre2015). The role of the minister can be best illustrated with Portugal finding two of its universities in the top 500 in 2015. This is widely attributed to the late Minister Mariano Gago’s role in higher education and science between 1995–2010.
During the crisis, high youth unemployment reduced the opportunity costs for study in southern European countries, while in those same countries the returns (additional income earned) to higher education remained high, driving participation up.
Enrollment, Graduation, and Mobility 2010–2012
Enrollment is the result of government funded capacity (which was shrunk in some countries during the crisis, like in Hungary), demography, mobility, access, and participation. During the crisis, high youth unemployment reduced the opportunity costs for study in southern European countries, while in those same countries the returns (additional income earned) to HE remained high, driving participation up. Absolute enrollment numbers increased in western Europe but decreased in the East (notably in Romania, Latvia, Slovenia, and Slovakia).
Mobility in the EU is prompted by European student mobility programs. During the crisis the new Erasmus program received about 40% more funding compensating in part for funding losses in the countries. Still, student mobility (inward mobility as a percentage of the students in the home country) was only at around a median of 4% in 2010. The Netherlands saw the largest increase (+3%), between 2010 and 2012. In general, there was some convergence across the 32 European countries. Student mobility also affects graduate mobility, while labor market mobility as a whole was highly spurred by the single EU labor market (Kahanec Reference Kahanec2012).
The number of new entrants relative to the total population has decreased in the majority of European countries, after decades of increases (notably in Portugal and Romania). This was in response to the crisis: governments decided to make participation in higher education more difficult by restricting the number of places. However, there were also countries, like Denmark and Germany, where the ratio of new entrants to the population increased.
Many continental EU countries have derived their university structure from the system established by Wilhelm von Humboldt in 1810 at the University of Berlin. Students themselves set the timeline for their studies, regardless of the “nominal” curriculum prescribed by the university. The average time for a student to graduate is then substantially longer than the nominal time, while high dropout occurs. This system survived the massification of universities. Since the early 1960s, however, governments have sought to increase “throughput” and graduation rates, by decreasing the length of the study period and the number of dropouts Footnote 6 . It turns out that during the crisis the tendency towards higher graduation rates continued in those countries with low rates. The increase in graduation rates was particularly noticeable for Italy (which increased from 11% to 20%), the Netherlands, and Portugal. Graduation rates have decreased the most in Romania and (outside the EU) Turkey, presumably as a result of the reduced employment chances for graduates.
UNIVERSITY OUTCOMES AFFECTED BY THE CRISIS
University Expenditures and Competitiveness
It is likely that the financial crisis has had an impact on the future competitiveness of those countries that were most affected. These countries had to resort to cuts on per student expenditures for university education and on public research conducted in universities. Better funding for education is likely to lead to better competencies of graduates, which in turn may lead to higher labor productivity. In general, more expenditure on public research (in universities or elsewhere) supports a higher level of research output, which again translates into higher labor productivity (Ritzen Reference Ritzen2016).
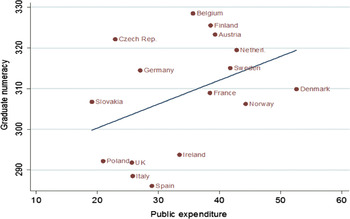
Competencies of university graduates differ substantially across countries. Those differences are likely to be related to funding per student, as suggested by figure 1 for numeracy competences, where funding is proxied by public expenditures per student in relation to GDP per capita in one single year just before graduation Footnote 7 . It is not only funding, but also the institutional characteristics (e.g. the organizational form of the universities) that count in “producing” learning outcomes like competencies. The measures for competencies are “culturally neutral” and independent of the class or social origin of the respondent. Funding and institutional characteristics appear to have an independent impact of university outcomes.
Graduate competences and university funding, 2010, 17 European countries
Note: Graduate numeracy is the average score graduates (ISCED 5-6), 25-34 years old; Public expenditures captures expenditure per student as a percentage of GDP per capita. Sources: PIAAC data and data from Empower European universities (www.empowereu.org).

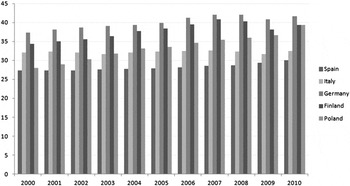
Labor productivity, in turn, seems to depend in part on competencies, as illustrated by Hoareau, Ritzen, and Marconi (Reference Hoareau, Ritzen and Marconi2013) who make a direct connection between university funding and labor productivity. Figure 2 shows the development of labor productivity in the period 2000–2010 in selected European Union countries. The figure shows the giant steps in Polish labor productivity improvement. It also shows how badly the southern European countries performed. Germany is an example of a north-western European country where labor productivity continued to grow on a high level. These differences in labor productivity partly explain the resilience of European economies to the crisis.
Labor productivity 2000–2010
Note: Labor productivity per hour worked = Real output (deflated GDP measured in chain-linked volumes, per unit of labor input (measured by the total number of hours worked). Source: http://ec.europa.eu/eurostat/en/web/products-datasets/-/TEC00116.

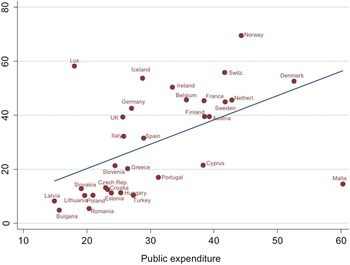
Labor productivity appears closely related to investments in higher education as figure 3 shows. This figure is only meant as an impression as it relates the per student costs to productivity only two years later, while many other factors also contribute.
Labor productivity 2012 and per student higher education expenditures 2010
Note: Public expenditure per student as a % of GDP per capita (2010) = Public expenditure (current and capital) includes government spending on educational institutions (both public and private), education administration as well as subsidies for private entities (students/households and other privates entities), ISCED 5-6. Previous years used for missing values. Source: World Bank.

These observations bode ill for the future. The power of European universities to contribute to labor productivity through increased competencies of graduates will depend on the ability of the state to fund higher education. The south will find it difficult to catch-up, for it is here that universities were most severely hit by the crisis, because the crisis translated into cuts into expenditures per student.
Increases in labor productivity are not only linked to the competencies of graduates, but also to the research “productivity” of universities (Hoareau, Ritzen, and Marconi Reference Hoareau, Ritzen and Marconi2013; Mazzucato and Penna Reference Mazzucato and Penna2015). This is the innovation link: more and better research helps the creation of innovation in production and production processes. Research productivity is measured by scientific publications within the 10% most-cited scientific publications worldwide, as a percentage of total scientific publications of a country. Research productivity is engendered by funding. During the crisis the productivity of higher education and its connection to the external environment (measured as the number of public private co-publications) has increased in most European countries. This was to be expected, as many publications during the crisis were already in the pipeline at the time the crisis hit. Yet one can expect that research productivity in the near future will decline in countries that face major budget cuts in university research expenditures, also affecting their position in university rankings, as these are, by and large, determined by research performance.
Equality of Access
Inequality in access to higher education, overall in Europe, declined over the period 1960–2009 (Koucky, Bartusek, and Kovarovic Reference Koucky, Bartusek and Kovarovic2010), most notably in western Europe, but also in southern Europe, yet with an upward swing in central and eastern Europe after the breakdown of the Soviet Union in 1992. During the crisis, European countries have generally maintained their policies of funding public universities with no or low tuition fees, while generously providing grants and loans to students so that the pre-crisis trend of declining inequality in access was continued.
The only country which reacted to the crisis by sharply raising tuition fees is the UK (and to a lesser extent, Ireland). These tuition increases were embedded in an expansion of the social loan scheme. Initial concerns that tuition increases would reduce demand for higher education, particularly for youngsters from family backgrounds without higher education experience, have so far not materialized.
The European tradition of guarantying equality of access, with low or no tuition fees and ample student grants, is heavily criticized as benefitting the upper middle class (the children of the richer part of the population who are more likely to go to university) (Ritzen Reference Ritzen2010). From this perspective, the alternative of higher private costs and social loans (as is now in place in the UK) would be a more fair system. However, this alternative does not seem to fit in the political traditions of continental Europe.
Never Waste a Good Crisis
There is very little evidence that the crisis engendered serious innovation in university teaching, either in new forms of learning or in content. To the contrary, the introduction of good practices as observed worldwide, for example in students assessing teachers or in problem and case-based learning, seems to have slowed down (see for a Greek example: Koulouris et al. Reference Koulouris, Moniarou-Papaconstantinou and Kyriaki-Manessi2014). If anything, the crisis has also slowed the development of blended learning in universities, including the use of MOOCs or other forms of online learning, in addition to “old-fashioned” classroom learning. Apparently the introduction of such innovations requires investments that were difficult to free up within universities at the time of the crisis.
The crisis may have prompted a greater focus on integrity within business and economics education (Rae Reference Rae2010), thus shedding “an ideology of neo-liberal deregulated market economic growth, based largely on a North American set of cultural values which are increasingly questioned in view of the negative effects experienced from the crisis, leading to a rethinking of the basis for enterprise education.” However, the websites of European business schools provide no evidence to support this contention Footnote 8 . Budget cuts have not led to fewer rules imposed by governments for accountability and quality control on universities, nor for less bureaucratic research procedures. On the contrary, it seems like the paper mill has continued to grow. The US trend, where half of research time is spent on administration, is probably extending to Europe. In most of the EU countries governments and university organizations are searching for new ways and forms to align accountability to the general public with internal quality control (High Level Group on the Modernisation of Higher Education 2013).
The US and the EU higher education systems differ substantially in structure and funding. US expenditure for direct costs was 2.7% of GDP in 2011, almost the twice that of the EU 21 (1.4%), while the percentage spent on student financial support was almost the same (.4%).
Comparing Europe and the US
The US and the EU higher education systems differ substantially in structure and funding. US expenditure for direct costs was 2.7% of GDP in 2011, almost the twice that of the EU 21 (1.4%), while the percentage spent on student financial support was almost the same (.4%). The US system is primarily funded by private contributions, the systems of higher education in the EU with public money.
Most observers of the impact of the crisis on US universities see substantial damage done by the financial downturn (Douglass Reference Douglass2010; Altundemir Reference Altundemir2012; Christopherson, Gertler, and Gray Reference Christopherson, Gertler and Gray2014). In particular concerns are raised about a potential decrease in equality in access (e.g. Mettler Reference Mettler2014; Putnam Reference Putnam2015). Indeed, the major difference between the US and Europe is that equality of access seems to be far better safeguarded in Europe than in the US. Private costs in the US are on average much higher than in Europe, while public resources for student aid (as a percentage of GDP) are the same (about .4% of GDP, in the US supplied by Pell grants or Fannie Mae). The US may as a result be losing some ground compared to Europe in the race to develop human capital. At the same time, worldwide rankings show that both the US and Europe are losing ground to Asia.
Douglass (Reference Douglass2010) was cautiously positive on Europe: “Their political leaders see higher education as a key to short-term economic recovery, long-term competitiveness, and often their own political viability—particularly in nations with upcoming elections.” We could not find any evidence supporting this positive note in our study of 2014 (Ritzen, Marconi, and Sasso Reference Ritzen, Marconi and Sasso2014). Poland turned out to be the only country for which the correspondent is optimistic on improvements in innovation Footnote 9 . Most of the other country correspondents were neutral. Correspondents in Croatia, Cyprus, Hungary, and Latvia were pessimistic.
CONCLUSIONS AND DISCUSSION
After a biblical seven-year period, the economic crisis seemed to be over in 2015, with economic growth picking up again in most EU countries. During the crisis, economic growth fell and fewer taxes were collected; banks were rescued with public money; debt levels rose and (youth) unemployment increased. Governments cut budgets in order to satisfy the “Maastricht criteria” of budget deficits and of the government debt-to-GDP ratio. This has impacted universities, both through the reduction of direct expenditures for students and (much less) the reduction of student aid (loans and grants).
This was felt by universities and (potential) students alike. In particular universities of the group of countries which had to seek refuge under the umbrella of the European Emergency Fund (Cyprus, Greece, Ireland, Portugal and Spain) were hard hit in terms of funding direct costs and student aid. EU governments, except for the UK, barely allowed universities to compensate for the loss of public funding of direct costs through increased tuition fees.
The economic crisis has slowed and for some countries reversed the process initiated with the Lisbon Strategy, launched in 2000 to increase the competitiveness of the EU through economic innovation. The near future shows in many countries the need to further reduce government debt, undercutting the space for higher government outlays for higher education and public research.
Student exchange and mobility has not suffered, thanks to the EU Program for student exchange (Erasmus Program). Also equality of access in Europe could be sustained, if measured by the availability of financial aid to students, relative to total public expenditures on higher education. During the crisis, European countries mostly abstained from raising the private (direct) costs of higher education as a way to compensate for cuts in public expenditures, even though on the political scene the division of total per student costs between the public and the private was the main topic of discussion.
The impact of the crisis has reduced the innovative power of the EU economies in so far as they depend on the competencies of graduates, as competencies are likely to depend on funding.
Research productivity continued to increase. However, this is likely to be the result of pre-crisis investments. The future will show the extent to which research has been hurt by the crisis. The EU Framework Program has compensated to some extent for research cuts on the national level, while encouraging convergence.
There is little or no evidence to support the notion that the crisis has encouraged innovation in learning methods, either in the content of learning, or in research inside universities in Europe.
In comparison to the US, Europe may not have fared too badly during the crisis, by preserving equality of access. The US, with substantially higher tuition fees, may have lost its edge in promoting intergenerational mobility through higher education. It is likely that the crisis made it more difficult for youngsters from low and middle income groups to participate in higher education, compared to Europe (with similar levels of student aid, in relation to GDP).
Both the US and Europe may have lost some of their comparative advantages over Asian universities, as a result of the crisis.
DEDICATION
Paper dedicated to the memory of Mariano Gago, Minister of Science in Portugal, 1995–2002 and 2005–2011 for his inspiration for higher education and science.