I. INTRODUCTION
The screening in the early development phase of the pharmaceutical product lifecycle is one of the most important processes for understanding the physicochemical properties of drug candidate compounds. Powder X-ray diffraction (hereinafter referred to as PXRD) is the most-used method for quickly and non-destructively identifying crystalline polymorphs using a small amount of sample. Currently, high-throughput measurements mounted in well plates are the main method. If a sample is determined to be a mixture of crystalline polymorphs, quantifying the amount of each polymorph requires a PXRD pattern for each phase. Furthermore, if an amorphous phase exists in the sample, the quantification becomes very difficult.
For the quantification of the phases in the PXRD pattern, Toraya has developed a new method called the Direct Derivation Method™ or simply the DD method (Toraya, Reference Toraya2016, Reference Toraya2024) to quantify the amount of each phase present. The DD method requires the PXRD pattern and the chemical formula of each phase. Once the pattern is obtained, we can quantify the crystalline phase and even the amorphous phase. However, we often need a pure sample to obtain the PXRD pattern, making the quantification difficult. For more robust quantification, a different approach is needed.
The component decomposition method factorizes PXRD patterns of unknown mixtures into patterns of components using artificial intelligence. Without requiring the PXRD patterns of pure samples, this method can extract the patterns of each crystalline or amorphous phase from the measured pattern of mixtures.
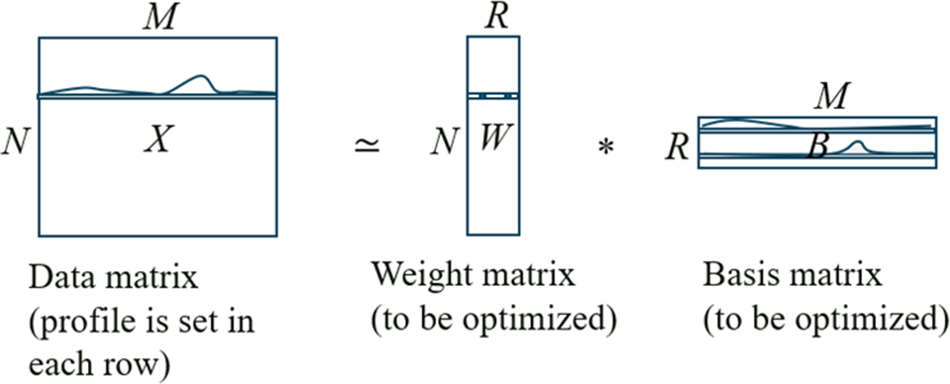
The component decomposition method is based on the nonnegative matrix factorization to the data matrix X where an experimental PXRD measurement profile is set in each row. It tries to factorize the data matrix X into two matrices W and B as
 $$ {\displaystyle \begin{array}{c}X\left(n,m\right)=\sum_{r=1}^RW\left(n,r\right)B\left(r,m\right),\\ {}\\ {}\hskip-1pc n=1,2,\dots, N,\\ {}\hskip-1.1pc m=1,2,\dots, M.\end{array}} $$
Here, N is the number of experimental PXRD measurement profiles, M is the number of points in the measurement profile, and R is the number of components. The N × R matrix W is called the weight matrix, and the R × M matrix B is called the basis matrix. The elements in matrices W and B are variables to be optimized by minimizing the distance between the left-hand side and the right-hand side of Eq. (1) with nonnegative constraint. As shown in Figure 1a, profile called the basis profile is set in each row of the basis matrix. Therefore, by using this method, the measurement profile is expressed as the superposition of basis profiles.
Schematic representation of the component decomposition.

The matrices are optimized by, for example, alternating least squares (ALS) (Paatero and Tapper, Reference Paatero and Tapper1994). That is, when the matrix W or B is fixed, the matrix B or W is optimized by the least square to minimize the square of the difference between X and WB, respectively. However, basis profiles thus obtained sometimes suffer from the problem of intensity distribution. That is, when a basis profile has a peak in a location, the intensity of other basis profiles at the location may also be enhanced or reduced. To illustrate this, the results of component decomposition are shown in Figure 2. The samples are the mixtures of two polymorphs of indomethacin and the amorphous phase. In Figure 2a, the three basis profiles obtained by ALS are shown, where the broadest profile (green line) corresponds to the amorphous profile. We can see that the amorphous profile has intensity enhancements or drops at the location where the other basis profiles have a peak. This is often the case when the sample has broad peaks of microcrystals or amorphous materials.
Basis profiles obtained by ALS (a) and the amorphous regularization (b).

To improve the decomposition accuracy, we put a constraint on the amorphous profiles during the decomposition process. Here, the method is called the amorphous regularization. Specifically, we identify the amorphous profiles during the decomposition process using a quantitative index called the relative total variation (RTV) of basis profiles:
 $$RTV=\frac{\left\Vert \operatorname{grad}\;f\right\Vert }{\left\Vert f\right\Vert}$$
Here, the profile is expressed as f. Since we can assume that the amorphous profile has broad peaks and the spatial variation is small, the RTV of the amorphous profile is expected to be small. We can identify the amorphous profiles out of the basis profiles by using this index. In this paper, we assume that there exists one amorphous phase in the sample. We regard the basis profile of the smallest RTV as the amorphous profile.
The result of the amorphous regularization for the indomethacin dataset is shown in Figure 2b. Compared with the amorphous profile obtained by ALS, that obtained by the amorphous regularization is smooth, while the other basis profiles seem almost the same.
Using the decomposed basis profile and the expected chemical formula of the component, we can calculate the weight fractions of each component using the DD method. In this study, we analyze the behavior of phase transitions of trehalose due to the changes in temperature and humidity using the amorphous regularization and the DD method.
II. EXPERIMENTAL
The measurements in this study were done using a SmartLab X-ray diffractometer (Rigaku) with a high-temperature attachment (Reactor X) and a relative humidity control unit (HUM-SL). The sample was trehalose. The scan was done in the angle range 2θ = 3–40° in the 2θ/θ measurement. It took 5 minutes to obtain a profile in a measurement. 205 measurements were done in the temperature range of 25–180 °C and the humidity range of 5–80% RH. The procedure for controlling the temperature and the humidity is shown in Figure 3a.
(a) The profiles of temperature (red) and humidity (blue). (b) The quantification result using the amorphous regularization and the DD method.

III. RESULTS AND DISCUSSION
As an example of the amorphous regularization and the DD method, we studied the behavior of phase transitions of trehalose during the changes in temperature and humidity. The measured profiles are shown in Figure 4a as a 2D color map. The intensity of the profile is shown by color (red is high intensity and black is low intensity). We observed five abrupt changes in the map along the temporal direction, meaning that the chemical reaction is promoted by changing temperature and humidity. We have six characteristic regions of the chemical reaction. In Figure 4b, a representative profile of each region is shown. The color of the region and the representative profile is set based on its dominant component, which we will determine in the following.
(a) Two-dimensional visualization of 205 PXRD patterns during the measurement. (b) The representative PXRD patterns at each phase of transitions.

We first decomposed the 205 measurement profiles into four components using amorphous regularization. In Figure 5, the four basis profiles are shown with the labels of phase names for comparison to the literature. The top three profiles have sharp peaks and correspond to the crystalline polymorphs of trehalose, while the rest has a broad peak and corresponds to the amorphous phase. For the quantification to be described below, we need the basis profile and the estimated chemical formula of each component.
Basis profiles obtained by the amorphous regularization.

The quantification results obtained by the amorphous regularization and the DD method are shown in Figure 3b along with the temperature and the humidity profiles for reader’s convenience. The weight fractions of the four phases vary in time, showing six characteristic regions of the chemical reaction. The initial state (the first region) is the dihydrate of trehalose. As the temperature increases, the dehydration reaction is promoted. In the second region, the anhydrate α becomes dominant, while the fraction of dihydrate decreases (Reisener et al., Reference Reisener, Goldschmid, Ledingham and Perlin1962). As the humidity is increased, the hydration reaction is promoted. In the third region, the anhydrate α vanishes and the dihydrate is regenerated (Sussich et al., Reference Sussich, Skopec, Brandy and Cesaro2001; Nagase et al., Reference Nagase, Endo, Ueda and Nakagaki2002). As the humidity is lowered and the temperature is increased, the dehydration reaction is promoted. In the fourth region, which is the early stage of the temperature increases, the anhydrate α and the amorphous phase are generated (Nagase et al., Reference Nagase, Endo, Ueda and Nagai2003). As the temperature continues to increase in the fifth region, the anhydrate α vanishes and the amorphous phase becomes dominant. When the amorphous phase continues to be heated, it turns into the anhydrate β in the sixth region (Nagase, Reference Nagase2005).
IV. CONCLUSION
Using component decomposition called the amorphous regularization and the DD method, we have simultaneously analyzed the phase transition behavior of trehalose in response to changes in temperature and humidity, and quantified polymorphs during the transitions. The validation of this method has been done using the results shown in the literature. This method is expected to be useful for in situ measurements such as XRD-DSC (X-ray diffraction-differential scanning calorimetry), which can measure XRD and DSC simultaneously, and for screening operations using 96-well plates.
CONFLICTS OF INTEREST
The authors declare none.