ClinicalTrials.gov identifier: NCT01453439
Body dysmorphic disorder (BDD) has a current nationwide prevalence of 1.7–2.9% in the general population and is far more common than this in psychiatric inpatient, psychiatric outpatient, and other medical settings (e.g. dermatology, cosmetic surgery) (Buhlmann et al., Reference Buhlmann, Glaesmer, Mewes, Fama, Wilhelm, Brähler and Rief2010; Schieber, Kollei, de Zwaan, & Martin, Reference Schieber, Kollei, de Zwaan and Martin2015; Veale, Gledhill, Christodoulou, & Hodsoll, Reference Veale, Gledhill, Christodoulou and Hodsoll2016). Preoccupations with nonexistent or slight appearance flaws and related, compulsive rituals are usually accompanied by impaired social, occupational, or other role functioning, reduced quality of life, and elevated rates of psychiatric comorbidities and psychiatric hospitalizations (Phillips, Reference Phillips2000; Phillips, Menard, Fay, & Weisberg, Reference Phillips, Menard, Fay and Weisberg2005). More than three-quarters of individuals with BDD report lifetime suicidal ideation and more than one-quarter suicide attempts (Phillips et al., Reference Phillips, Coles, Menard, Yen, Fay and Weisberg2005). Despite this serious public health concern, BDD remains underrecognized and undertreated (Phillips, Pagano, & Menard, Reference Phillips, Pagano and Menard2006).
The recommended psychosocial treatment for BDD is cognitive-behavioral therapy (CBT; Rasmussen, Gomez, & Wilhelm, Reference Rasmussen, Gomez, Wilhelm and Phillips2017). Multiple clinical trials have demonstrated the efficacy of CBT for BDD (Harrison, Fernández de la Cruz, Enander, Radua, & Mataix-Cols, Reference Harrison, Fernández de la Cruz, Enander, Radua and Mataix-Cols2016; Wilhelm et al., Reference Wilhelm, Phillips, Greenberg, O'Keefe, Hoeppner, Keshaviah and Schoenfeld2019). However, not all patients respond to treatment, let alone experience full remission (Krebs et al., Reference Krebs, de la Cruz, Monzani, Bowyer, Anson, Cadman and Mataix-Cols2017; Veale, Miles, & Anson, Reference Veale, Miles and Anson2015; Weingarden et al., Reference Weingarden, Hoeppner, Snorrason, Greenberg, Phillips and Wilhelm2021). Furthermore, a majority of patients do not receive CBT (Phillips, Menard, Quinn, Didie, & Stout, Reference Phillips, Menard, Quinn, Didie and Stout2013). Although less well studied, supportive psychotherapy (SPT) is the most common therapy for this condition (Phillips et al., Reference Phillips, Menard, Quinn, Didie and Stout2013). Yet to our knowledge, only one paper has examined mechanisms of CBT's effects (Fang et al., Reference Fang, Steketee, Keshaviah, Didie, Phillips and Wilhelm2020), and no prior study has examined mechanisms of SPT's impact. Thus, more work is needed to understand how treatments impact BDD symptoms in order to improve treatment delivery and outcomes.
Although precise mechanisms of treatment effects remain unknown, there are quite specific hypothesized pathways for symptom change in response to CBT (Wilhelm, Phillips, Fama, Greenberg, & Steketee, Reference Wilhelm, Phillips, Fama, Greenberg and Steketee2011). Briefly, the CBT model outlines that individuals with BDD selectively attend to facets of their appearance, fueling exaggerated, inaccurate, and intrusive negative beliefs and corresponding emotions. Efforts to neutralize these responses with ritualistic behaviors (such as excessive grooming) or with avoidance (for example, of social situations) ultimately reinforce selective attention to perceived appearance flaws, distressing thoughts, and strong negative emotions (Feusner, Neziroglu, Wilhelm, Mancusi, & Bohon, Reference Feusner, Neziroglu, Wilhelm, Mancusi and Bohon2010; Veale, Reference Veale2004). Each CBT skill is intended to modify very specific targets, or components of this model, at the time it is introduced (e.g. cognitive restructuring should change responses to and frequency of maladaptive thoughts). As noted above, however, only one paper has tested such hypotheses. Fang and colleagues examined cognitive and behavioral factors theorized to maintain BDD psychopathology in a small sample of patients (n = 45) undergoing CBT (Fang et al., Reference Fang, Steketee, Keshaviah, Didie, Phillips and Wilhelm2020). Within-subject changes in maladaptive thoughts and related behaviors mediated symptom improvement. The authors concluded that treatments targeting specific thoughts, rituals, and avoidance symptoms—understood to be core symptoms maintaining BDD—may yield the strongest overall outcomes.
From a clinical perspective, it seems intuitive that BDD symptoms interact to activate, exacerbate, or maintain one another. For example, reducing time spent examining one's appearance would be expected to lead to reductions in appearance-related distress, or increases in appearance-related distress would be expected to lead to increases in ritualizing, such as checking one's appearance in the mirror or seeking reassurance from others. Thus, it should be useful to formally consider BDD from a network perspective, whereby the disorder is not some entity productive of symptoms, but rather symptoms and their interrelationships constitute the disorder (Schmittmann et al., Reference Schmittmann, Cramer, Waldorp, Epskamp, Kievit and Borsboom2013; Summers et al., Reference Summers, Aalbers, Jones, McNally, Phillips and Wilhelm2020). In other words, it is the activated web of co-occurring, interrelated, dysregulated processes that precipitates harmful outcomes. It seems logical that targeting theoretically central processes—or those exhibiting the most influence on other symptoms or the larger system— could facilitate broader recovery or that a failure to do so would inhibit it. This has yet to be tested in BDD. Such an examination is necessary because, for example, it is possible that CBT does not actually act on these specific symptoms. It is possible that CBT might benefit patients in non-specific or variable ways, similar to how SPT benefits patients with other disorders (e.g. via common factors); expectations for treatment, psychoeducation about BDD, and acceptance and empathy from a clinician might alone have powerful effects on symptoms (Grencavage & Norcross, Reference Grencavage and Norcross1990; Wampold, Reference Wampold2015). As such, focusing on particular treatment modules or skills might not generate better results. We aim to build on this work to further understand whether CBT has specific effects on BDD symptoms.
One limitation of existing work is the level of analysis typically employed in clinical trials. By reducing symptoms to a binary variable (presence of a diagnosis) or severity index (sum score), or by focusing only on post-treatment outcomes, we may be missing critical mechanisms of change or stagnation. For example, there are many meaningfully different ways to obtain similar scores on a severity measure (e.g. low levels of all symptoms, high levels of a few symptoms, similar levels but for different combinations of symptoms). Additionally, because CBT involves multiple skills modules, symptoms might change at different points in treatment. And, some symptoms may not change at all. It is also possible that CBT effectively targets only certain BDD symptoms and thus only benefits patients whose pathology is driven by such symptoms.
The present report addresses two questions: (1) Does CBT meaningfully target specific symptoms, compared to SPT? (2) Do CBT-driven changes in BDD symptoms occur in the order predicted by the course of CBT treatment for BDD? We consider unique, direct connections between received treatment and specific symptom changes as well as through indirect symptom-to-symptom pathways. To this end, we examine patient experiences across multiple time points during treatment. In recent years, the advent of network analytic approaches in clinical science has provided a new lens for considering such symptom-level relationships rather than relying on sum scores (Borsboom & Cramer, Reference Borsboom and Cramer2013). This approach emphasizes the multidimensionality of psychopathology and the interplay of observable components (e.g. symptoms) (McNally, Reference McNally2016). In this report, by considering treatment as a factor influencing the network of interacting symptoms, we can trace plausible direct and indirect therapeutic mechanisms (Blanken et al., Reference Blanken, Van Der Zweerde, Van Straten, Van Someren, Borsboom and Lancee2019). This novel perspective on symptom change in clinical trials could help to explain differential responses to treatment, inform treatment refinement and development, and guide more personalized, precision medicine. To improve patient care, we need to better understand how, when, and for whom different treatments and treatment components work.
This is the first report to use network intervention analysis to examine mechanisms of change in BDD. We use data from the only clinical trial comparing therapist-delivered CBT to SPT for BDD (Wilhelm et al., Reference Wilhelm, Phillips, Greenberg, O'Keefe, Hoeppner, Keshaviah and Schoenfeld2019). Comparing CBT to an active, alternative psychotherapy enables us to better isolate the unique effects of CBT rather than common factors of psychotherapy. Briefly, as previously reported, this trial found that CBT was significantly more effective than SPT at one treatment site but not the other; response rates at 24 weeks were 84.6% at one site and 83.3% at the second site for CBT, and 69.2% and 45.5% for SPT, respectively (Wilhelm et al., Reference Wilhelm, Phillips, Greenberg, O'Keefe, Hoeppner, Keshaviah and Schoenfeld2019). A network approach may provide additional nuance in understanding this outcome; the paths to recovery should look different with each treatment, given hypothesized differences in what the two treatments specifically target. For example, although CBT and SPT groups may not significantly differ in overall BDD severity at treatment midpoint, the different treatments may have been enacting meaningful changes in different symptoms, which may have set off distinct cascades of changes thereafter. More specifically, we would expect CBT to directly impact cognitive targets (willingness and ability to disengage from and restructure BDD-related thoughts) early in treatment and behavioral targets (reducing BDD repetitive and avoidant behaviors) later in treatment, in parallel with the order of CBT modules used in this study. In contrast, symptoms which are not as explicitly targeted by CBT skills, such as distress, may be more indirectly impacted by changes in other symptoms. Because SPT uses a nondirective approach, encouraging self-esteem and offering coping skills in response to patients' unique and ongoing stressors, it is challenging to predict the timing or nature of its impact. We, therefore, did not have a priori hypotheses about SPT mechanisms. Understanding how treatments differentially influence specific symptoms may help future clinicians better tailor interventions to individual presentations.
Method
Sample
The sample included 120 adult participants, the majority of whom identified as white and female (mean age = 34.0, s.d. = 13.1, range = 18–77). Demographics of the sample are included in Table 1. Eligible participants had a primary diagnosis of BDD (DSM-IV) with at least moderate severity (BDD-YBOCS score ≥ 24), did not express current active suicidality or other severe symptoms meriting a higher level of care per screening procedures and clinician judgment, did not evidence significant cognitive impairment (IQ ≤ 80, WASI), and did not present with a current substance use disorder, mania, psychosis, borderline personality disorder, or other illness that would interfere with participation. Participants had not previously had 10 or more sessions of CBT for BDD and were not currently receiving psychotherapy. Within the final sample, only four participants endorsed prior sessions of CBT (range = 3–8).Footnote †Footnote 1 Participants could continue taking psychotropic medications if doses were stable for at least 2 months prior to study entry and remained so for the study duration; they could not begin taking new psychotropic medication during the study.
Demographic characteristics of the sample

Procedure
CBT and SPT were administered as 22 weekly sessions over 24 weeks. The final two sessions were biweekly. All study procedures were approved by the institutional review boards at Massachusetts General Hospital and Rhode Island Hospital. All patients provided informed consent. Core CBT components included psychoeducation about BDD, goal setting, cognitive restructuring, advanced cognitive strategies to broaden the basis of self-worth and self-compassion, exposure and ritual prevention, mindfulness and attentional/visual retraining, and relapse prevention (Wilhelm, Phillips, & Steketee, Reference Wilhelm, Phillips and Steketee2013). SPT was enhanced, in that it also included psychoeducation about BDD; it was then nondirective, emphasized the therapeutic relationship, and focused on self-esteem, coping skills, and processing current life issues (Pinsker, Reference Pinsker1997). Assessments occurred at nine-time points: baseline (week 0), monthly during treatment (weeks 4, 8, 12, 16, 20, 24), and at 3- and 6-month follow-up visits (weeks 37 and 50). Of the 120 randomized participants, 92 individuals (76.7%) completed treatment.
The present report re-examines the trial's primary outcome variable, BDD severity, as measured by the Yale-Brown Obsessive–Compulsive Scale Modified for BDD (BDD-YBOCS; Phillips et al., Reference Phillips, Hollander, Rasmussen, Aronowitz, DeCaria and Goodman1997). The BDD-YBOCS is a 12-item rater-administered semi-structured scale with strong reliability and sensitivity to change (Phillips, Hart, & Menard, Reference Phillips, Hart and Menard2014). Items 1–5 assess appearance-related thoughts: time occupied, interference in functioning due to BDD thoughts, distress due to thoughts, resistance against thoughts (efforts to disregard, challenge, or turn attention from the thoughts), and control over thoughts (ability to successfully disengage from appearance-related thoughts). Items 6–10 assess BDD-related repetitive behaviors (rituals, compulsions), such as excessive mirror checking, skin picking, comparing with others, and excessive grooming, and are similar to items 1–5 (time spent performing the behaviors, interference in functioning due to the behaviors, distress experienced if the behaviors are/were prevented, and resistance of and control over the behaviors). Item 11 assesses BDD-related insight, and item 12 assesses overall BDD-related avoidance of activities, such as work or social activities. Higher scores reflect greater symptom severity (e.g. worse insight, more avoidance). Further details about the clinical trial are available in the primary outcomes paper (Wilhelm et al., Reference Wilhelm, Phillips, Greenberg, O'Keefe, Hoeppner, Keshaviah and Schoenfeld2019).
Data analysis
Nodes (i.e. variables), edges (i.e. pairwise connections between variables), and location (i.e. proximity of nodes in visual representations) are three core features of network analyses. In this report, nodes comprise BDD-YBOCS items and treatment allocation. Edges and locations are defined below. All analyses were conducted in R.
Data preparation
Before including any BDD-YBOCS items as unique nodes, we used the goldbricker function from the R package networktools (Bernstein, Heeren, & McNally, Reference Bernstein, Heeren and McNally2019; Jones, Reference Jones2018) to search for ‘redundant’ items. Specifically, this approach identifies pairs of items that are both highly intercorrelated (r > 0.50) and show highly similar patterns of relationships to other items (i.e. >85% of correlations with other items do not significantly differ for a pair) using the Hittner method for comparing dependent correlations (Hittner, May, & Silver, Reference Hittner, May and Silver2003). We identified interference from repetitive behaviors (BDD-YBOCS item 7) and BDD-related avoidance of life activities (item 12) as highly correlated and thus statistically redundant at baseline. Per the net_reduce function, redundancy was resolved by retaining avoidance as the more unique variable. Additionally, variables were roughly normally distributed (skewness ≤ 0.5, with the exception of resistance of repetitive behaviors (item 9) = 0.71), and therefore no variable transformations were conducted.
Network intervention analyses
Network intervention analysis allows for inspection of treatment-induced changes in specific symptoms over time and characterizes direct v. indirect treatment effects (Blanken et al., Reference Blanken, Van Der Zweerde, Van Straten, Van Someren, Borsboom and Lancee2019). First pioneered by Blanken and colleagues to examine the impact of CBT-I on insomnia and depression (compared to no treatment), this method has since been used in four studies of treatments for pediatric anxiety (Cervin et al., Reference Cervin, Storch, Piacentini, Birmaher, Compton, Albano and Kendall2020) and depression (Boschloo et al., Reference Boschloo, Cuijpers, Karyotaki, Berger, Moritz, Meyer and Klein2019; Curtiss et al., Reference Curtiss, Wallace, Fisher, Nyer, Jain, Cusin and Pedrelli2021; Mullarkey, Stein, Pearson, & Beevers, Reference Mullarkey, Stein, Pearson and Beevers2020). In the current report, networks were constructed for each assessment point. BDD-YBOCS items were entered into models as continuous variables. Each network also included an additional binary treatment allocation node.
Analyses followed the methods outlined by Blanken and colleagues (Blanken et al., Reference Blanken, Van Der Zweerde, Van Straten, Van Someren, Borsboom and Lancee2019). At each time point, we used the package mgm (Haslbeck & Waldorp, Reference Haslbeck and Waldorp2020) to compute mixed graphical models (MGMs), which depict pairwise associations among nodes and control for effects of all other nodes (Epskamp & Fried, Reference Epskamp and Fried2018). Graphical LASSO (Least Absolute Shrinkage and Selection Operator) was used to regularize models (Friedman, Hastie, & Tibshirani, Reference Friedman, Hastie and Tibshirani2011). Following Blanken and colleagues, we used the data-driven cross-validation approach to select the tuning parameter and therefore to determine the extent of regularization. We used ten folds and mean squared error as a goodness-of-fit metric. In the resulting networks, thicker edges correspond to larger partial correlations. To ease comparison across networks, we adjusted all layouts to be similar. Therefore, the relative proximity of nodes in a given network should not be overinterpreted. Instead, the resulting layout reflects the average across all networks, so that nodes that are closest together are generally the most highly intercorrelated across all time points; however, they are not necessarily the most highly intercorrelated at any one-time point. We also computed strength centrality indices to further approximate the relative importance of each node within the overall network. Values reflect the sum of the edge weights connected to each node. Higher values indicate greater centrality and thus greater potential importance.
The relative size of a node signifies differences in changes in symptom severity from baseline by treatment. We standardized item means for each time point using pooled baseline means and standard deviations. Consequently, negative values indicate declines in symptom severity, and positive values indicate increases in severity. We then computed differences between the treatment groups. Looking across time points allows us to observe the progression of treatment-induced changes.
To evaluate the accuracy of edge weight estimates (i.e. the magnitude of associations between nodes), we used the resample function from the mgm package. For each network, we ran 100 bootstrap samples and plotted the resulting 5% and 95% quantiles of the distribution. The proportion of non-zero edge weight estimates were also reported. Regularization used during network estimation notably biases all sampling distributions toward zero. Consequently, 5% and 95% quantiles including zero are not concerning (Blanken et al., Reference Blanken, Van Der Zweerde, Van Straten, Van Someren, Borsboom and Lancee2019).
Results
Network estimation
Figure 1 shows the nine regularized networks estimated for each assessment point. Circular nodes indicate items from the BDD-YBOCS, and the square node indicates treatment (CBT or SPT). Edges between nodes represent conditional dependence relations, or the unique associations among the variables controlling for all the other variables in the network.
Regularized networks by assessment point. Note. Pre-treatment = week 0 (n = 120). Treatment = weeks 4 (n = 107), 8 (n = 97), 12 (n = 89), 16 (n = 88), 20 (n = 87), and 24 (n = 92). Post-treatment = weeks 37 (n = 84) and 50 (n = 74). Node colors are as follows: yellow = thoughts, blue = behaviors, pink = insight, white = treatment. Nodes reflect treatment condition and BDD-YBOCS items: Tx = Treatment assignment. ThTim = time occupied by thoughts. ThInt = interference due to thoughts. ThDis = distress due to thoughts. ThRes = resistance of thoughts. ThCon = degree of control over thoughts. BeTim = time spent in repetitive behaviors (i.e. rituals, compulsions) related to body defects. BeDis = distress if repetitive behaviors are/were prevented. BeRes = resistance of repetitive behaviors. BeCon = degree of control over repetitive behaviors. Avoid = avoidance of life activities due to BDD. Insig = BDD-related insight. Higher scores indicate more severe symptoms (e.g. more avoidance, worse insight). Note that items 7 (interference in functioning due to repetitive behaviors) and 12 (avoidance) were collapsed as statistically redundant nodes. Edges (lines) represent pairwise associations. Green edges between symptom (circular) nodes = positive associations. Red edges between symptom nodes = negative associations. Green edges between the binary treatment (Tx; square) node and symptom nodes = CBT associated with more severe symptoms than SPT. Red edges between the binary treatment (Tx; square) node and symptom nodes = CBT associated with less severe symptoms than SPT. Node size reflects the relative difference between treatments in change since baseline. Bigger size = CBT associated with greater symptom improvement than SPT. Smaller size = CBT associated with less symptom improvement than SPT. The size of node ThTim at week 1 reflects a negligible difference between groups.
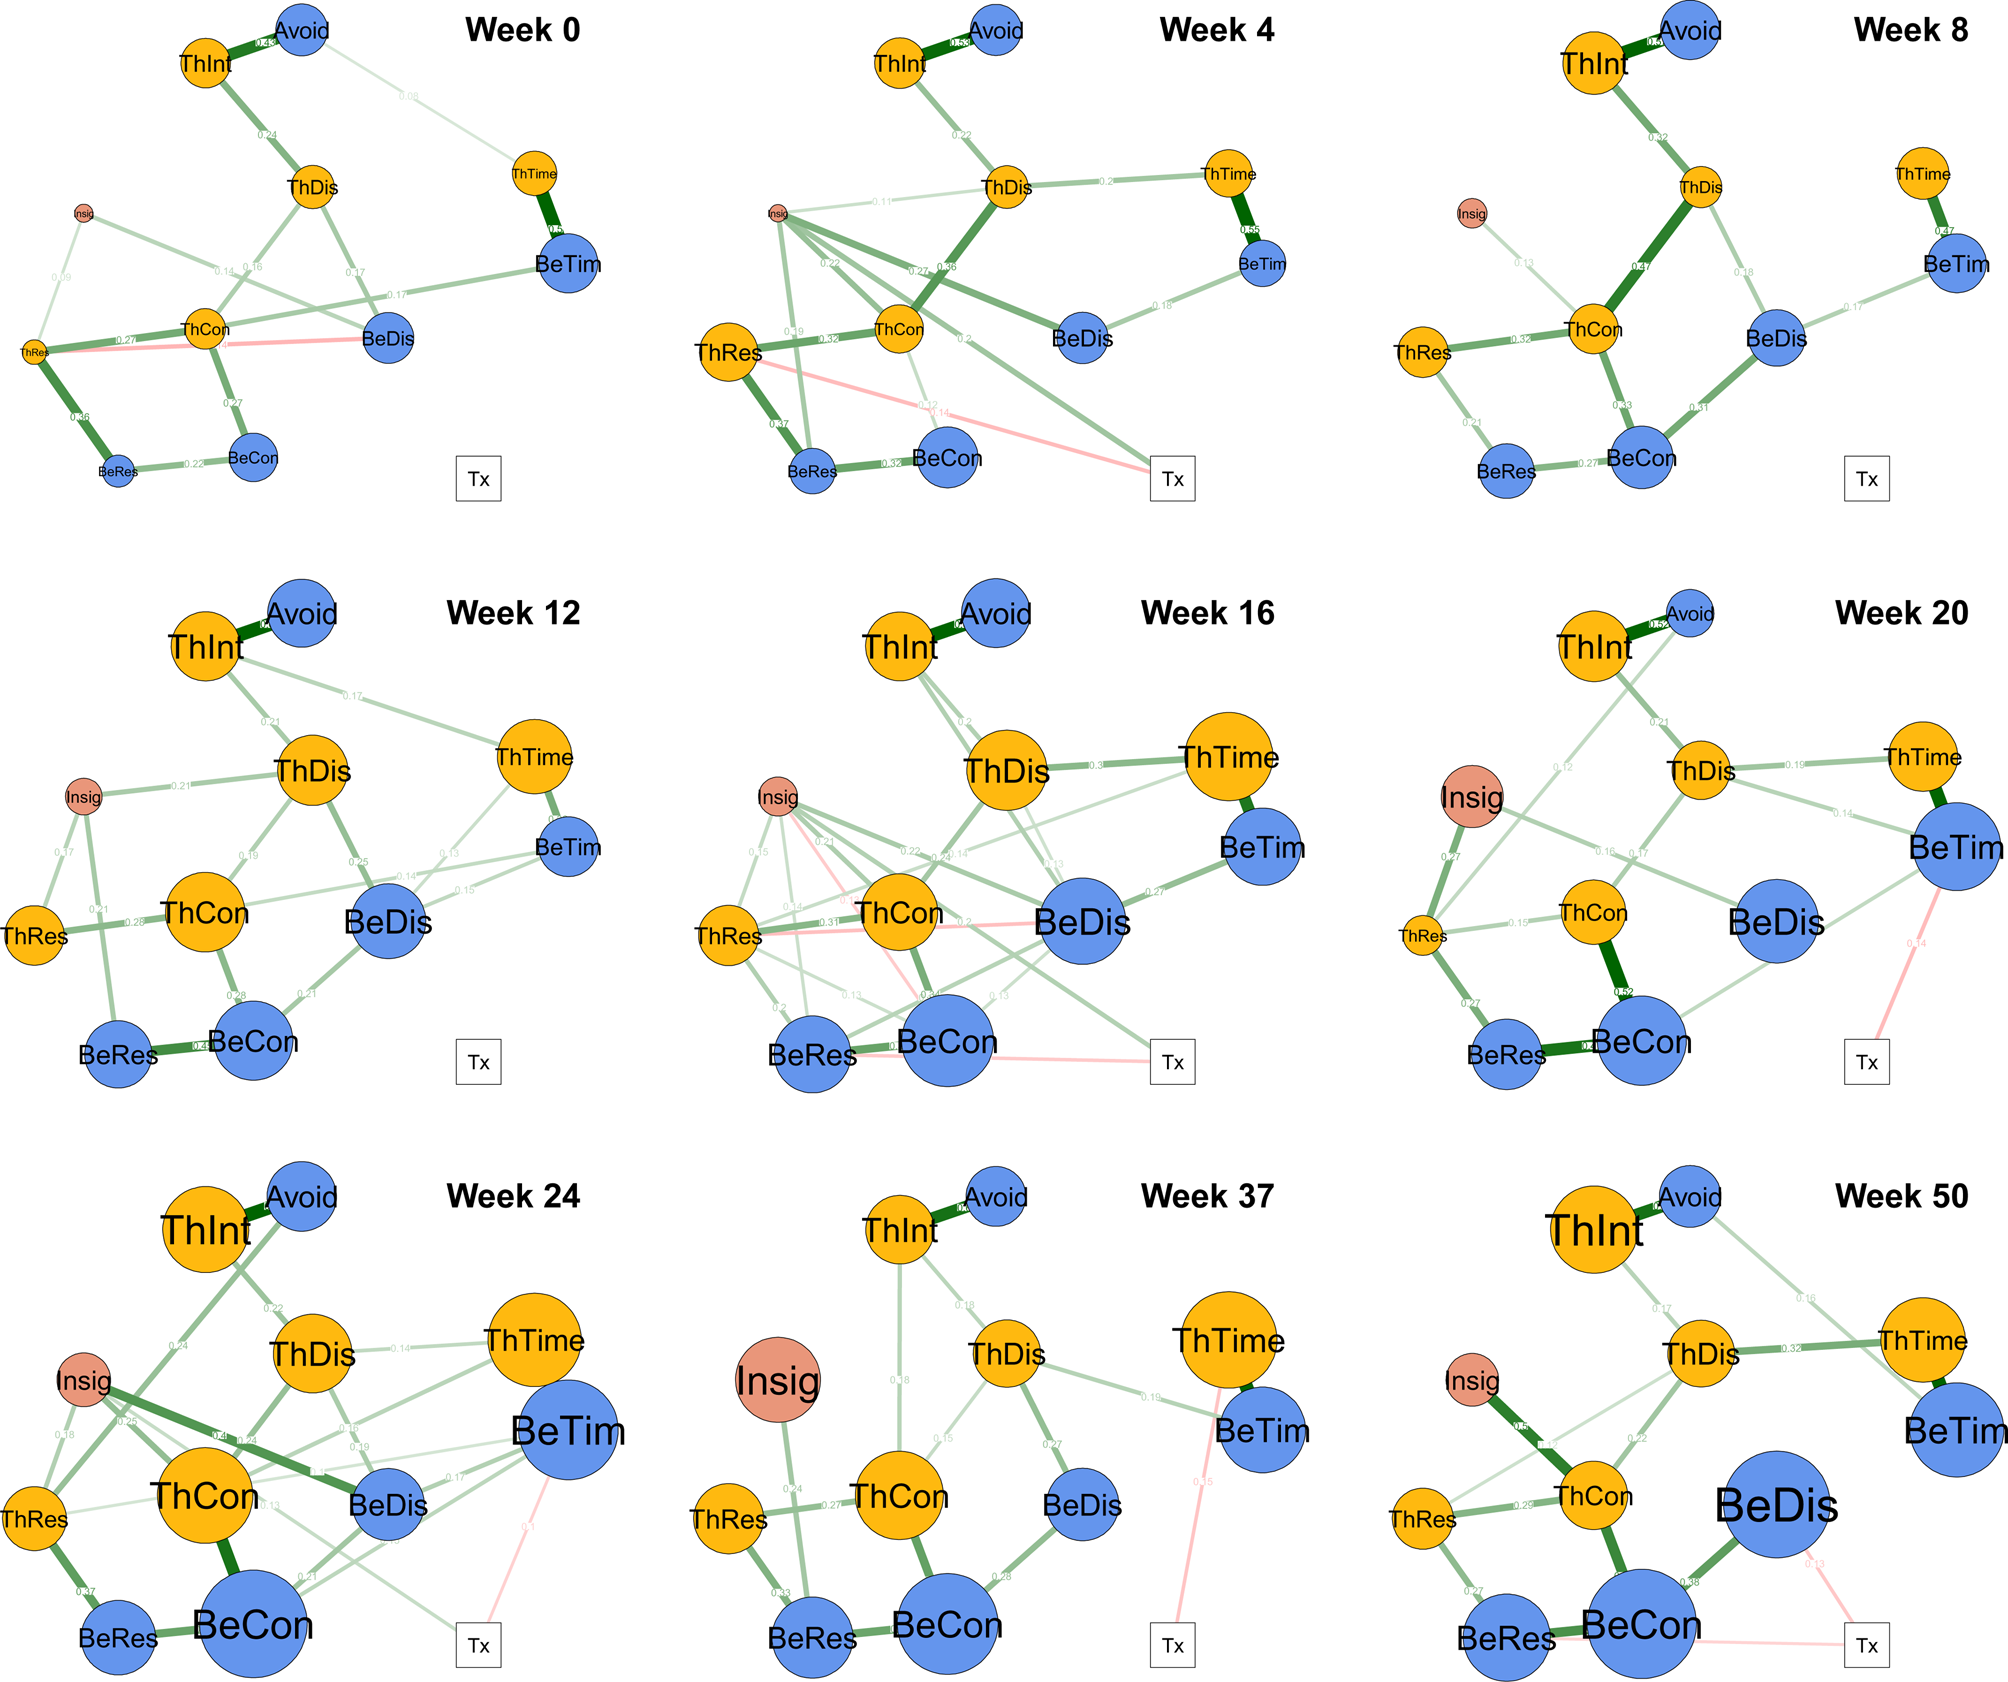
In Fig. 1, among circular nodes, green edges (lines) represent positive associations, and red edges represent negative associations. Edge thickness is proportional to the relative strength of the association. For example, the most consistent and largest positive associations across time points are between interference from thoughts (ThInt; BDD-YBOCS item 2) and avoidance of life activities (Avoid; item 12) as well as between time occupied by appearance-related thoughts (ThTim; item 1) and time occupied by BDD repetitive behaviors (BeTim; item 6). Moderate associations were consistently identified connecting resistance and control, both for thoughts and behaviors, and between control of thoughts and distress related to thoughts. Interestingly, connections emanating from poor insight (Insig; item 11) were highly variable in terms of strength and destination. With few exceptions, edges among BDD-YBOCS items were green, indicating positive associations.
For edges between the square treatment node and circular symptom nodes, green indicates that relative to SPT, CBT is associated with more severe symptoms, and red indicates that CBT is associated with less severe symptoms (see Fig. 1). As would be expected, treatment allocation was unrelated to symptoms at week 0 (pre-treatment). During active treatment, relative to SPT, CBT was associated with more thought resistance at week 4 (ThRes; item 4), more repetitive behavior resistance at week 16 (BeRes; item 9), and less time spent engaged in repetitive behaviors at week 20 and 24 (BeTim; item 6). SPT was associated with greater insight at weeks 4, 16, and 24 (Insig; item 11). During follow-up, relative to SPT, CBT was associated with less time engaged in BDD thoughts at week 37 (ThTim; item 1), and less distress and more resistance related to BDD repetitive behaviors at week 50 (BeDis and BeRes; items 8 and 9) (see Fig. 1).
Strength centrality estimates for symptom nodes are depicted in online Supplementary Fig. S1. Metrics support that early in treatment cognitive nodes are most central, later in treatment behavioral modes are most central, and after treatment control of thoughts and behaviors is most central. In contrast, insight exhibits inconsistent, and often low, centrality across time.
Group differences in symptom change
Node size corresponds to the relative difference in symptom severity change between CBT and SPT groups from baseline. Larger size indicates that the CBT group experienced greater improvement in a given symptom than the SPT group; smaller size indicates that the SPT group experienced greater improvement. Group differences are visualized in Fig. 1 and summarized in Table 2. Average symptom levels by group and over time are visualized in online Supplementary Fig. S2. Although standardized group differences are small for a number of items, particularly in early weeks, a few notable trends stand out. First, as expected there is no clear pattern to the direction of group differences at week 0. However, as treatment progressed, with the exception of poor insight (particularly earlier in treatment), observed differences in symptom change consistently trend in favor of CBT, including during post-treatment weeks. Interestingly, node size for control of thoughts (item 5), time engaged in thoughts (item 1), control of repetitive behaviors (item 10), and time engaged in repetitive behaviors (item 6) grow most robustly across treatment, particularly in the latter assessments, indicating that CBT was particularly efficacious for these symptoms relative to SPT.
Group differences in changes in BDD-YBOCS item severity over time

Note. Standardized change scores were computed at each week (e.g. week 0 to week 4 change in time occupied by BDD-related thoughts in the CBT and SPT groups respectively). Differences in changes between the two groups were then calculated. Values indicate the magnitude of difference between the groups, rather than the magnitude of change for any individual group. A value of 0 indicates that the CBT and SPT group exhibited the same degree of change. Positive values indicate that the SPT group reported larger declines in symptom severity from baseline than the CBT group. Negative values indicate that the CBT group reported larger declines in symptom severity from baseline than the SPT group. ThTim = time occupied by thoughts. ThInt = interference due to thoughts. ThDis = distress due to thoughts. ThRes = resistance of thoughts. ThCon = degree of control over thoughts. BeTim = time spent in repetitive behaviors related to body defects. BeDis = distress if repetitive behaviors are/were prevented. BeRes = resistance of repetitive behaviors. BeCon = degree of control over repetitive behavior. Insig = insight. Avoid = avoidance behavior/interference. Item 7 (interference in functioning due to repetitive behaviors) is not included given its redundancy with avoidance behavior.
Edge weight accuracy
Plots depicting 5% and 95% quantiles of the sampling distributions and proportion of estimates whose values are nonzero are included in online Supplementary Figs. S3–S11. Keeping in mind the bias toward zero, edge weights surviving regularization and appearing in the estimated networks were adequate. With the present sample size and relatively narrow range of estimated edge weights, we do not overinterpret the ordering of edge weights (Burger et al., Reference Burger, Isvoranu, Lunansky, Haslbeck, Epskamp, Hoekstra and Blanken2020).
Discussion
Analyses support that CBT and SPT differentially target-specific BDD symptoms. The strongest observed differences were that CBT was directly associated with more adaptive efforts to relate to one's thoughts and behaviors (e.g. challenge or disengage from unhelpful thoughts, resist the urge to ritualize) than SPT, while SPT was directly associated with better BDD-related insight earlier in treatment than CBT. However, greater improvements in insight began emerging later in treatment and during follow-up among participants in the CBT group compared to the SPT group (Table 2 and online Supplementary Fig. S2).
The time course of these differences aligns with the intended targets of CBT. Specifically, cognitive effects emerged first and behavioral effects second, paralleling the use of cognitive restructuring in earlier CBT sessions and the emphasis on exposure and ritual prevention in later sessions. Furthermore, direct effects on efforts to resist repetitive behaviors emerged before reduced time spent engaged in such behaviors. In other words, compared to SPT, CBT could be eliciting greater awareness of maladaptive behavioral patterns (rituals) and willingness to reduce them; following this shift, patients receiving CBT could subsequently also be more likely to ultimately succeed in ritual reduction. Although more idiographic work is needed, these patterns lend support to the hypothesized mechanisms of CBT's therapeutic effects, namely that CBT changes two key maintenance factors: maladaptive BDD-related beliefs and BDD rituals (Fang et al., Reference Fang, Steketee, Keshaviah, Didie, Phillips and Wilhelm2020; Wilhelm, Buhlmann, Hayward, Greenberg, & Dimaite, Reference Wilhelm, Buhlmann, Hayward, Greenberg and Dimaite2010).
Findings support including both cognitive and behavioral strategies when treating BDD. However, more work that isolates each individual treatment component further is merited. With current treatment protocols, it is difficult to capture the extent to which observed behavioral changes are only direct products of later behavioral modules v. are secondary to earlier cognitive changes. Moreover, the unique treatment effects of CBT v. SPT did not emerge as consistently or pervasively as one might have expected. Thus, we cannot overlook the meaningfulness of shared factors, such as validating patients' experiences and still encouraging them to reexamine their symptoms, with or without a theoretical model for doing so. More importantly, this should push researchers to examine for whom a given intervention is more likely to lead to positive change and consider more idiographic, process-focused approaches to mapping changes across treatment. This level of analysis could ideally uncover specific treatment strategies to target specific change processes and conditions under which they work best.
Still, results seem to highlight the unique impact of the behavioral components of CBT, compared to SPT, in reducing rituals. The observed treatment differences in favor of CBT were particularly strong for behavioral targets. In practice, formally specifying and countering repetitive behaviors is the most significant difference between CBT and SPT. Although SPT does not involve explicit instruction in cognitive models or skills, its emphasis on self-esteem and processing life issues could potentially, to some degree, resemble CBT skills of increasing cognitive flexibility and modifying core beliefs, which for many patients include beliefs about self-worth. It is worth noting, however, that high levels of treatment fidelity were attained during the study, indicating that therapists providing each treatment did not use strategies from the other treatment (Wilhelm et al., Reference Wilhelm, Phillips, Greenberg, O'Keefe, Hoeppner, Keshaviah and Schoenfeld2019). Results support that CBT and SPT provide distinct therapeutic benefits beyond any shared, or common, factors.
Interestingly, direct effects of treatment allocation (i.e. number and magnitude of edge weights between the treatment node and symptom nodes) were moderate, with some of the strongest outcomes favoring CBT emerging as indirect effects. Findings bolster our confidence that CBT is effective in modifying patients' relationships to their thoughts and rituals, aligning with the suggestion that treatment-induced repeated practice (e.g. resisting rituals) is ultimately what leads to decreases in distress, increased control, self-efficacy, and functioning. It also highlights areas requiring more research, namely to replicate and further explain how these downstream cascades in symptom improvement occur. For example, more work is needed to understand how practicing stepping back from and evaluating unhelpful thoughts ultimately translates to the thoughts themselves being less distressing; in the present data, it is unclear to what extent thought content changes to be inherently less negative or whether patients have less negative or intense reactions to the same thoughts (e.g. understanding that the thoughts are less important or valid than previously believed, or cultivating greater acceptance or tolerance of painful thoughts without trying to modify their meaning), or both. These next steps would further inform specific targets for enhancing treatment outcomes.
Results are consistent with the main findings of the trial showing that CBT was significantly more effective than SPT for response rates at one of the two treatment sites (Wilhelm et al., Reference Wilhelm, Phillips, Greenberg, O'Keefe, Hoeppner, Keshaviah and Schoenfeld2019). Current results may also shed light on why SPT still conferred benefits for some patients and CBT may not have markedly benefited all patients. In this way, results could reveal important directions for trying to improving BDD treatments, including when and how to better directly address poor insight and do so earlier in treatment. A majority of individuals with BDD, including in this trial, display poor insight, and more than one-third present with absent insight (i.e. delusional beliefs) about their appearance (Eisen, Phillips, Coles, & Rasmussen, Reference Eisen, Phillips, Coles and Rasmussen2004). More work is needed to fully understand treatment interference and malleability of poor insight. This report does not provide a clear picture. Some (but not all) past clinical trials have found that poorer BDD-related insight predicts worse outcomes (Greenberg, Phillips, Steketee, Hoeppner, & Wilhelm, Reference Greenberg, Phillips, Steketee, Hoeppner and Wilhelm2019). Notably, CBT has been shown to improve BDD-related insight in prior studies (Enander et al., Reference Enander, Andersson, Mataix-Cols, Lichtenstein, Alström, Andersson and Rück2016; Wilhelm et al., Reference Wilhelm, Phillips, Didie, Buhlmann, Greenberg, Fama and Steketee2014). And in the primary report from this study, patients in the CBT group did report improvements in insight overall (Wilhelm et al., Reference Wilhelm, Phillips, Greenberg, O'Keefe, Hoeppner, Keshaviah and Schoenfeld2019); in fact, later in the study and at post-treatment follow-up, these changes were trending in favor of the CBT group (Table 2 and online Supplementary Fig. S2).
Poor insight was strongly, although inconsistently, connected to other symptoms throughout the study. Consequently, there are not well-defined hypotheses for how poor insight maintains BDD or how and when it is best to intervene based on the present results. One possibility is that poor insight interferes with motivation or general engagement with learning skills, or leads to greater ‘white knuckling’ (tensely pushing through an exposure) or other ineffective ways of resisting BDD rituals (Abramowitz, Reference Abramowitz2006; Foa, Abramowitz, Franklin, & Kozak, Reference Foa, Abramowitz, Franklin and Kozak1999). It seems plausible that if all therapists could more directly and effectively address insight earlier in treatment more robust, reliable outcomes could emerge (Eisen et al., Reference Eisen, Phillips, Coles and Rasmussen2004). Enhancing attentional/perceptual retraining may be promising, as visual processing aberrations likely contribute to poor/absent insight in BDD (Li et al., Reference Li, Lai, Bohon, Loo, McCurdy, Strober and Feusner2015; Phillips, Reference Phillips2017). Drawing from the OCD literature, more tailored exposure strategies and integration of motivational interviewing techniques should also be tested (Maltby & Tolin, Reference Maltby and Tolin2005; Middleton & Hezel, Reference Middleton and Hezel2019). Furthermore, understanding how SPT achieves earlier shifts in insight could provide meaningful guidance, such as adding a supportive, insight-focused module to accompany psychoeducation. For example, SPT's early emphasis on coping (e.g. social support) and enhancing self-esteem, which is typically low in BDD (Phillips, Pinto, & Jain, Reference Phillips, Pinto and Jain2004), might have led to sooner shifts in insight.
Although attempting to change insight is not a major focus of the CBT used in this study, the psychoeducational, motivational, cognitive restructuring, behavioral experiments, and attentional/perceptual retraining strategies are expected to have positive effects on BDD-related insight. However, present results suggest that this improvement later in treatment and post-treatment may have been less a direct consequence of treatment, evidenced by the absence of a positive direct effect of CBT treatment allocation, and instead be better accounted for by larger shifts in other symptoms or overall severity, similar to patterns observed in OCD (Eisen et al., Reference Eisen, Rasmussen, Phillips, Price, Davidson, Lydiard and Piggott2001). For example, more avoidance behavior and less willingness to engage in exposure and ritual prevention tend to strongly correlate with low insight; through behavioral experiments and ritual prevention, however, patients directly approach feared situations and with repetition often realize that their beliefs are unreliable or ineffective (Foa et al., Reference Foa, Abramowitz, Franklin and Kozak1999; Selles et al., Reference Selles, Højgaard, Ivarsson, Thomsen, McBride, Storch and Stewart2020).
Based on our results, we hypothesize that CBT yielded more consistent positive outcomes because the symptoms it directly targets are more widely and consistently connected to others. For example, treatment allocation appeared to most directly impact resistance of BDD thoughts and behaviors, signified by the direct edges between the treatment node and the two resistance nodes. Indirect effects, or ostensible benefits of CBT via the above direct connections, then emerged particularly toward the end of treatment; CBT increasingly outweighed SPT in positive changes in control over thoughts and behaviors and reduced time spent on BDD-related thoughts and rituals. Results suggest that CBT could lead to these later sustained advantages for control and time through its earlier impact on efforts to resist (Wilhelm et al., Reference Wilhelm, Phillips and Steketee2013). In this way, positive downstream cascades (e.g. from awareness of rituals to successful control and less time engaged in them) and thus broader recovery could be more likely, in line with the CBT model. No such evidence of specific cascading effects was evident for SPT or insight. Strength centrality estimates further align with this interpretation as cognitive processes were most central early in the trial and behavioral processes later in the trial.
Regarding limitations, it is unlikely that the BDD symptom variables selected in this report perfectly capture all variables relevant to understanding how CBT or SPT benefits some patients more than others. The BDD-YBOCS largely assesses appearance-related beliefs and repetitive behaviors, which could bias current results to illuminating the positive effects of receiving CBT. For example, other variables of interest for future study could include attention, visuospatial, or other related performance metrics (Buhlmann, McNally, Wilhelm, & Florin, Reference Buhlmann, McNally, Wilhelm and Florin2002); neurobiological factors (Grace, Labuschagne, Kaplan, & Rossell, Reference Grace, Labuschagne, Kaplan and Rossell2017); or self-esteem (Buhlmann, Teachman, Gerbershagen, Kikul, & Rief, Reference Buhlmann, Teachman, Gerbershagen, Kikul and Rief2008). Also, the diversity of the sample was limited in terms of race, ethnicity, and gender. Future studies are needed to understand whether the current findings generalize beyond the present group. Additionally, as we favored robust effects and minimizing false positives, it is possible that models missed some small treatment effects or associations between nodes. Thus, edges should be interpreted as compelling pathways to be followed up on rather than the only possible pathways. We hope this work will motivate further, a more targeted study of individual components of treatment. A strength of this work is the inclusion of longitudinal data. However, because this statistical approach is quite young, we have yet to determine the optimal timescale at which to examine treatment effects.
In conclusion, this approach sheds light on how two very different psychotherapeutic approaches affect BDD outcomes. Although additional research designed for network analyses is required to replicate findings and resolve remaining questions and limitations from this initial examination, this approach is promising. Ultimately, understanding how treatment effects unfold over time can help clinicians set clearer expectations for patients and enhance treatment credibility. This breakdown could aid in refining or reorganizing modular treatments to better fit patient needs, as we could be more confident regarding what factors treatment components are directly influencing. By considering patient experiences at the symptom level and at multiple intervals, we could ideally identify patterns of symptoms that predict better responses to one treatment over the other. This line of work could support more precision or personalized medicine.
Supplementary material
The supplementary material for this article can be found at https://doi.org/10.1017/S0033291721004451.
Acknowledgements
The research was supported by a Collaborative R-01 grant from the National Institute of Mental Health to Dr Wilhelm (R01MH091078) and Dr Phillips (R01MH091023) and a grant from the David Judah Fund to Drs. Phillips and Wilhelm. This study was also supported, in part, by the Hope Fund (Dr Bernstein).
Conflict of interest
Emily E. Bernstein: None.
Katharine A. Phillips: Dr Phillips has received book royalties from Oxford University Press/International Creative Management, Inc., Guilford Press, and American Psychiatric Publishing. She has received writing royalties from UpToDate/Wolter's Kluwer, writing honoraria from Merck Manual, and scale use fees from Nview Health. She has also received speaking honoraria from academic institutions and professional organizations, and she is on the Advisory Board of Nview Health.
Jennifer L. Greenberg: Dr Greenberg has received salary support from Telefónica Alpha, Inc. and is a presenter for the Massachusetts General Hospital Psychiatry Academy in educational programs supported through independent medical education grants from pharmaceutical companies.
Joshua Curtiss: None.
Susanne S. Hoeppner: None.
Sabine Wilhelm: Dr Wilhelm is a presenter for the Massachusetts General Hospital Psychiatry Academy in educational programs supported through independent medical education grants from pharmaceutical companies; she has received royalties from Elsevier Publications, Guilford Publications, New Harbinger Publications, Springer, and Oxford University Press. Dr Wilhelm has also received speaking honoraria from various academic institutions and foundations, including the International Obsessive–Compulsive Disorder Foundation, Tourette Association of America, and Brattleboro Retreat. In addition, she received payment from the Association for Behavioral and Cognitive Therapies for her role as Associate Editor for the Behavior Therapy journal, as well as from John Wiley & Sons, Inc. for her role as Associate Editor on the journal Depression & Anxiety. Dr Wilhelm has also received honoraria from One-Mind for her role in PsyberGuide Scientific Advisory Board. Dr Wilhelm has received salary support from Novartis and Koa Health.