INTRODUCTION
Nitrogen (N) is the single most important yield-promoting (as opposed to essential, e.g. water, or yield-protecting, e.g. agro-chemicals) input in grassland, arable cropping and horticulture across the world. Some N is available in the soil but this is often supplemented by applications of organic manures and inorganic fertilizers. Various methods for assessing the amount of N to be provided have been developed with varying, although sometimes unknown, effects on the efficiency of N use by the crops. In the UK, fertilizer N recommendations for cereal species in the Department for Environment, Food and Rural Affairs (Defra) Fertilizer Manual (Anon. 2010) and its predecessor, RB 209 (Anon. 2000), are based on the concept of the economic optimum rate of N (Nopt). The economic optimum is defined as the rate of applied N where the value of the increase in yield equals the cost of the increment in fertilizer applied and beyond which additional N would not repay its cost (Sylvester Bradley et al. Reference Sylvester-Bradley, Dampney, Murray, Needham, Archer, Sylvester-Bradley and Goodlass1984). Prices of grain and N have been taken into account in the recommendations, being calculated for an N:grain price ratio (break-even ratio) of 5 in the Fertilizer Manual (recommendations in RB 209 were at an N:grain price ratio of 3). Growers are able to adjust for changes in the prices of grain and N for the first time using a table included in the Fertilizer Manual. Nitrogen and grain prices vary continuously during the growing season and so adjusting for changes is only useful within broad limits. Indeed Kindred & Sylvester-Bradley (Reference Kindred and Sylvester-Bradley2010) stated that over the range 3–9 in N:grain price ratio, an increase of 1 increases Nopt by c. 10 kg/ha.
The impact of departing from optimum N on yield has been illustrated in an HGCA report (Anon. 2009). According to the generalized response used, yield is reduced by c. 1 t/ha at 100 kg N/ha less than the optimum. At 100 kg N/ha more than the optimum, yield may be 0·2–0·3 t/ha higher, but this additional yield will not be sufficient to pay for the additional N applied. Uncertainty in estimating the amount of N provided by the soil is credited with failure of the assessment of fertilizer N requirement using the RB 209 Fertilizer Recommendations (Anon. 2000) to fall within 50 kg/ha of the optimum in 25 out of 50 fields. More recently Kindred & Sylvester-Bradley (Reference Kindred and Sylvester-Bradley2010) conceded that determination of Nopt is ‘generally imprecise’.
Some of the variation in response to fertilizer N, that apportioned to the soil N supply, soil type and the amount of winter rainfall, has been incorporated into the recommendations, but much variation remains unaccounted for. Sylvester-Bradley & Kindred (Reference Sylvester-Bradley and Kindred2009) found that with ‘old’ and ‘new’ cultivars (cvars) of wheat, but not barley, the cvar contributed to variation in Nopt. Their examination of yield responses to total available N, i.e. including the soil N supply along with the applied fertilizer N, using 129 valid responses for winter wheat from 31 experiments illustrates the extent of variation due to season, site and cvar. The regression fitted to the optima accounted for 0·33 of the variation in Nopt and the optimum N rate increased by 20·5 kg N/t grain yield.
Grain N concentration is considered to be a relatively constant parameter indicating optimum availability of N to the crop. Sylvester-Bradley et al. (Reference Sylvester-Bradley, Kindred, Blake, Dyer and Sinclair2008) affirmed that grain N concentrations at the optimum N rates in winter wheat were ‘relatively stable’ at 20 mg/g. However, they also calculated the effect of changes in the N:grain price ratio on grain N concentration at Nopt from the 28 wheat N response trials included in their report, stating that ‘it could be misleading to assume that grain N% at Nopt should be close to 2% on every field’, and cautioned about using grain N concentration on an individual field basis as an indicator of Nopt because of its variability. Sylvester-Bradley & Clarke (Reference Sylvester-Bradley and Clarke2009) concluded that grain N concentration could be used to indicate whether crops had been under- or over-fertilized in c. 0·70–0·80 of cases. They reported that ‘the main uncertainty in determining grain N% was in determining Nopt’ itself. Yield did not contribute to explaining variation in grain N concentration at Nopt, and cvar, previous crop and soil type contributed less than 0·30 of the variation in grain N concentration. The guideline grain N concentration has been adjusted to 19 mg/g in feed wheat and 21 mg/g in bread-making wheat in the Fertilizer Manual (Anon. 2010) because the increase in the N:grain price ratio from 3 in RB 209 (Anon. 2000) to 5 resulted in a lower Nopt and therefore lower fertilizer N recommendations. The guidance given is for growers to determine N concentration in the grain from a number of their crops over a number of years and use this to increase or decrease the fertilizer N applied by 30 kg N/ha per 1 mg/g difference in grain N concentration. Orson (Reference Orson2010), however, challenged the value of using grain N concentration as a tool to adjust the amount of fertilizer to be applied.
The last rigorous examination of response of winter wheat to N in Northern Ireland was in the early 1990s (Easson Reference Easson1995). In the present paper, responses of yield and N concentration in the grain of winter wheat to N are reviewed in experiments in Northern Ireland using more modern cvars. The objective is to develop a decision-making process for N application that is both reliable and takes into account the variation and uncertainty in the assumptions included in the Fertilizer Manual (Anon. 2010), in yield responses to N, in the economics relating to grain price and cost of fertilizer and in crop growing conditions.
MATERIALS AND METHODS
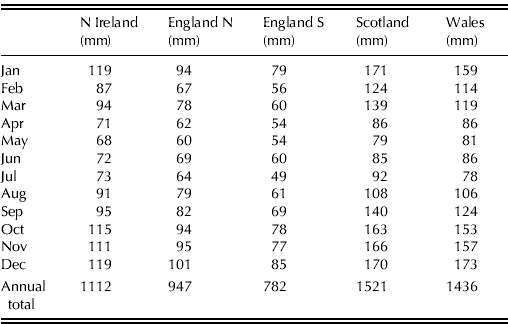
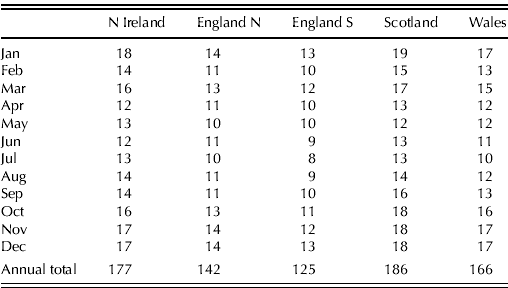
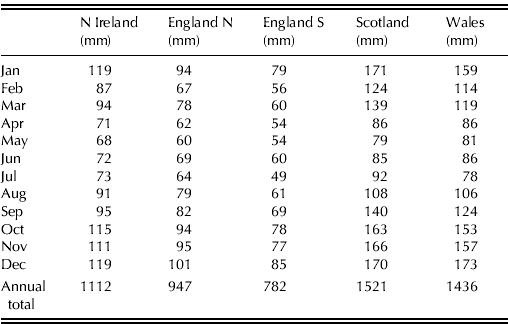
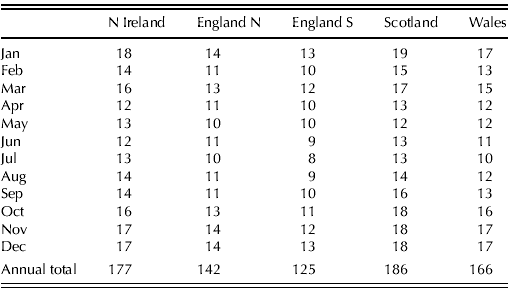
Field experiments were conducted in 2007, 2008 and 2009 at the Agri-Food and Biosciences Institute (AFBI) Crossnacreevy Plant Testing Station, south-east of Belfast, Northern Ireland (54°32′N, 5°53′W, 400 m asl). UK Met Office long-term monthly total rainfall data for areas within the UK show that while Northern Ireland is less wet than Scotland and Wales, it is wetter in every month than both northern and southern England, and particularly so in the winter months from October to March inclusive (Table 1) (Anon. 2011a,b). Long-term data on the numbers of days when rainfall is ⩾1 mm suggest that Northern Ireland is more similar to Scotland and Wales based on this weather characteristic and less similar to northern and southern England (Table 2) (Anon. 2011a,b). The UK Met Office annual rainfall map provides a more detailed picture of variation throughout Northern Ireland, with total annual rainfall exceeding 700 mm everywhere in the province (Anon. 2011b). In contrast, total annual rainfall in the east of England exceeds 1000 mm only in the North York Moors (Anon. 2011a).
Long-term (1971–2000) monthly total rainfall (mm) for the UK (source: UK Met Office website)
Long-term (1971–2000) numbers of days with rainfall ⩾1.0 mm for the UK (source: UK Met Office website)
The winter wheat cvars Alchemy and Robigus were chosen to represent the range among winter wheat cvars in rate of development, information which is routinely provided in the HGCA UK Recommended List (Anon. 2011c). Alchemy is a slow-developing cvar, reaching GS31 (Zadoks et al. Reference Zadoks, Chang and Konzak1974) later than Robigus, which is fast developing.
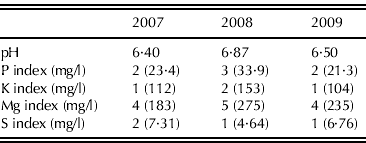
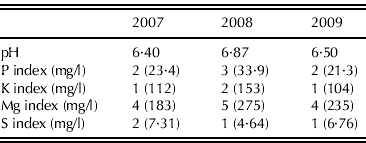
The experimental design in 2007 and 2008 was a randomized block design with 16 N treatments and three replications. Each plot comprised three drilled sub-plots, each 1·5 m wide with 10 rows at 0·12 m spacing and c. 12 m in length. The two outer sub-plots were included as buffers in case of migration of applied fertilizer N between plots. These sub-plots were also used for sub-sampling during the growing season. The central sub-plot was left undisturbed to be harvested by combine for grain yield. In 2009, a split-plot design was used with N treatments as main plots and cvars as sub-plots. Four drilled sub-plots comprised each main plot, two of each cvar. The outer sub-plots were used for sub-sampling and as buffers and the two inner sub-plots were saved for harvest and grain yield. The target plant population was 250/m2 and seed rate took into account the mean grain weight (MGW) and seed germination of the cvars and an assumed proportion of seeds producing established plants of 0·90. Phosphorus and potassium fertilizer were applied as required based on soil analyses and followed the recommendations in RB 209 (Anon. 2000; Table 3). Fungicide and plant growth regulator applications followed those for the UK winter wheat cvar trials as laid down in HCGA protocols with the aim of minimizing disease and straw damage through lodging and leaning (Anon. 2011d). Herbicides were also applied.
Soil chemical parameters in the three experiments
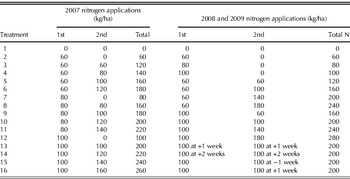
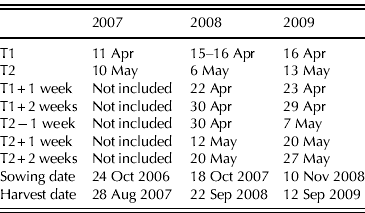
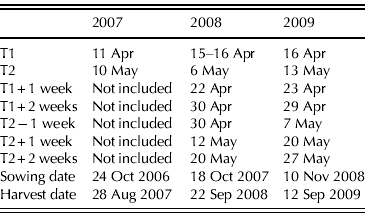
The N treatments in 2007 comprised a range of amounts from 0 to a total of 260 kg N/ha. These were applied as two topdressings using a Sisas plot fertilizer calibrated for each amount. The first top dressing, T1, was of 0, 60, 80 or 100 kg N/ha. The second top-dressing, T2, was of amounts ranging from 60 to 160 kg/ha in 20 kg/ha increments. Where 60 kg N/ha had been applied at T1, the rates at T2 varied from 60 to 120 kg N/ha, where 80 kg/ha were applied at T1, 80–140 kg N/ha were applied at T2 and where 100 kg N/ha were applied at T1, 100–160 kg N/ha were applied at T2. Each of the T1 rates also received no fertilizer N on the second occasion. The N treatments changed in 2008 and 2009 to include some timing options and the maximum amount applied was increased to 280 kg N/ha. The four additional timing treatments were all total applications of 200 kg N/ha and comprised delaying both T1 and T2 by 1 and 2 weeks. The T2 application alone was also advanced by 1 week and delayed by 1 week in two further timing treatments. Details of all treatments are presented in Table 4, while sowing and harvest dates and dates of application of the fertilizer N are given in Table 5. T1 applications were in late-tillering and T2 applications during early stem elongation, or later for the delayed timing treatments in 2008 and 2009.
Summary of nitrogen treatments in 2007, 2008 and 2009

Dates of application of fertilizer N and of sowing and harvest in the three experiments
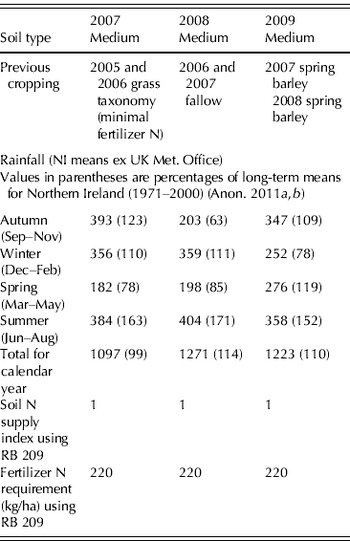
Key to determining the fertilizer N requirement of a winter wheat crop using RB209 or the Fertilizer Manual (Anon. 2000, 2010) is an assessment of the amount of N which is being, or will be, supplied by the soil. This depends on soil type, previous cropping and rainfall. In the present experiments, soil mineral N was only determined immediately after harvest. Therefore the Soil N Supply index was predicted based on these factors using the Field Assessment Method included in the Fertilizer Manual (Anon. 2010, Table 6). In 2007 Table D2, for medium soils in all rainfall area following ploughing out of grass leys, was used to estimate Soil N Supply Index; in 2008 and 2009 Table C, for high rainfall areas where the annual rainfall is >700 mm, was used. The recommended fertilizer N requirements were then determined taking account of the soil nitrogen supply (SNS) index and the soil type.
Previous cropping, rainfall, SNS index and fertilizer N requirements in the three experiments

The experiments were harvested using a Sampo Rosenlew 2010 combine. Samples were collected to determine moisture content and yields are reported at 850 g/kg dry matter. Sub-samples were milled and N concentrations of the grain and the straw determined by the ‘Dumas’ dry combustion technique using a Leco FP 2000 analyser (AOAC 2000).
Mean grain yields of the two cvars with total amount of fertilizer N applied were analysed separately for each year using the linear exponential (LEXP, yield=a+b×r N applied+c×N applied) function, which is widely used in analysis of yield responses to fertilizer N applications. However, LEXP and exponential models cannot be fitted to N treatments other than the total amount applied and so non-linear regression analysis of the mean yield data from all years was conducted. This allowed the significance of the effects of how the fertilizer N was split between the two applications and the timing treatments to be tested, the final model being that in which the variation accounted for was greatest.
RESULTS
Mean yields of cvars Alchemy and Robigus differed significantly in 2008 (P=0·001) but not in 2007 and 2009 (data not presented). Mean grain N concentration did not differ significantly between the two cvars in any year (data not presented). Interactions between cvar and N treatment did not occur for either yield or grain N concentration in any year. Therefore all analyses of responses to N were conducted using the mean values of the two cvars in each treatment.
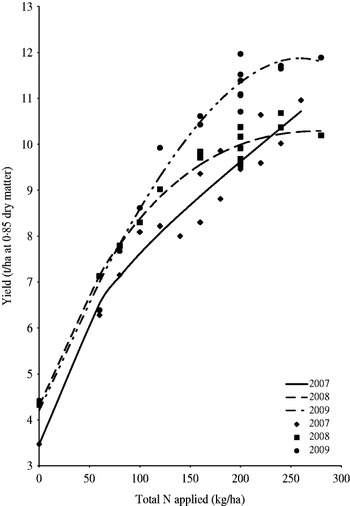
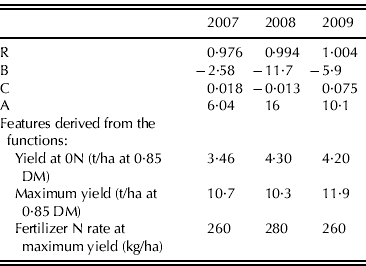
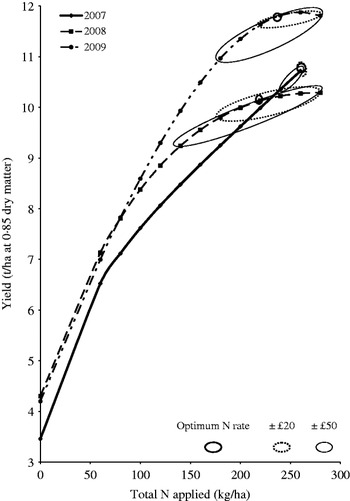
Mean grain yields of the two cvars with total amount of fertilizer N applied (analysed for each year separately using the LEXP function) accounted for 0·940 of the variance in 2007, 0·970 in 2008 and 0·968 in 2009, all treatments being included irrespective of how the applications were split or their timing (Fig. 1; Table 7).
Mean yields of winter wheat cvars Alchemy and Robigus and the LEXP functions 2007–9.

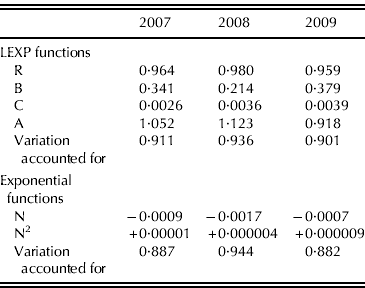
Parameters of the LEXP functions fitted to yields and features derived from these in the three experiments
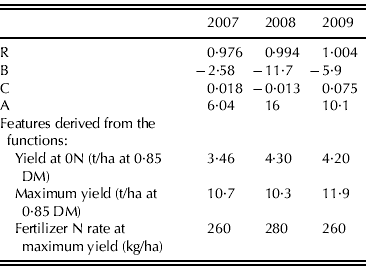
In 2007 and 2008, grain yields were highest at the highest N rates, 10·7 t/ha (at 0·85 dry matter) at 260 kg N/ha in 2007 and 10·3 t/ha at 280 kg N/ha in 2008. The fitted function for the 2008 yields was clearly asymptotic, but the function for 2007 yields did not approach an asymptote. In 2009, the maximum yield of 11·9 t/ha was achieved at 260 kg N/ha, the maximum N rate applied being 280 kg N/ha. Yields at 0N were similar in 2008 and 2009 and were almost 1 t/ha higher than yield at 0N in 2007. The response to fertilizer N, taken here as the yield gain between 0 and 200 kg N/ha, was smallest in 2008 (5·7 t/ha) and largest in 2009 (7·1 t/ha), with 2007 being intermediate (6·2 t/ha).
Variation in the maximum yield, yield at 0N and yield gain provide evidence that the responses to applied fertilizer N were qualitatively different in each of the 3 years. Lower yields at 0N in 2007 than in 2008 and 2009 may be related to higher rainfall during autumn and winter in 2007 (748 mm) than in 2008 (561 mm) and 2009 (600 mm) leading to greater leaching of what little mineralized N was available in the soil (Table 6). The highest yields in 2009 (11·9 t/ha) were possibly a result of both a higher yield at 0N and better growing conditions in spring. Spring was much drier in both 2007 and 2008 than in 2009 (Table 6). Long periods without rain and with high temperatures following fertilizer N application in both 2007 and 2008 may have restricted uptake and advanced development compared with the cooler and damper spring in 2009.
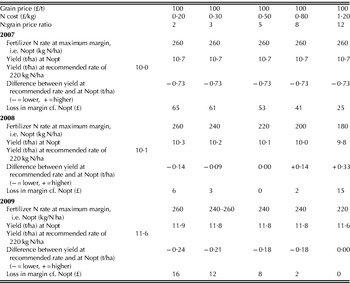
The fitted yield functions for each year were used to calculate the margin of income from grain over cost of fertilizer N for N:grain price ratios of 2, 3, 5, 8 and 12 based on a grain price of (GBP) £100/t (i.e. £0·10/kg) and N cost of £0·20, £0·30, £0·50, £0·80 and £1·20/kg. The maximum margin of income from grain over cost of fertilizer corresponds to the N rate at which the value of the increase in yield equals the cost of the increment in fertilizer applied and beyond which additional N would not repay its cost, i.e. Nopt. In 2007, maximum margins were obtained at 260 kg N/ha for all N:grain price ratios, the maximum rate used in the present experiment (Table 8). In both 2008 and 2009, the optimum N rate was 260 kg N/ha at the minimum N:grain price ratio of 2. However, because the yield responses to N were different in these 2 years, Nopt decreased by 80 kg/ha at the highest N:grain price ratio of 12 in 2008 but only by 40 kg/ha in 2009.
Comparison of N rates at which margins were maximal with yields and margins at the RB 209 fertilizer N requirement

Differences between yield at the recommended rate of 220 kg N/ha in the Fertilizer Manual (Anon. 2010) and at Nopt were greatest in 2007 (0·7 t/ha) and varied between −0·14 and +0·33 t/ha in 2008 and between −0·24 and 0·00 t/ha in 2009 across the range of N:grain price ratios included (Table 8). Differences in margin of income from grain over cost of fertilizer were greatest in 2007 (£25–65), and much smaller in 2008 (£2–15) and 2009 (£2–16) across the range of N:grain price ratios included. Although the difference between yield at the recommended rate and at Nopt was the same for all N:grain price ratios in 2007, there was substantial variation in the margin of income from grain over cost of fertilizer, arising from variation in the cost of fertilizer, decreasing as fertilizer became more expensive. In 2008 and 2009, where the yield differences between Nopt determined from the response curve and the recommended rate were variable but much smaller, the margins, though still variable, were also much lower.
Thus margin of yield over fertilizer costs was very sensitive to the response of yield to fertilizer N in individual years. When bands of fertilizer rates across which reductions in maximum margin of £20 and £50 occurred were determined using the function for each year, N:grain price ratio did not have a consistent effect from year to year on band width (Fig. 2). In 2007, margins were very sensitive to fertilizer N applications because yields increased linearly across all the amounts included in the experiment. In 2008, margins were relatively stable with increments of up to 40 kg N/ha above and below the optimum N rate resulting in less than £20 reduction in margin at most of the N:grain price ratios. Indeed, at an N:grain price ratio of 12, margin of income from grain over cost of fertilizer was within £50 of the maximum at all fertilizer N rates between 100 and 260 kg N/ha with the 2008 yield function. However, in 2009, margins were more sensitive to fertilizer N rate, smaller increments of 20 kg/N ha resulting in calculated reductions in margin of £20 at some N:grain price ratios.
Ranges in gross margins for Nopt±£20 and ±£50 along with the LEXP functions for mean yields and Nopt.

The functions for each year cannot be generally applied to all years, either past or future. Therefore mean yields of the two cvars from all 3 years together were included in further analyses. When LEXP and exponential models were used to fit yield to the total amount of N applied (irrespective of how the fertilizer N was split between the two applications or their timing), LEXP models accounted for 0·714 of the variation when years and blocks were accorded separate parameters. Exponential models of the yield data included a term for the amount of N applied squared and also accounted for 0·714 of the variation, again when years and blocks were accorded separate parameters.
Non-linear regression analysis of the mean yield data from all years allowed the significance of the effects of how the fertilizer N was split between the two applications and the timing treatments to be tested. When all three experiments were combined in one analysis, the final model did not include either how the applied fertilizer N was split between the two applications or their timing, i.e. the effects of these were not significant. Year did not significantly affect the response to fertilizer N but did result in a shift of yield across all N rates equally, i.e. yield at 0N and at maximum N changed by equal amounts from year to year. The final model was:
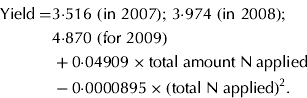 $$$\eqalign{{\rm Yield} = & 3 {\cdot} 516 \ ({\rm in} \ 2007);\, {\rm 3} {\cdot} {\rm 974} \ ({\rm in} \ 2008);\, \cr &4 {\cdot} 870 \ ({\rm for \ 2009)} \cr & + 0 {\cdot} 04909 \times {\rm total}\;{\rm amount}\;{\rm N}\;{\rm applied} \cr & -0 {\cdot} 0000895 \times ({\rm total}\;{\rm N}\;{\rm applied})^2.} $$$
This model accounted for 0·930 of the variation and gave a Nopt of 240 kg/ha at N:grain price ratio of 5. The average response of yield to 100 kg N/ha was 4·0 t/ha (=0·04909×100−0·0000895×1002=4·9−0·9) for the first 100 kg N/ha applied and 2·2 t/ha (=0·04909×200−0·0000895×2002−4·0=9·8−3·6−4·0) for the second 100 kg N/ha applied.
Grain N concentrations increased as fertilizer N applied increased, slowly at lower N rates then more rapidly at higher N rates (Fig. 3). Maximum grain N concentration was 18·0 mg/g for Alchemy and 16·7 mg/g for Robigus in 2007, 20·4 mg/g for Alchemy and 21·4 mg/g for Robigus in 2008 and 20·3 mg/g for Alchemy and 19·5 mg/g for Robigus in 2009. None of the 18 treatments in either cvar had grain N concentration greater than or equal to 19 mg/g in 2007, while in 2008 five of the N treatments for Alchemy and six for Robigus, and in 2009, two of the N treatments for Alchemy and four for Robigus equalled or exceeded 19 mg/g.
Mean grain N concentration in winter wheat cvars Alchemy and Robigus 2007–9.

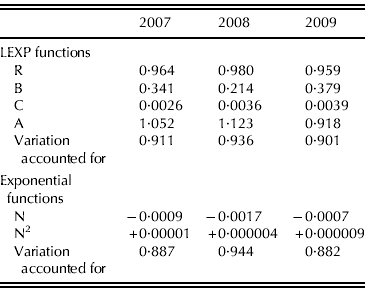
Functions were fitted to the mean grain N concentrations of the two cvars to summarize the data and to identify overall responses of grain N concentration to applied fertilizer N in each of the 3 years (Table 9). In 2007, grain N concentration at the maximum N rate, 260 kg N/ha, was 17·8 mg/g. Grain N concentration was 19·2 mg/g at the optimum N rate in 2008 (Nopt=220 kg N/ha for a N:grain price ratio of 5) and 18·9 mg/g in 2009 (Nopt=240 kg N/ha for a N:grain price ratio of 5). Both yield and grain N concentration responses to applied fertilizer N in 2007 were unusual. The grain N concentrations at Nopt in 2008 and 2009 agree with that of 19 mg/g for optimum availability of N given in the Fertilizer Manual (Anon. 2010).
Parameters of the LEXP and exponential functions fitted to grain N concentration in the three experiments
DISCUSSION
The fertilizer N requirement included in guidance material for growers has been perceived (and indeed conceived) to be a unique integer for a limited number of combinations of soil N supply×soil types and including a few end uses differing in specification for, e.g. chemical behaviour of the grain during processing. It has now been acknowledged, to some extent, that optimum N rate is not a unique integer, hence the illustration of the ‘target zone’ in a recent HGCA publication (Anon. 2009), although with no accompanying explanatory text. In the present experiments, fertilizer N requirement was 220 kg/ha in all 3 years as determined using the RB 209 (Anon. 2000) for medium soils and SNS indices of 1. Nopts derived from the LEXP functions fitted to each year individually were greater than 260 kg/ha in 2007, when yield did not reach an asymptote, 240 kg/ha in 2008 and 240–260 kg/ha in 2009, assuming an N:grain ratio of three, as used in the RB 209 (Anon. 2000) and 220 kg/ha in 2008 and 240 kg/ha in 2009, assuming an N:grain ratio of 5, as used in the Fertilizer Manual (Anon. 2010). Fitting a function with the same response to N in all 3 years gave a Nopt of 240 kg/ha at an N:grain price ratio of 5.
In addition to variation in Nopt in the 3 years, the yield responses to N also varied, reflecting the influence of growing conditions on yield formation processes and on how crops acquire and utilize N. The effect of Nopt diverging from the RB 209 or Fertilizer Manual (Anon. 2000, 2010) fertilizer N requirement on margin of income over cost of fertilizer across the range in N:grain price ratio was minimal in 2 of the 3 years, being less than £15 in 2008 and £16 in 2009. The bandwidth of fertilizer N rates over which reductions in margin of £50 compared to Nopt over the range of 2–12 in N:grain ratios also depended on the shape of the yield response curve, being 80 kg N/ha less than Nopt in 2008 and 60 kg N/ha less than Nopt in 2009.
Given this relative stability in margins, it could be argued that adjusting the fertilizer N rate to take account of economics and variation in yield response arising from the influence of weather on crop growth and development is not necessary. Orson (Reference Orson2010) concluded from a set of experiments with 54 response curves (NIAB-TAG experiments from 1997 to 2009) that where the SNS is <100 kg N/ha, which corresponds to SNS indices of 0–2, using a single N rate was at least as accurate as taking N supplied by the soil into account.
The structure of the SNS index tables in RB 209 and the Fertilizer Manual (Anon. 2000, 2010) and how they are populated also have a bearing on the argument for using one fertilizer N rate at soil N supplies of 100 kg N/ha or less. An SNS index of 0, equating with 0–60 kg/ha available N, is only found on light sands or shallow soils over sandstone in both RB 209 (Anon. 2000) and the Fertilizer Manual (Anon. 2010). The majority of previous crop×soil type options are found in SNS indices 1 and 2, i.e. within a total range in soil N supply of 40 kg N/ha (notionally). Given that other indices, apart from SNS 3, cover a greater range in the amount of N reckoned to be available in the soil, it is questionable if this degree of precision is of value. Vast variation in soil N supply is recognized, with methods of assessment being credited with contributing to, or even causing, this variation (Sylvester-Bradley et al. Reference Sylvester-Bradley, Wiltshire, Kindred, Hatley and Wilson2007). Therefore combining SNS indices of 2 or less is unlikely to substantially increase inaccurate applications of fertilizer N in practice. This case is even stronger in high rainfall areas where Table C from RB 209 and the Fertilizer Manual (Anon. 2000, 2010) is used to determine SNS index where only one previous crop×soil type option has an SNS index other than 0, 1 or 2 in both RB 209 and the Fertilizer Manual, compared with between 5 and 7 being ⩾3 in Tables A and B in both editions.
Furthermore the difference in fertilizer N requirement for winter wheat for each of the five main soil groups for SNS indices 1 and 2 in the Fertilizer Manual (Anon. 2010) is 30 kg N/ha, and apart from light soils, the range in fertilizer N requirement across the other four soil groups is from 160 to 240 kg N/ha. This level of precision compares with the statement that fertilizer N requirement assessed using RB 209 (Anon. 2000) fell within 50 kg/ha of the optimum in only 0·50 of fields in the HGCA ‘Nitrogen for Winter Wheat – Management Guidelines’ (Anon. 2009). Kindred & Sylvester-Bradley (Reference Kindred and Sylvester-Bradley2010) commented that there is ‘a small change in slope over a wide range in N rates’ in LEXP functions of the yield response to N, i.e. yield changed little. Thus, altering the amount of applied fertilizer N has little effect on yield simply because the yield changes little over a wide range of N rates in the asymptotic region of the response curve(s).
Grain N concentration has been adopted as a tool to help growers assess the precision/accuracy of N management, defined as optimum N use. Sylvester-Bradley & Clarke (Reference Sylvester-Bradley and Clarke2009) concluded that there was considerable variation in grain N concentration at Nopt which could not be explained, although variation in Nopt itself accounted for some of it. Grain N concentration could be used more generally as a tool to indicate the efficiency of N use by crops, with growers setting their own benchmark. Sylvester-Bradley & Clarke (Reference Sylvester-Bradley and Clarke2009) stated that although grain N concentration at Nopt varied less than at non-optimal N rates, ‘the difference was not marked’. Thus as grain N concentration increases, yield per kg applied fertilizer N/ha decreases, i.e. more N per kg grain/ha is harvested, and therefore the cost of fertilizer per kg grain harvested/ha increases. Having information on grain N concentration of crops will enable growers to consider whether yield/kg N can be improved. If grain N concentration is already low then yield/kg N is unlikely to be increased much, but yield is likely to increase if additional N is provided. However, if grain N concentration is high then yield/kg N could be increased by reducing the amount of fertilizer N applied.
Using grain N concentration in this way is possible because it acts as a buffer absorbing the under- or over-availability of N by the crop beyond that which can be used in producing yield. Crop processes appear to prioritize yield formation at the expense of N concentration in the grain. This is illustrated by the exponential functions for grain yield and grain N concentration. The term N2 in the exponential function for yield was negative so increments in grain yield were larger at low and smaller at high N rates. Conversely the term N2 was positive in the exponential functions for grain N concentration so grain N concentration showed smaller increases at low N rates and greater increases at high N rates (Table 9). White (Reference White2012) reported that grain N concentration was more consistent than various yield and N efficiency characteristics measured in a multi-trial study of three winter wheat cvars, again suggesting that it is conserved while other characteristics absorb the effects of variation on N availability.
In conclusion, variation in Nopt itself, along with the basic shape of the asymptotic response of yield to fertilizer N and the relatively small variation in margin of yield over fertilizer costs across a range of fertilizer N rates, supports the argument that a standard N rate could be adopted for wheat production in Northern Ireland and in high rainfall areas of England and Wales. Given the crop's inherent capacity to absorb variation in weather conditions and their effect on yield formation processes, use of a standard N rate would not lead to a significant risk of damage to the environment. This is a different approach to nitrogen management from that on which the Fertilizer Manual (Anon. 2010) is based. Rather than aiming at an elusive Nopt, it empowers growers to assess the efficiency of N use in their own crops and adjust fertilizer N applications on the basis of return/income from grain yield.
The author wishes to thank colleagues at AFBI Crossnacreevy who carried out all the practical work involved in the experiments and is very grateful to Dr Sally Watson, Applied Plant Science and Biometrics Division, AFBI Newforge, who provided guidance on, and conducted, the statistical analyses.