1. Introduction
With the economic growth and the progress of science and technology, people have established higher requirements for the safety, stability, high-end comfort and luxury of roll-on/roll-off (Ro-Ro) passenger ships. The cabin layout design will directly affect the quality and service effect of Ro-Ro ships. The actual ship test results of vibration and noise in some ship cabins at sea show that there are still considerable difficulties in fully meeting the requirements of ‘reducing the living area by 5 dB’ in the new rules. The lack of research and development of noise and vibration control technology, damping equipment and test technology in ship cabins, and the training of technicians are the main embodiments of the gap between domestic and foreign ship enterprises.
Due to the particularity of the service environment, the standards and requirements for vibration and noise of marine engines are much lower. As one of the main power sources of ships, diesel engines often work under overload. This complex structure and vibration have always been a research hotspot for designers and users. The vibration response characteristic of diesel engines is one of the critical reference indexes that reflect the running state of diesel engines, and it is also the basis of fault diagnosis. Among them, the vibration signal characteristics can directly reflect the state of a diesel engine and even directly judge the corresponding fault type. Vibration testing and analysis are also important for monitoring the condition of a diesel engine online. As such, the extraction and analysis of vibration signal characteristics of diesel engines has essential research significance and engineering value. In the actual engineering test, the vibration signal of a marine diesel engine includes the vibration response of parts and the direct dynamic coupling effect of the machinery, electricity and hydraulic pressure, and environmental impact. Due to the variety and complexity of vibration sources, the changeable operating environment and the superposition of vibration response, a complex multi-component signal is generated. Scholars worldwide have done much research on transient dynamic analysis, vibration testing and analysis of marine diesel engines. Adeoye et al. (Reference Adeoye, Adebayo, Olofinjana and Tafa2019) summarised several diesel engine vibration reduction methods. Jia et al. (Reference Jia, Ren and Mei2019) used variational modal decomposition (VMD) and cross wavelet transform (XWT) to decompose and reconstruct the vibration signal of a diesel engine and achieved a good denoising effect. Bi et al. (Reference Bi, Lin, Tang, Bi, Li, Yang, Ma and Shen2020) decomposed the diesel engine signal based on VMD and extracted the characteristic parameters of modal function through fuzzy c-means clustering (KFCM) classification, which improved identification accuracy. Han (Reference Han2019) used an improved support vector machine to establish a marine diesel engine match, which improved the fault diagnosis of the valve train of a marine diesel engine. Shifat and Hur (Reference Shifat and Hur2020) decomposed signals using ensemble empirical mode decomposition (EEMD) and continuous wavelet transform (CWT) for better localisation of fault frequencies. These methods provide ideas and references for analysing complex signals. However, the cumbersome operation steps bring new problems to any engineering application.
The conventional signal decomposition methods have several limitations, such as the over-envelope / under-envelope, endpoint effect, modal aliasing and the need for a priori knowledge. Recently, generating differential equations representation methods for vibration signals has become quite popular. The methods mainly use the relationship between signal, signal differentiation and various transformation combinations of signal to describe the structure and properties of a signal. Based on this idea, through the nonlinear combination operation of different-order differential functions of signals and combined with basic filtering, a method of iteratively generating differential equations to decompose multi-component signals is proposed, which has a good effect on decomposing complex multi-component signals. Next, how to extract the dynamic characteristics from the decomposed pure signal is an important step related to the evaluation of the overall system vibration. Researchers have provided many ideas for feature extraction and fault classification of diesel engines. Ramteke et al. (Reference Ramteke, Chelladurai and Amarnath2021) used an artificial neural network (ANN) model to predict and classify gluing faults on diesel engine components. Then, the relevant fault features are extracted from the vibration and acoustic signals by using the signal processing tool, and the piston scratch fault is detected by vibration and acoustic emission analysis through time-domain waveform analysis of the vibration signal of the diesel engine platen surface. Musango et al. proved that monitoring the impact vibration of the diesel engine platen surface near the main bearing is helpful in obtaining the triaxial state of the main bearing, which provides a new method for vibration monitoring of a marine two-stroke diesel engine. Wang et al. (Reference Wang, Yue and Cai2019) proposed a new intelligent fault diagnosis method for a diesel engine based on the fast-sparse decomposition of the vibration signal, and two-dimensional time-frequency feature-coding recognition improved the interference cross terms in time-frequency distribution and realised feature extraction. Zhao et al. (Reference Zhao, Yang, Pan, Wang and Wang2021) established the SD2100TA diesel engine cylinder head-body finite element model, analysed the characteristics under different excitations, such as reciprocating inertia force (RIF), piston slap and spindle load (MBL), and determined that the RIF plays a significant role in the vibration signal. Zhang et al. (Reference Zhang, Zhu, Hu and Yang2019) introduced the adaptive technique integrated with neural networks to the auto-berthing control of marine ships to improve performance in uncertain environments. Meng et al. (Reference Meng, Zhang and Han2024) and Zhu et al. (Reference Zhu, Ma, Li, Malekian and Sotelo2021) studied the fault-tolerant control problem of actuator failure in depth and inspired other researchers. However, most of these studies use improved signal processing methods to improve the accuracy of characteristic parameters or feature matching for a specific fault and do not study the corresponding law between time-frequency characteristic parameters and marine diesel engine vibrations in depth. Further research on improving the operation efficiency and accuracy of decomposition methods and enhancing the adaptability and robustness of decomposition methods to multiple environments is the focus of current research.
Inspired by these observations, an iterative-generation differential decomposition with multi-component vibration signals is developed for the diesel engines of the RO-RO passenger ships. The generation of differential equations can decompose complex signals into single components efficiently and accurately, thus extracting the features of the pure single components. A mechanical system evaluation report is formed, which is of great significance for diesel engine vibration and noise reduction design and fault diagnosis. This paper analyses the characteristic standard of a healthy diesel engine and provides theoretical and engineering references for vibration tests and evaluation of marine engines.
The novelties of this work are summarised as the following aspects:
1. Using signal symmetrical extension can effectively avoid the influence of endpoint effect in the decomposition process and enhance the dynamic characteristics.
2. Any a priori information about the unmeasured vibration signals of the Ro-Ro passenger ships is not required, so this method possesses high self-adaptability.
3. The minimum dynamic characteristic information of the sensitive single component can be obtained through the fusion of the autocorrelation technique.
The reminding of this paper is as follows. Section 2 presents the problem formulation and preliminaries, consisting of the dynamic analysis process of the diesel engine piston and the iterative-generation differential decomposition. Section 3 provides an example analysis of a diesel engine vibration signal. Section 4 discusses the conclusions.
2. Problem formulation and preliminaries
2.1 Dynamic analysis of diesel engine piston
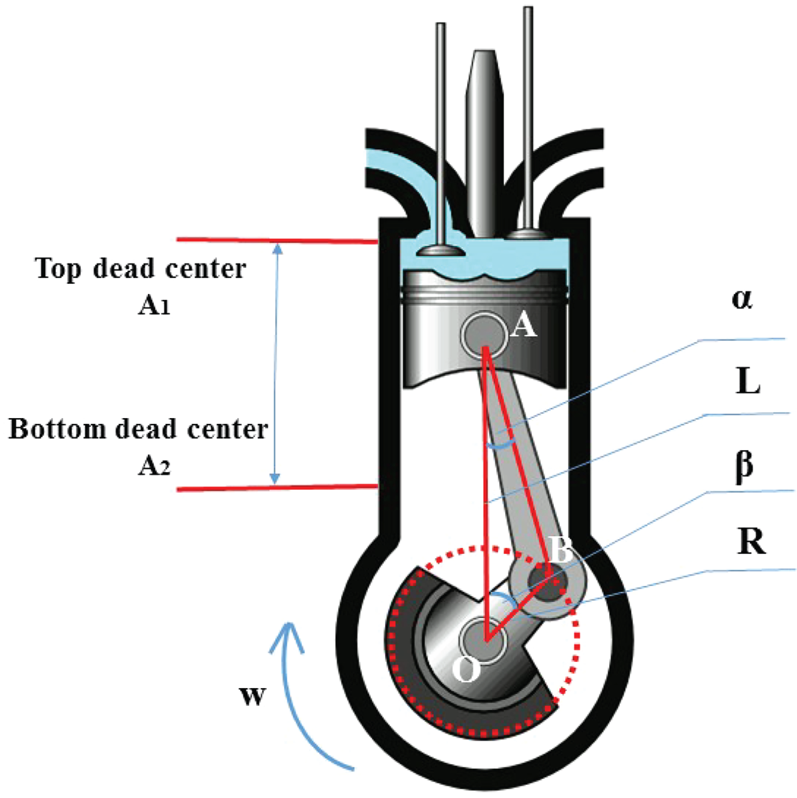
Taking the force and motion of a single cylinder of a diesel engine as an example, as shown in Figure 1, under the condition of healthy and uniform speed, the single-cylinder crank rotates at equal angular speed, the crank length is R, the connecting rod length is L, and the crank moves to the highest point and the lowest point corresponding to the top dead centre and bottom dead centre of the cylinder piston, respectively. Therefore, the dynamic equation is established based on the displacement of piston motion as

Piston model

According to the triangle △OAB

Defining $\lambda \textrm{ = (}R/L\textrm{) = (sin}\alpha /\textrm{sin}\beta \textrm{)}$ , the above formula can be expanded by Newton binomial to obtain the following form:

By substituting the original formula, the piston displacement formula is

The v (velocity) and a (acceleration) of the x (piston) can be obtained by calculating the first derivative and the second derivative of the displacement, respectively:

The acceleration vibration signal of the single-cylinder piston of a diesel engine is essentially an angle cyclostationary signal. During operation, the inertia force generated by the piston during periodic reciprocating motion and the gas pressure in the cylinder are the main excitation sources of diesel engine cylinder vibration. The inertial force can be expressed as

where ${m_j}$ is the mass of the moving part of each cylinder, and the primary inertia force and secondary inertia force can be expressed as

For an odd-cylinder diesel engine, the first-stage inertia force will be partially offset. In contrast, the second-stage inertia force will be superimposed, and the amplitude-doubling effect will be displayed in the spectrum. The cylinder pressure of a diesel engine can be expressed as

where ${P_g}$ is the cylinder pressure and D is the cylinder diameter. According to the operating characteristics of the four-stroke diesel engine, the crankshaft produces a pressure peak every two cycles, so it will produce 0 ⋅ 5 times the crankshaft rotation frequency.
The total piston force can be expressed as

The torsional vibration force transmitted to the shafting can be obtained by synthesis and decomposition:

In practical engineering, the structure and motion of a diesel engine lead to a complex and changeable dynamic system which will not only be affected by these internal forces but also external factors. Therefore, the measured diesel engine vibration is a multi-component complex non-stationary signal.
Remark 1: Due to the complex structure and diversity of the marine environment, evaluation standards have also become problematic in scientific research and engineering applications. The evaluation of the vibration of mechanical equipment or systems has always been a hot topic of study. The vibration evaluation of a simple mechanism might be well known, but the influencing factors of vibration of large and complex equipment are not mature or well understood. Due to the complexity of the marine environment and many kinds of vibration sources and noise during actual operations, the vibration signal of a Ro-Ro passenger ship is highly complex. Extracting the single component with the most extensive feature and removing the interference signal from the complex signal is a difficult problem in engineering.
Remark 2: The different multi-model vibration signals generated by the Ro-Ro passenger ship's sensors are a significant challenge for practical engineering analysis.
2.2 Iterative generation differential decomposition
The generated differential equation can be regarded as a mapping transformation of a signal (Li and Feng, Reference Li and Feng2017). This transformation can decompose the signal into a set of solutions of a series of differential equations to estimate the signal energy, amplitude, frequency and other information. Without losing generality, a harmonic oscillation signal can be expressed in the following form:

where $A(t)$ is the amplitude modulated signal, $\omega$
 is the natural angular frequency and $\varphi$
 is an initial phase.
First, define the following basic state functions of $x(t)$ :$\delta x$
 is the relative rate of change representing the function $\dot{x}(t)\textrm{ = } - A(t)\omega \sin (\omega t + \varphi )$
 , $\delta \textrm{y}$
 is the relative rate of change of the representative function $\ddot{x}\textrm{ = } - A(t){\omega ^2}\cos (\omega t + \varphi )$
 , and ${k_x}$
 and ${\lambda _x}$
 are the derivative of $\delta x$
 and $\delta \textrm{y}$
 :

The differential equation can be deduced from the first-order differential and second-order differential of the signal $x(t)$ as

where ${\delta _A} = \dot{A}/A$ , ${\delta _\omega } = \dot{\omega }/\omega$
 , ${k_A} = \ddot{A}/A$
 .
Generally, the modulation part $A(t)$ and $\varphi (t)$
 changes slowly with respect to the carrier signal, so they can be approximately constant. Therefore, the state function of amplitude and frequency can be approximated ${\delta _A} = 0$
 , ${\delta _\omega } = 0$
 , ${K_A} = 0$
 . Then, the solvable instantaneous frequency and envelope amplitude are

It is necessary to replace the differential of continuous signals with a central difference and the derivative with a central difference quotient for analysing discrete signals:

The estimated values of the instantaneous frequency ω and envelope amplitude A of the discrete signal can be obtained through Equations (14) and (15). By using this algorithm, not only can the envelope be tracked, but also any drift in the frequency can be tracked simultaneously

Without loss of generality, the multi-component vibration signal can be expressed as the superposition of multiple AM-FM signals as

where ${a_i}(t)$ and ${\omega _i}(t)$
 are the amplitude envelope and carrier frequency of the i-th component.
Demodulate the generated differential equation of Equation (17):

where ${R_{\omega (t)}}$ and ${R_{A(t)}}$
 are the frequency and amplitude of the residual component, respectively. Because the residual component has high-frequency and low-energy characteristics, so it can be further separated by filtering.
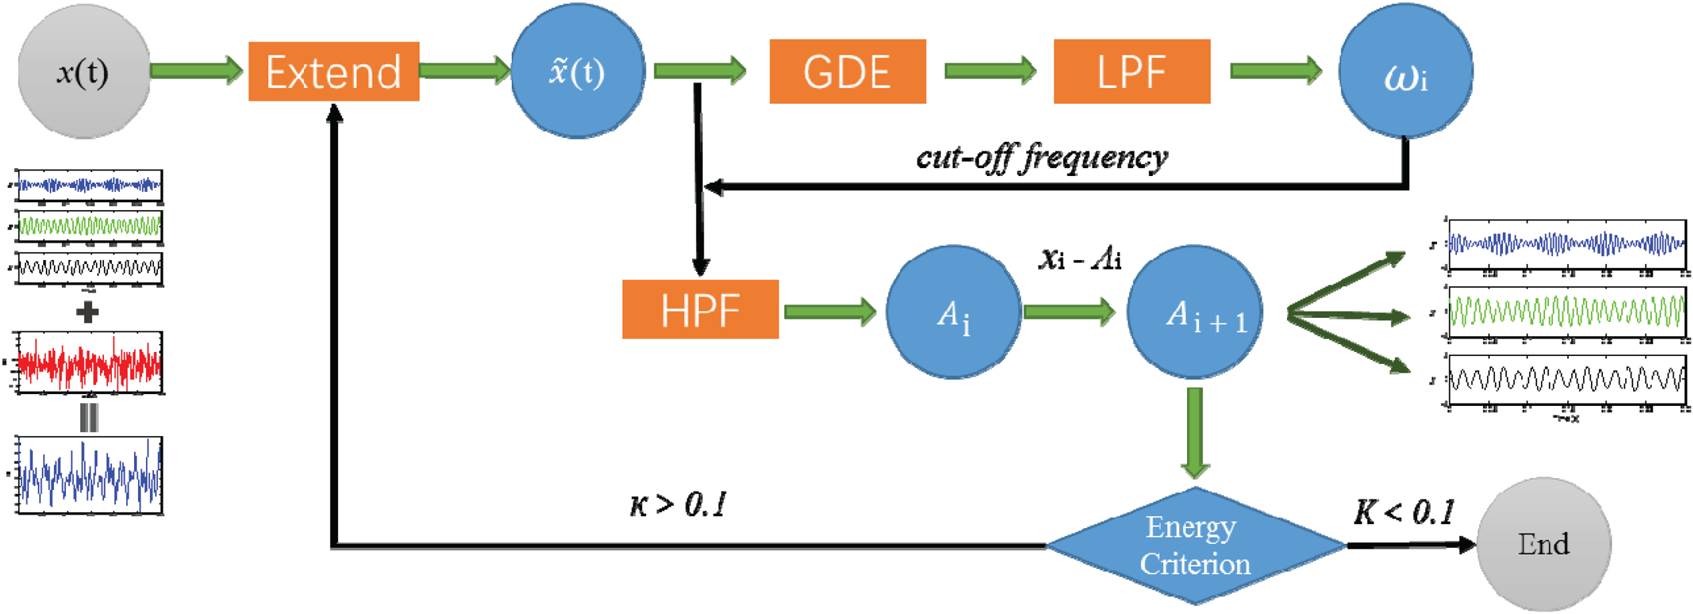
For some specific reasons, such as the multi-component signals to be decomposed are discrete signals with a finite length, the zero-phase filter will produce distortion when eliminating phase shift at the initial and final ends of the signal, resulting in an endpoint effect. In addition, with the continuous increase of iterative operation, this ‘distortion’ will continue accumulating and cause ‘distortion diffusion’. Moreover, because the iterative differential equation decomposition method uses both difference and difference quotients to process and analyse discrete signals, outliers may appear at the endpoints. Consequently, a signal continuation method can effectively solve the problem of the end effect. The extension signal $\tilde{x}$ is obtained by the following symmetrical extension:

where N is the length of the original signal and ${N_e}$ is the extension length ${N_{ei}} = 1,2, \cdots ,{N_e}$
 . After the continuation, the signal will be extended, so after the first filtering, it is necessary to cut the continuation signal to restore the original length, and carry out the continuation again before the next iteration until the end of the iteration. The process flow of our proposed method is shown in Figure 2.
Procedure

The main highlight of the proposed strategy lies in that the iterative-generation differential decomposition overcomes of the drawbacks of multi-component vibration signals.
3. Example analysis of diesel engine vibration signal
In this section, we use the proposed method of frequency-domain analysis to analyse the signals of a Ro-Ro passenger ship, obtain the time-domain indexes of different measuring points and different loads through time-domain analysis, and obtain the changes of different measuring points with loads.
3.1 Test experiment
The vibration test object of ship engineering is a diesel engine group of a specific type of Ro-Ro passenger ship. The single group engine is a 4-stroke, non-reversible, turbocharged, inter-cooled diesel engine with direct fuel injection, which directly injects fuel to output power through nine cylinders, with a rated speed of 1200 rpm and a maximum continuous output rated power of 1665 kW.
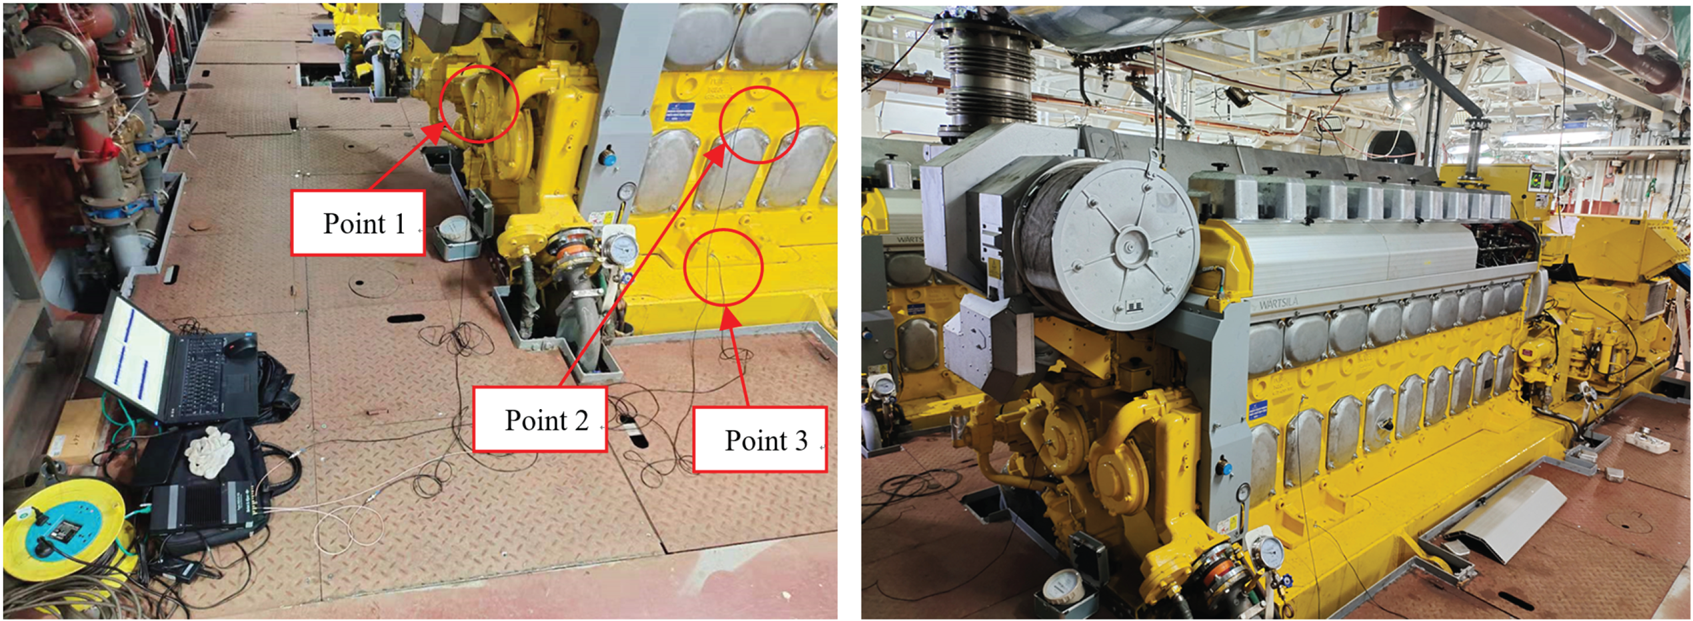
According to the field test requirements, the measuring points are arranged in the side spiral tube (Point 1), the middle of the front chassis (Point 2) and the bottom-corner chassis (Point 3). The measuring directions are in the horizontal diameter direction, horizontal axial direction and vertical direction, respectively. The model of signal acquisition instrument is a Bruel & Kjaer 3505, and PCB acceleration sensors greatly improve the performance of the tests. Three working conditions with loads of 0%, 75% and 100% at rated speed are tested. There is no other interference in the field test environment, and the test site is shown in Figure 3.
Test environment

3.2 Time-domain analysis
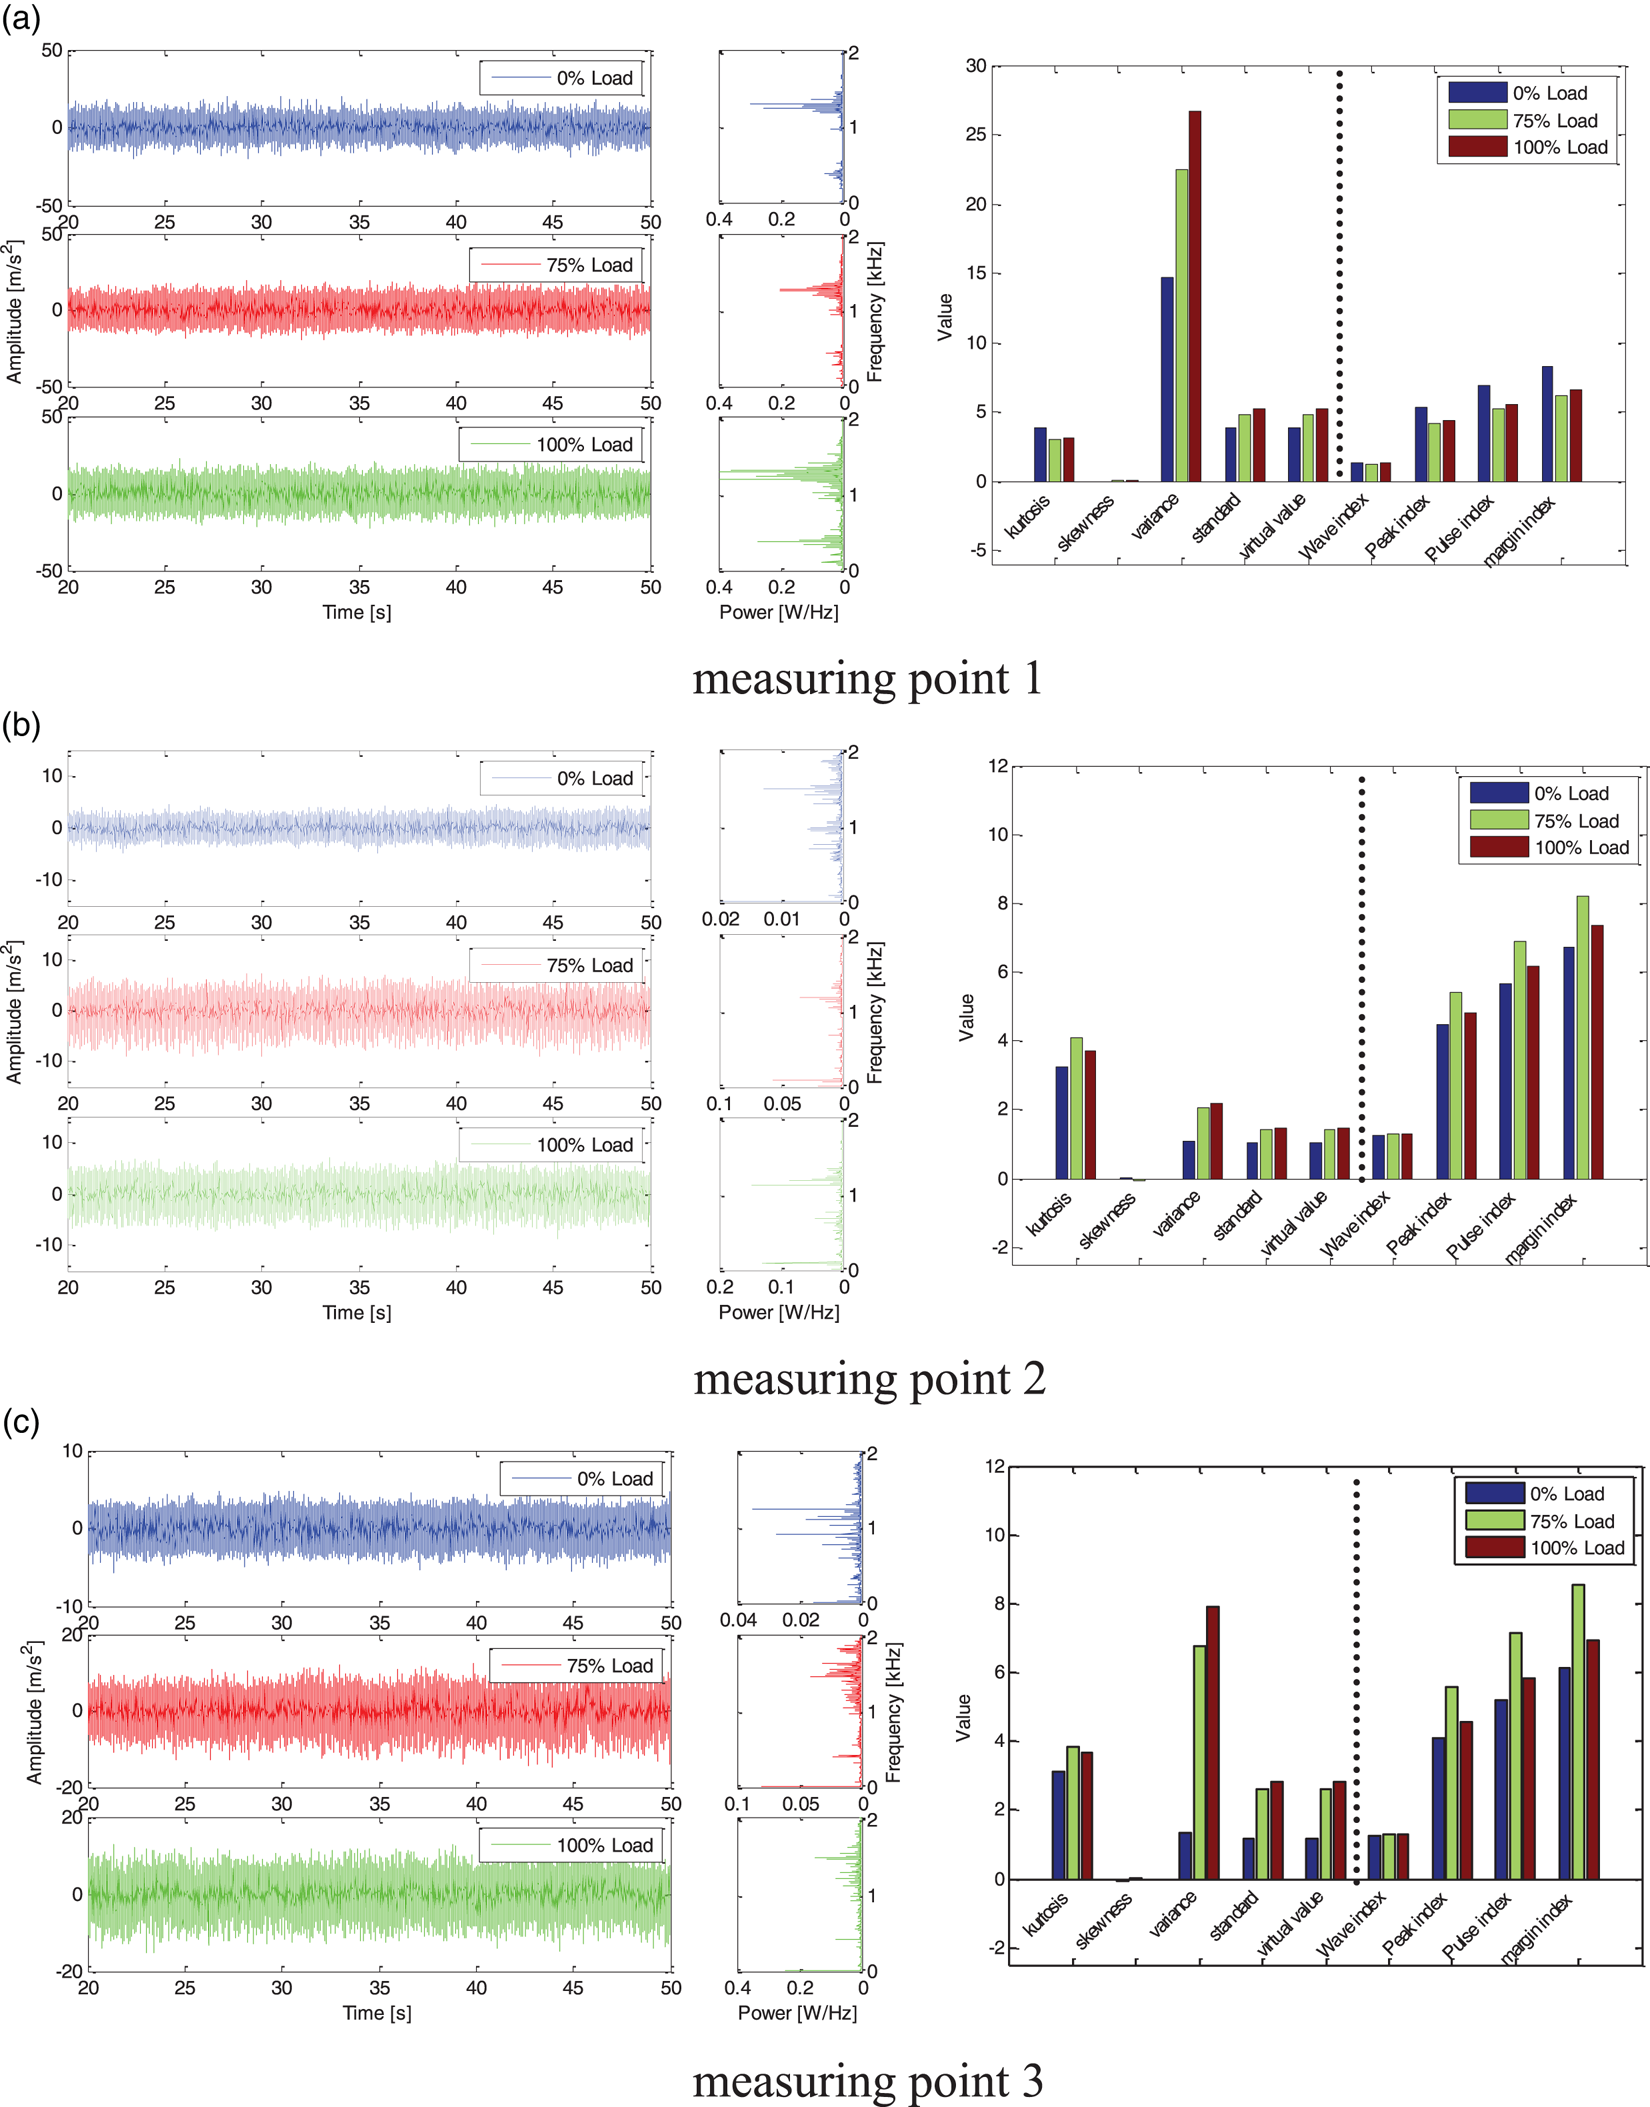
(1) Time domain analysis is used mainly to analyse the stability, transient and steady-state performance of the system by extracting time-domain characteristics. Therefore, firstly, we compare and analyse different load conditions at the same measuring point. The analysis results are shown in Figure 4. It can be seen that the dimensional eigenvalues of measuring Point 1, including kurtosis, skewness, variance, standard deviation and effective value, increase with an increase of load, which intuitively shows the energy change of signal. The dimensionless eigenvalues include waveform index, peak index, pulse index and margin index, which change irregularly with an increase of load. This is because the dimensionless index is highly sensitive to impact, but its stability is insufficient. In practical analysis, the dimensionless eigenvalues can be used to judge the energy distribution of a system operation. The dimensionless index is used to judge the system impact degree under the same working condition in different stages.
(2) The power spectrum shows that the power energy is concentrated on 360 Hz, 720 Hz, 1080 Hz … corresponding to $n \times 4 \times 9 \times 0.5 \times {f_0}$
 , respectively, which is also in line with the vibration characteristics of the 4-stroke and 9-cylinder diesel engine of the test object. Moreover, with an increase of load, the amplitude of power excitation energy increases gradually.
(3) It can be seen that there is little difference in vibration amplitude under the three different loads, but in the corresponding power spectrum, the corresponding power excitation capacity of the diesel engine in the high-frequency region increases with an increase of load.

Time domain analysis and comparison of three load conditions: (a) measuring Point 1; (b) measuring Point 2; (c) measuring Point 3

3.3 Frequency domain analysis
3.3.1 Iterative-generating differential decomposition
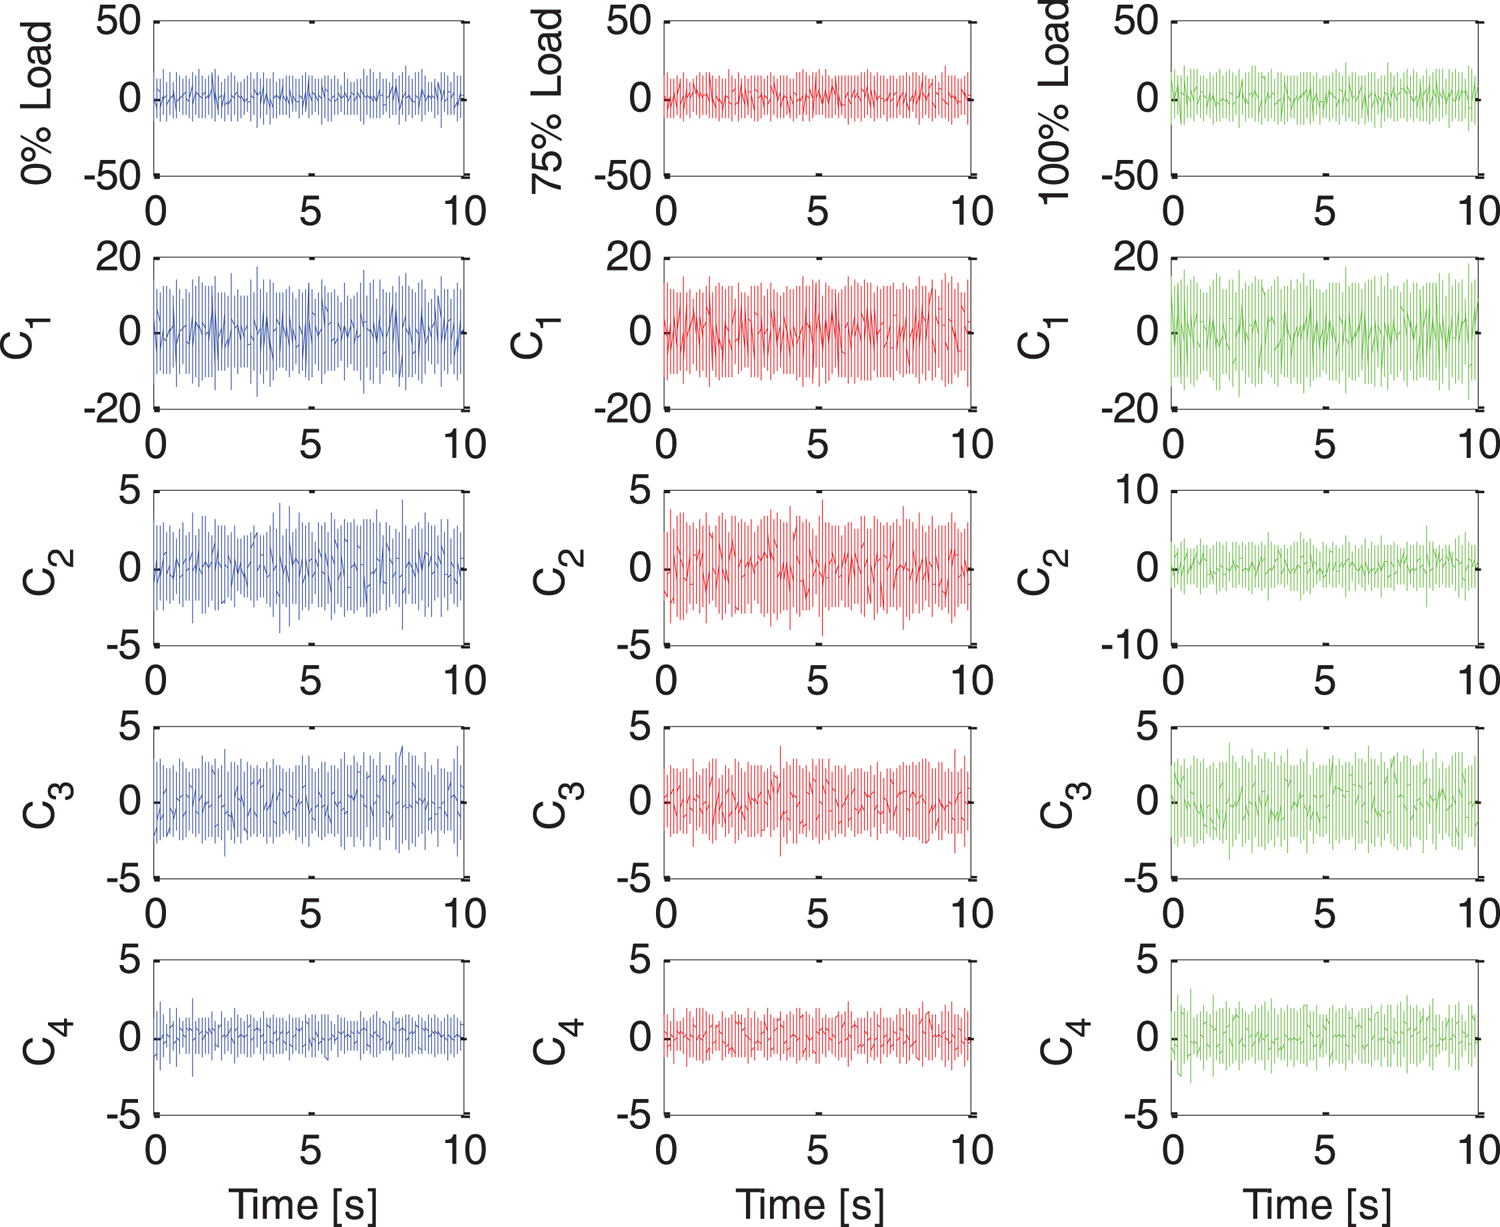
Firstly, the measured data are cleaned and sorted, and then the stable data of 10 s is intercepted for the next analysis. The first step is to generate differential decomposition for the data of three measuring points, as shown in Figure 5. To facilitate comparative analysis, the blue line represents the signal of measuring Point 1, the red line represents the signal of Point 2 and the green line represents the signal of Point 3. To reduce the proportion of the diagram, the first four decomposed components are selected for display.
Iterative generating differential decomposition results

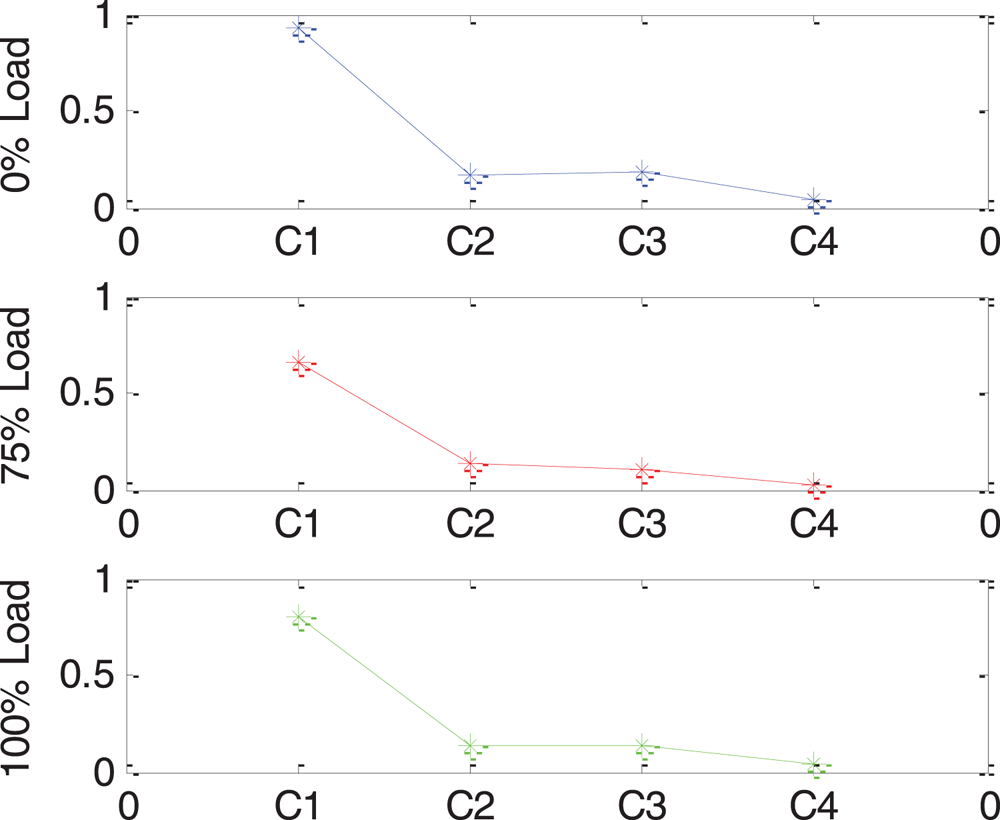
To better extract the signal dynamic parameters, selecting the best sensitive component for the next analysis is necessary. Firstly, the correlation coefficient between each component and the original signal is calculated, and the correlation threshold is set to $\lambda = \max ({\mathop{\rm cov}} f(i))/\beta$ . It can be seen that the signal correlation of the three measuring points is the first component in Figure 6. Therefore, the first component is selected as the sensitivity analysis for the next analysis.
The correlation coefficient

3.3.2 Fourier spectrum analysis
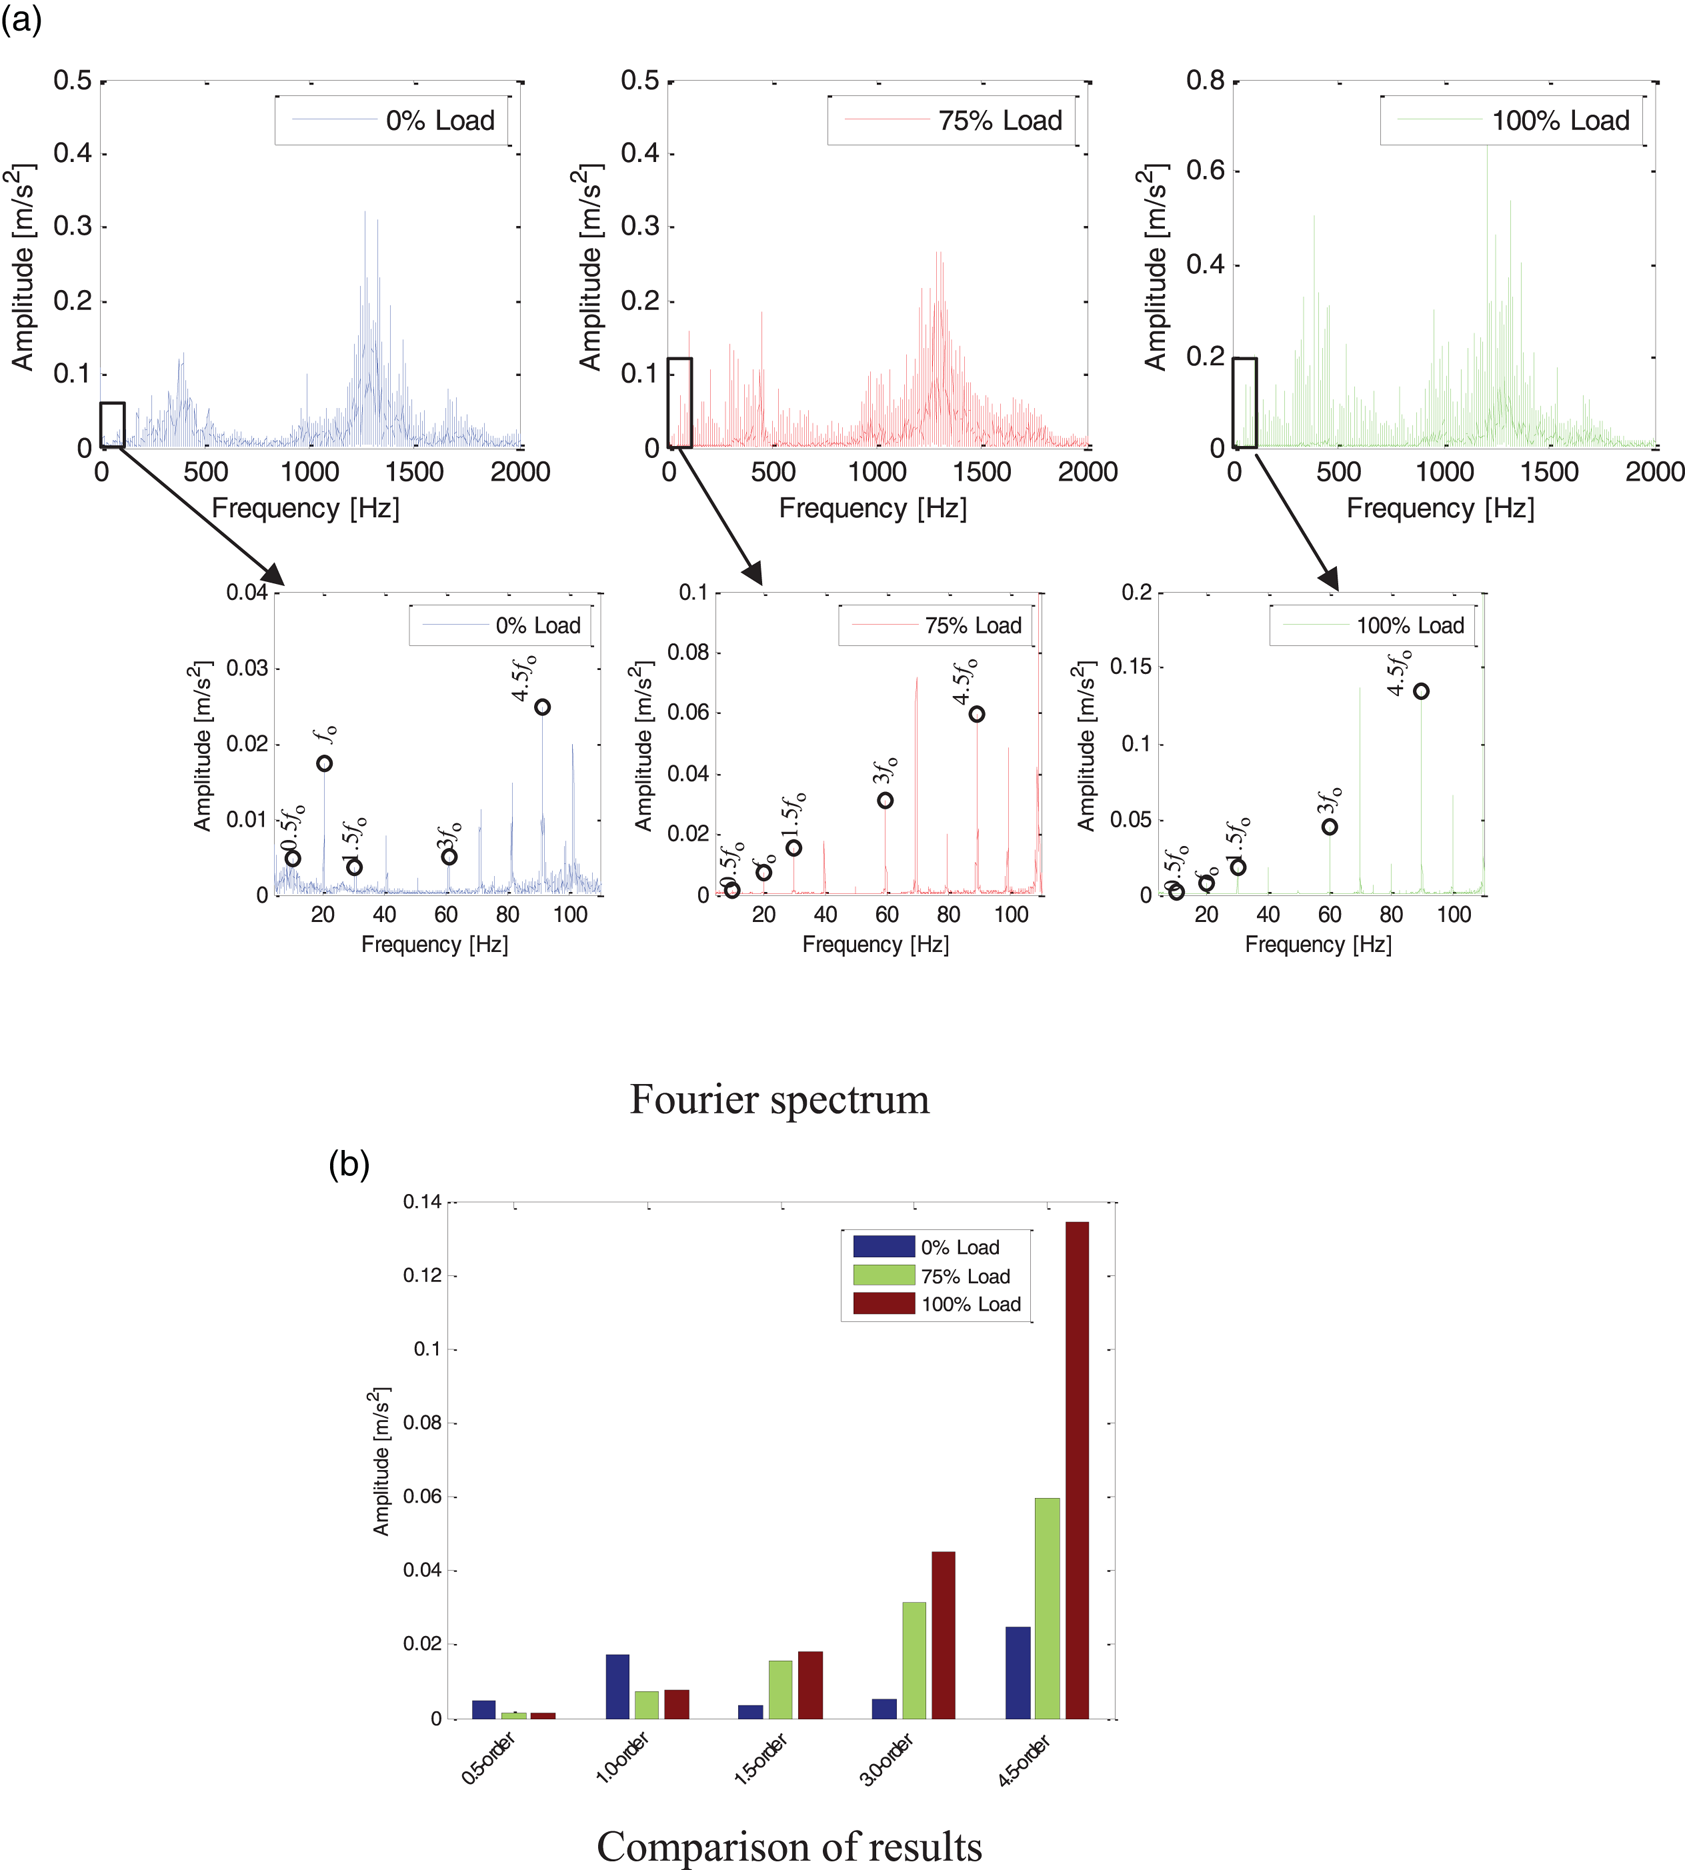
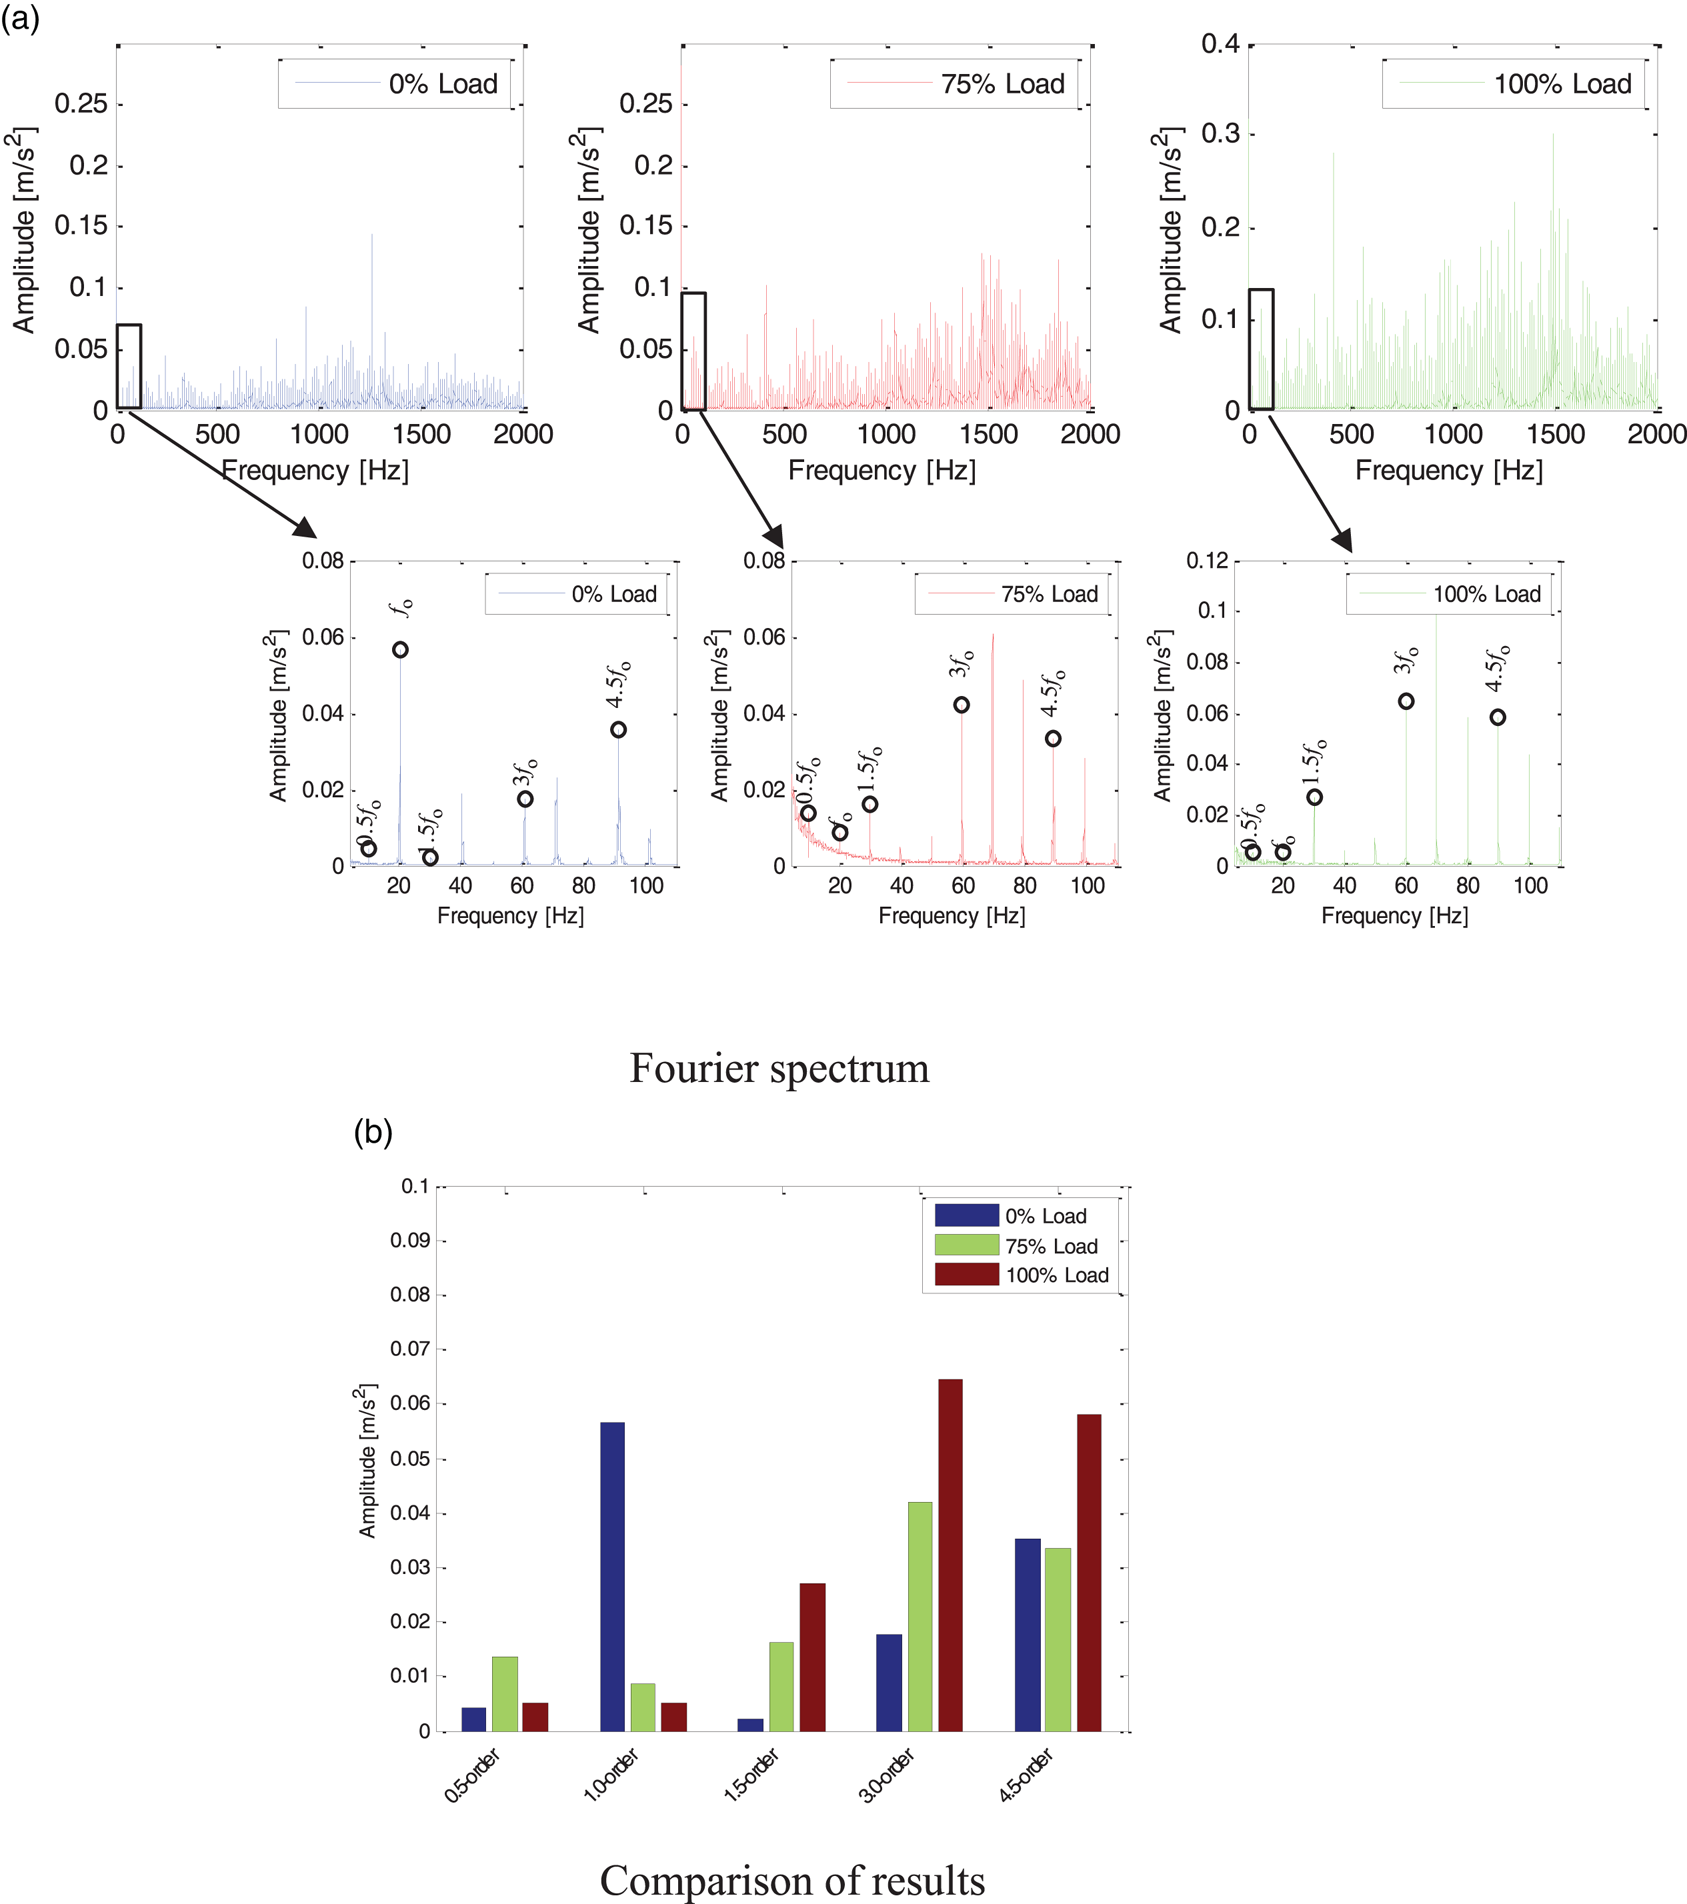
Fourier spectrum analysis is carried out for the first component decomposed by measuring Point 1. As shown in Figure 7, in the low-frequency region, 0 ⋅ 5-order rotation frequency and 3 times rotation frequency are not prominent, while 4 ⋅ 5-order rotation frequency is quite prominent. This is because the diesel engine is a 9-cylinder single-row cylinder, so the frequency conversion excitation 9 × 0 ⋅ 5 × ${f_0}$ is prominent. Other rotation frequencies and their harmonics, such as 3 ⋅ 5-order rotation frequency, 4 ⋅ 5-order rotation frequency, etc., are also prominent. It is usual for rotation frequency harmonics to occur in low-frequency areas. The relative distribution of healthy diesel engines is also relatively uniform. As shown in Figure 7, the overall amplitude increases with an increase in load, especially with the 4 ⋅ 5-order frequency.
Fourier spectrum of measuring Point 1 under three load conditions: (a) Fourier spectrum; (b) comparison of results

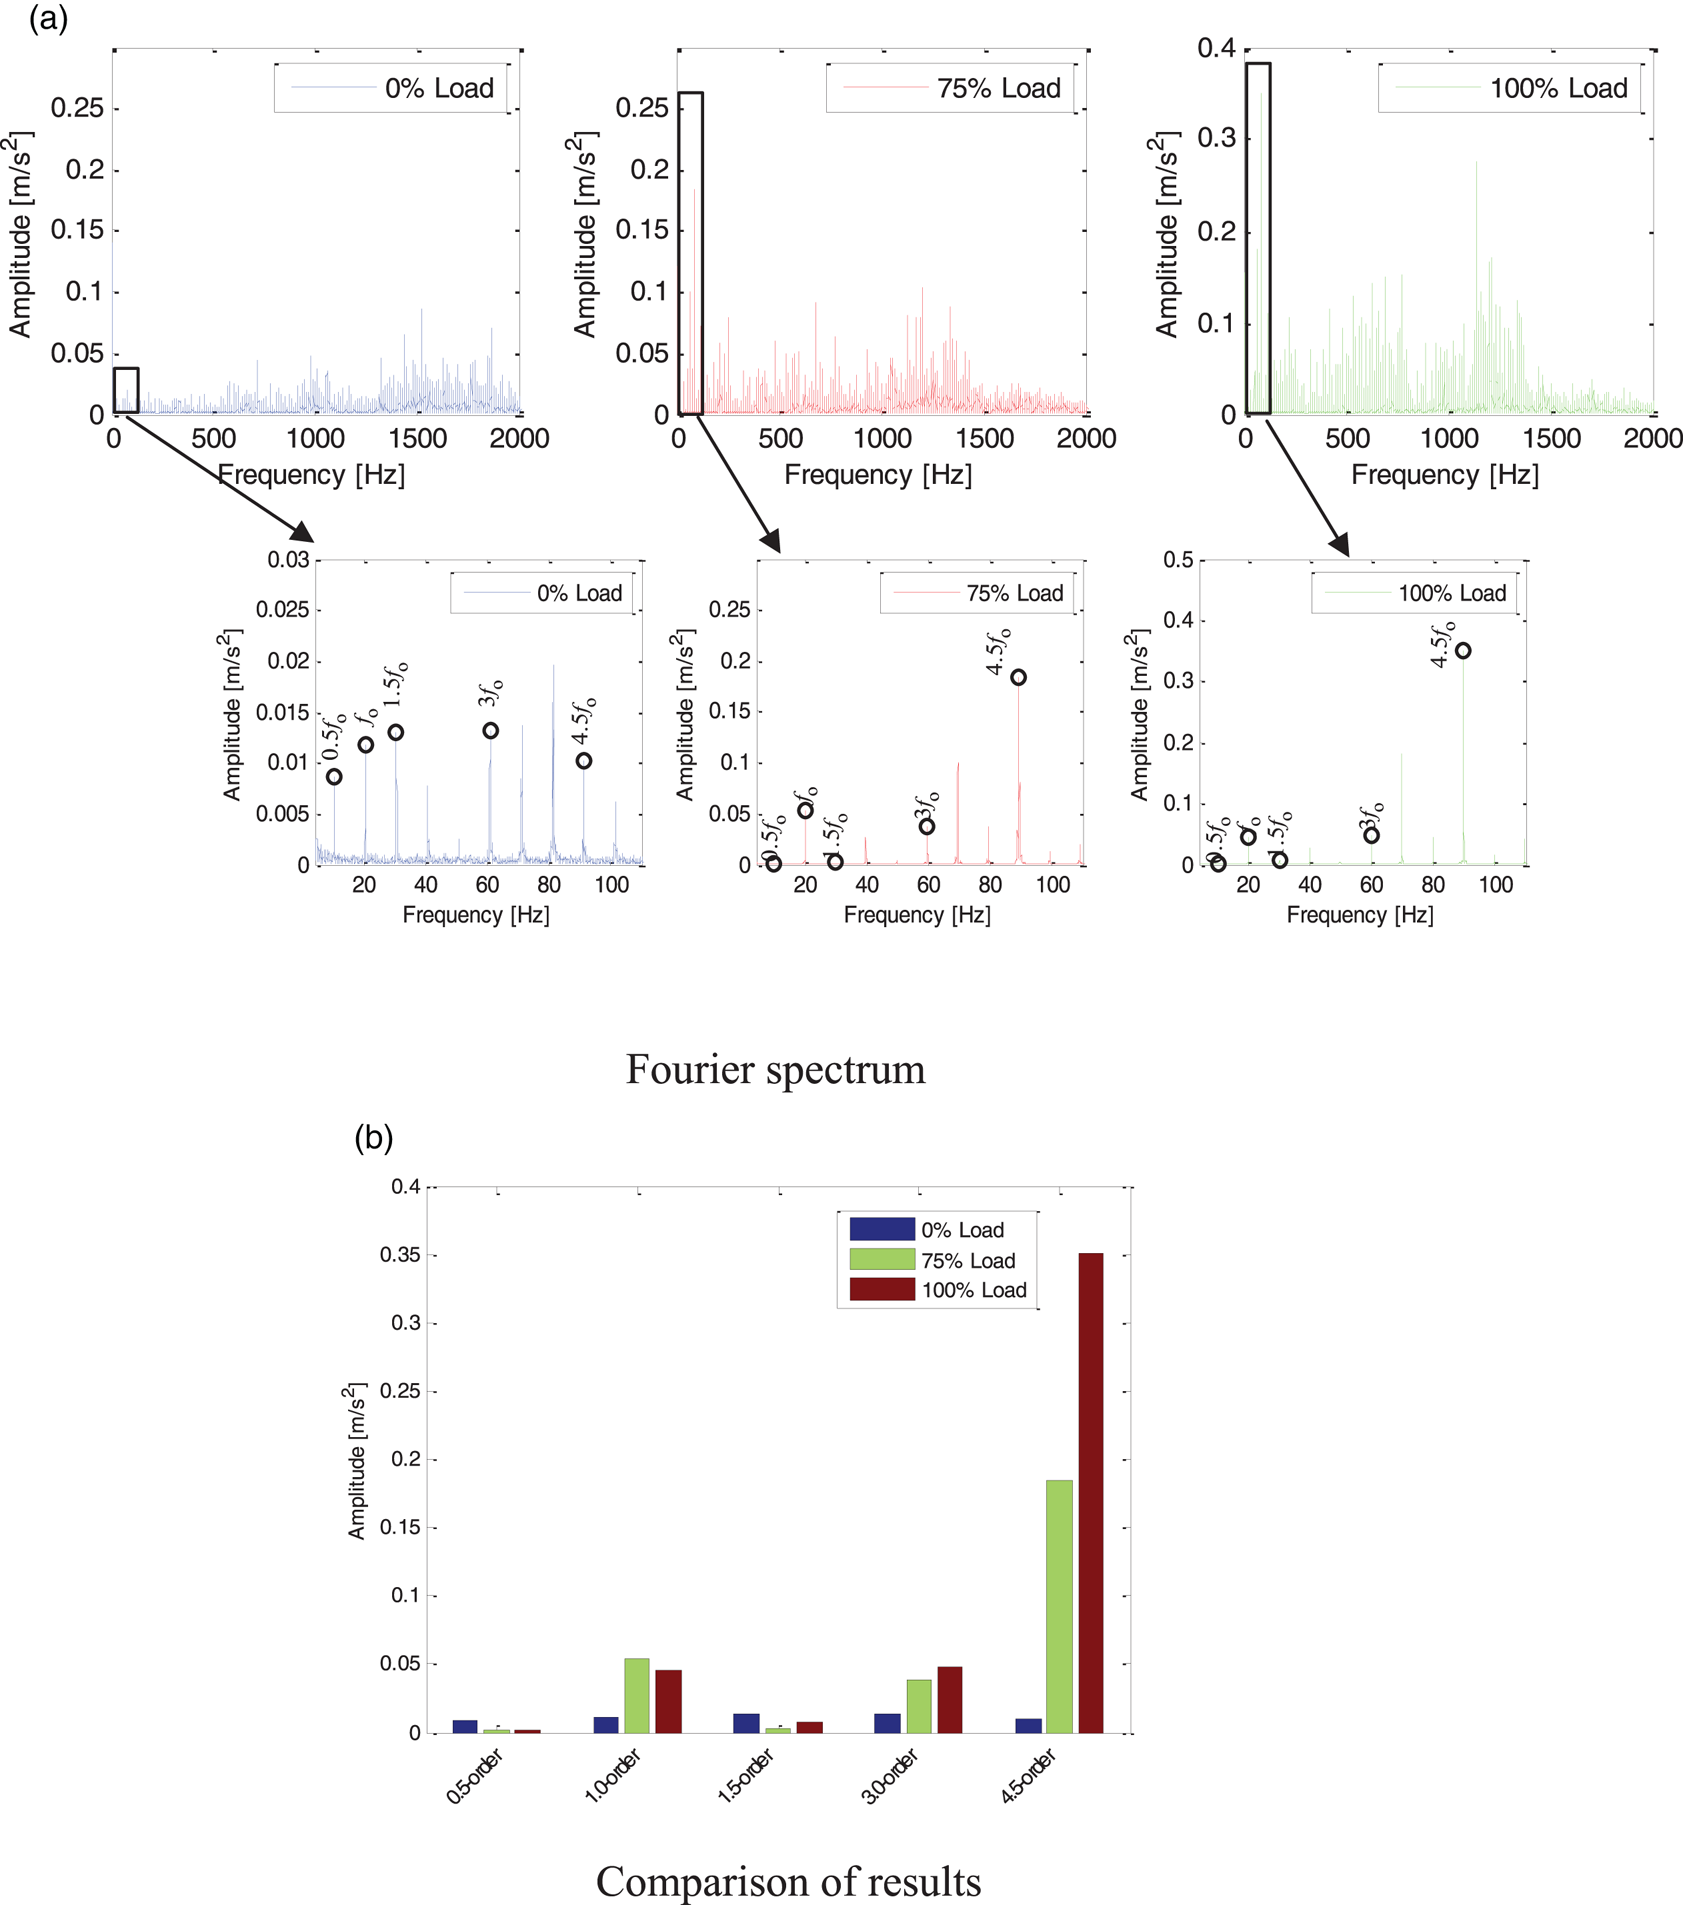
Fourier spectrum analysis is carried out for the first component decomposed by measuring Point 2. As shown in Figure 8, compared with Point 1, the overall amplitude increases significantly in the low-frequency region. Point 2 is close to the cylinder head, and the vibration impact is more evident than in other positions. In terms of frequency conversion and frequency doubling, the prominent frequency amplitude is similar to that of Point 1, and the overall amplitude increases with the increase of load, especially the rotation frequency harmonics 4 ⋅ 5${f_0}$ .
Fourier spectrum of measuring Point 2 under three load conditions: (a) Fourier spectrum; (b) comparison of results

As shown in Figure 9, Fourier spectrum analysis is performed on the first component decomposed by measuring Point 3. The overall amplitude increases with an increase in load, where the performance of rotation frequency harmonics 1 ⋅ 5${f_0}$ , 3${f_0}$
 and 4 ⋅ 5${f_0}$
 of 0% load is evident. In contrast, the amplitude of rotation frequency harmonics 1 ⋅ 5${f_0}$
 , 3${f_0}$
 and 4 ⋅ 5${f_0}$
 of 75% load increases significantly, and the amplitude of frequency at the same position of 100% load increases more significantly. It shows a significant incremental effect.
Fourier spectrum of measuring Point 3 under three load conditions: (a) Fourier spectrum; (b) comparison of results

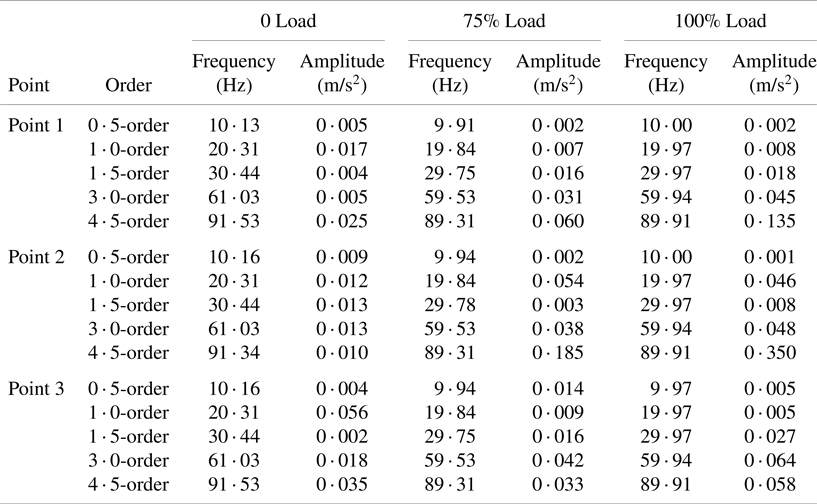
Table 1 details the statistical information of all Fourier spectrum analysis of three different loads at three measuring points, including frequency values and amplitudes of 0 ⋅ 5-order, 1 ⋅ 0-order, 1 ⋅ 5-order, 3 ⋅ 0-order and 4 ⋅ 5-order.
Fourier spectrum amplitude statistics

3.3.3 Envelope spectrum analysis
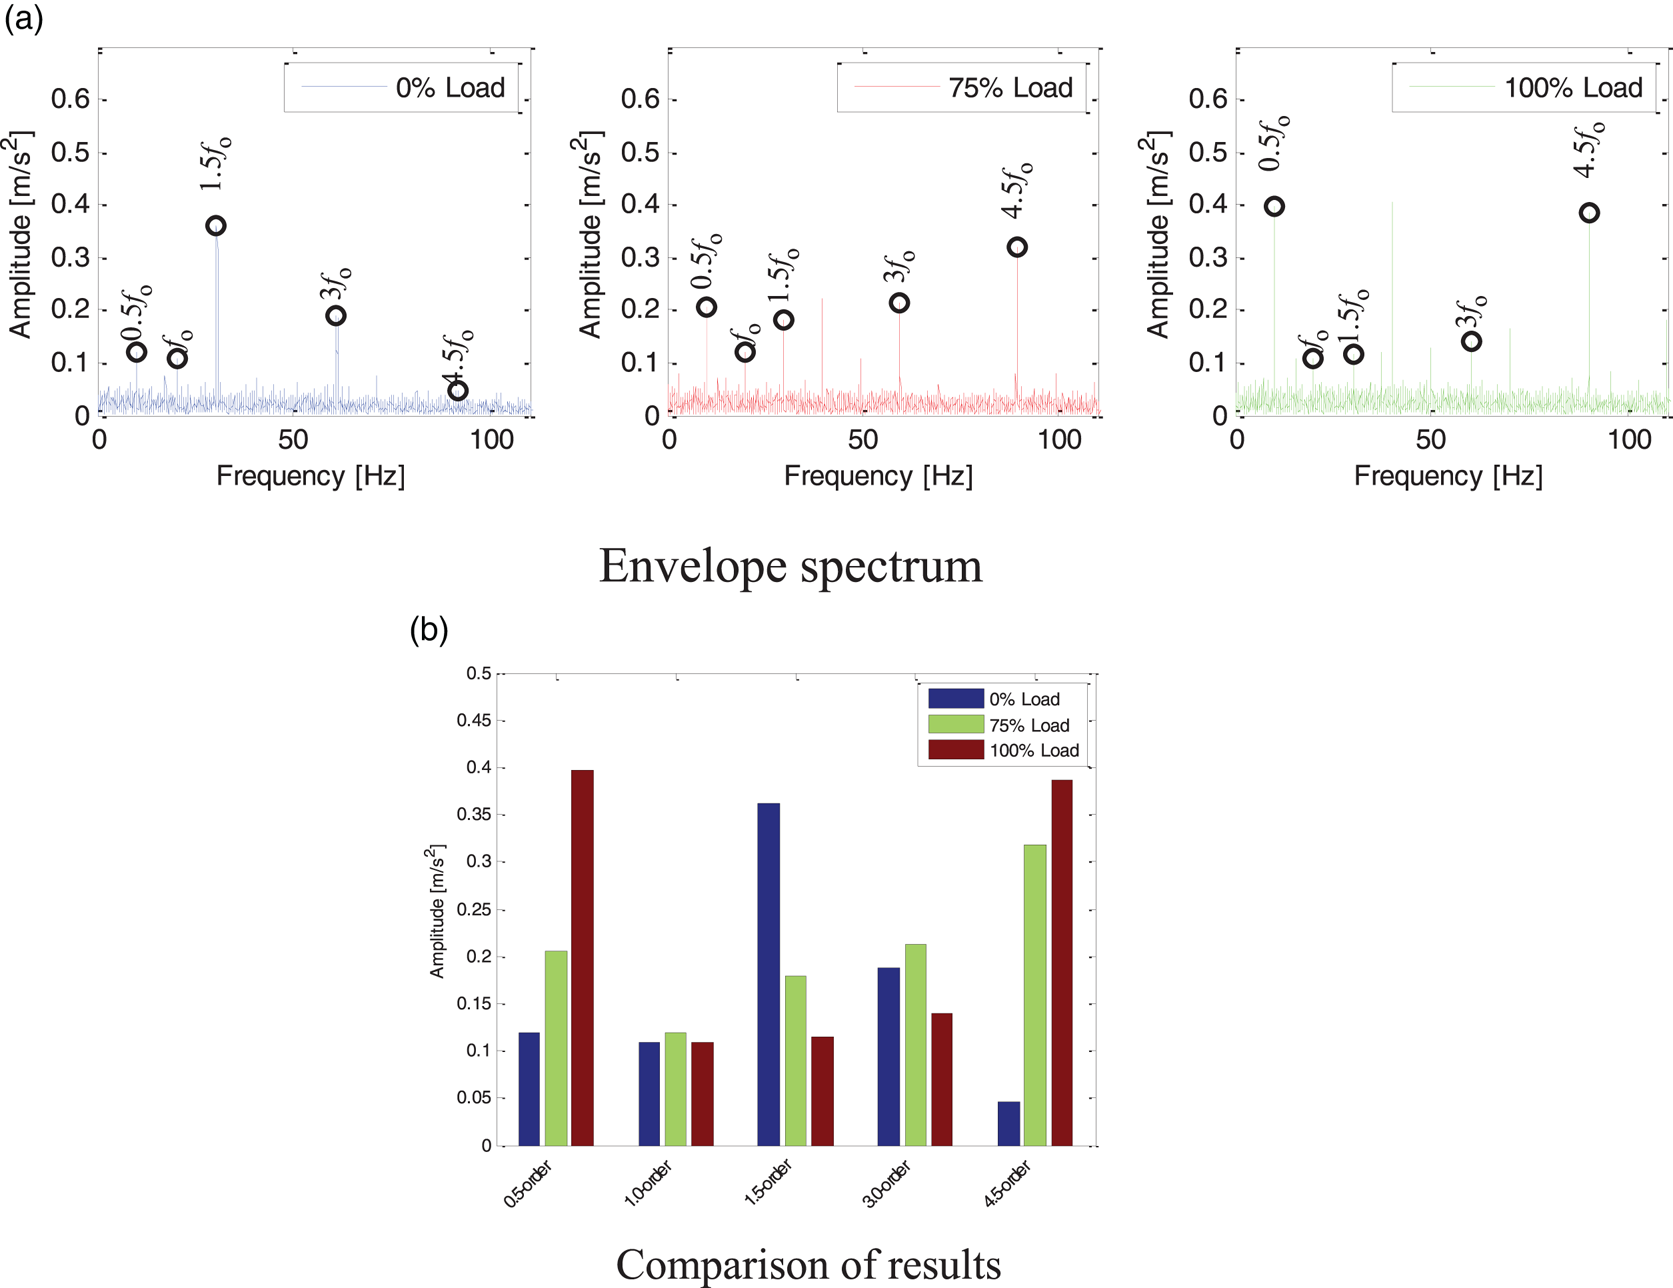
Firstly, envelope spectrum analysis is carried out for the first component decomposed by measuring Point 1. As shown in Figure 10, the amplitude of the envelope spectrum after demodulation significantly changes compared with that of the Fourier spectrum. The overall amplitude is higher, and the amplitudes of rotation frequency harmonics 1 ⋅ 5${f_0}$ , 3${f_0}$
 and 4 ⋅ 5${f_0}$
 are higher. After demodulation, the resonance interference component is removed. Therefore, the bottom performance of the envelope spectrum is more average than that of the Fourier spectrum. The overall amplitude does not change significantly with load. However, the rotation frequency harmonics 4 ⋅ 5${f_0}$
 increases significantly with an increase in load.
Envelope spectrum of measuring Point 1 under three load conditions: (a) envelope spectrum; (b) comparison of results

Continuing to analyse measuring Point 2, as shown in the Figure 11, the amplitudes of 1 ⋅ 5-order rotation frequency, 3-order rotation frequency and 4 ⋅ 5-order rotation frequency are higher, the overall spectrum performance is more average and the characteristic frequency is more prominent than that of Point 1. And the overall amplitude changes obviously with the load. This is because Point 2 is close to the cylinder head, and strong vibration and a short transmission path make the analysis results more accurate and reliable.
Envelope spectrum of measuring Point 2 under three load conditions: (a) envelope spectrum; (b) comparison of results

Envelope spectrum analysis is carried out for Point 3. As shown in Figure 12, the amplitude of 0 ⋅ 5-order rotation frequency, 1 ⋅ 5-order rotation frequency and 4 ⋅ 5-order rotation frequency is higher, and the overall amplitude of 3-order frequency is lower. This is because Point 3 is close to the foundation, and part of the energy of even times of frequency conversion impact is absorbed by the ship plate during transmission, resulting in lower amplitude. The overall trend is the same as that for other measuring points, which shows an increasing trend with the increase of load.
Envelope spectrum of measuring Point 3 under three load conditions: (a) envelope spectrum; (b) comparison of results

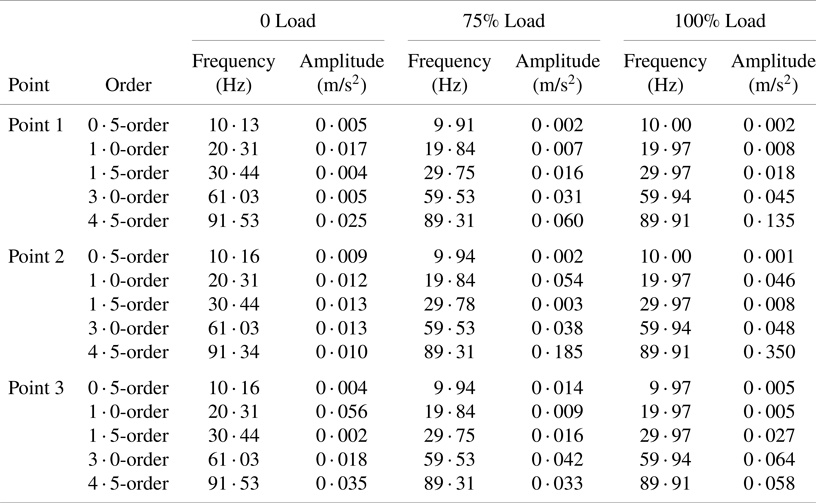
Table 2 details the statistical information of all envelope spectrum analysis of three different loads at three measuring points, including frequency values and amplitudes of 0 ⋅ 5-order, 1 ⋅ 0-order,1 ⋅ 5-order, 3 ⋅ 0-order and 4 ⋅ 5-order.
Envelope spectrum amplitude statistics

4. Conclusions
This research focuses on the multi-component nonlinear signal analysis for the diesel engines of RO-RO passenger ships. For the measured signal of this Ro-Ro passenger ship project, based on the sensitive component after iterative generation differential decomposition, the time domain analysis, Fourier spectrum analysis and envelope spectrum analysis are used. The time domain analysis results show that the energy distribution of the system operation can be judged by the dimensional eigenvalue in the actual analysis, and the dimensionless index can judge the system impact degree under the same working condition in different stages.
The results of frequency domain analysis show that the dynamic parameters of each measuring point increase with an increase of load, mainly the basic reference frequency of fault diagnosis of a 9-cylinder diesel engine: rotation frequency harmonics 1 ⋅ 5${f_0}$ , 4 ⋅ 5${f_0}$
 . The performance characteristics are pretty significant. The proposed method has the characteristics of high efficiency, robustness, and accuracy, which verifies its advantages. The effectiveness and practicability of the method are proved.
Financial support
This work was supported in part by National Natural Science Foundation of China (62273172); in part by the Natural Science Foundation of Shandong Province (ZR2024MF055); in part by the Shandong Natural Science Foundation Youth Fund Project (ZR2022QE163); in part by Shandong Province Innovation Ability Enhancement Project (2022TSGC2514); in part by the Outstanding Youth Innovation Team Project of Shandong Higher Education Institution (2021KJ042); in part by the Yantai Science and Technology Innovation Development Plan Research Project (2024JCYJ092) and in part by the Shandong Province Taishan Scholars Young Experts Project (tsqn202211184).
Competing interests
The author(s) declare none.