Soon after the Civil War, federal assistance to secure land for the freedmen ended and dreams of 40 acres and a mule went unfulfilled. The freedmen, left to fend for themselves, faced numerous impediments to becoming landowners, including low levels of wealth and income, limited access to capital markets, high rates of illiteracy, little experience with the market economy, white resistance to African American landownership, and a lack of civil rights. Scholars of the period emphasize the importance of various factors that impeded African American landownership.Footnote 1 Notwithstanding these barriers, Southern African Americans made significant gains in accumulating property.Footnote 2
The extent of postbellum African American wealth accumulation has had long-lasting effects. Even today, inheritances continue to account for a nontrivial portion of the wealth gap between whites and African Americans.Footnote 3 Moreover, wealth fosters the development of human capital by allowing families to better provide for the education and healthcare needs of their children.Footnote 4 Greater postbellum wealth would also have better protected African Americans during times of economic hardship and facilitated migration to more promising locations. The accumulation of wealth by African Americans and the barriers they faced during the postbellum era are important, not only for understanding the plight of these earlier generations, but for understanding why racial differences in wealth and other standards of living have persisted.
African American property accumulation after emancipation varied considerably across the South, but scholars disagree about the reasons why. Jay Mandle, Robert McKenzie, and Loren Schweninger have argued that African American landownership was generally lower in regions characterized by cotton production, plantation agriculture, and dense African American populations due to a combination of intense hostility to African American ownership and expensive land relative to wealth.Footnote 5 On the other hand, Robert Higgs and Robert Margo find that neither cotton production, the African American percentage of the population, nor plantation agriculture lowered the per capita wealth of African Americans.Footnote 6
Using a new data set of 1880 Tennessee real estate transactions, we add to the literature on postbellum wealth accumulation by African Americans. The data cover a fairly diverse cross section of the South with individual-level observations during an important historical time, which has received little attention from wealth studies. Our choice of 1880 allows us to examine how ex-slaves fared in the postbellum real estate market after the Freedmen's Bureau and its protections were gone.Footnote 7 Most studies of postbellum African American wealth have either focused on 1870—when the South was still under federal control with little time for the ex-slaves to have adjusted to the market economy—or from 1900 and after when most Southern African Americans were either born free or were freed as children.Footnote 8
Even though literacy for African Americans prior to desegregation has been strongly linked to better job market outcomes, Northern migration, and to increased human capital for children, very few quantitative studies have examined the link between literacy and wealth of Southern African Americans.Footnote 9 The few studies that have done so have focused on the early 1900s and have either relied on data aggregated by county or have been of limited geographical scope.Footnote 10
African Americans had few opportunities to obtain education in postbellum Tennessee, making it all the more remarkable that literacy rates increased from an estimated 5 percent in 1860 to 25 percent in 1880. Beginning in 1863 some African Americans were educated in contraband camps that trailed the Union Army and in stationary shantytowns on the outskirts of cities and towns. Furthermore, many of the 20,000 Tennessee blacks who enlisted in the Union Army would have received at least a rudimentary education.Footnote 11 After the war, the short-lived Freedman's Bureau did run organized schools in Tennessee, and by 1869 the state had 498 schools educating almost 26,000 students. However, the freedmen faced many difficulties in attending these schools. Between 1867 and 1869 alone 61 of their schools were burned.Footnote 12
We present three main findings about the postbellum wealth accumulation of African Americans. First, African American men purchased property at similar rates in the plantation and non-plantation counties in our sample. We contend that some scholars have conflated the effects of non-plantation regions with the low land prices in those regions and thus have overstated the negative influence of the plantation on African American wealth accumulation. Second, literate African American men purchased property at a 20 percent higher rate than their illiterate counterparts, although literate blacks purchased significantly smaller parcels than illiterate blacks when controlling for other factors. Third, we find that blacks paid more than whites for land relative to its assessed value, but literacy provided at least some protection against racial price discrimination.
DEVELOPING THE SAMPLE
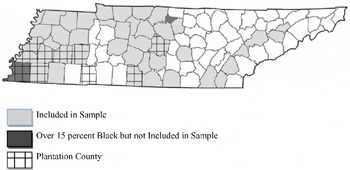
We develop a sample of real estate transactions from Tennessee to examine the postbellum accumulation of real estate by African Americans. We limited our study to the 42 counties with an African American population percentage of at least 15 percent in Figure 1. These 42 counties contained 55 percent of Tennessee's white population and almost 80 percent of the state's African American population. Even though most of the counties were in western and middle Tennessee, the counties in the sample offered a great deal of diversity in terms of population shares, culture, climate, and agriculture. Many of the sampled counties were in areas with small farms, while eight were designated in 1910 as plantation counties by the U.S. Bureau of the Census.Footnote 13 The 6 percent mean rate of real estate ownership for African Americans in 1870 in the sample counties was similar to the 5 percent rate for the entire South. Had the 1880 census collected similar data, it is unlikely that the share owning real estate would have exceeded 10 percent. The shares of real estate owners among whites in 1870 were 57 percent in the sample and 56 percent in the whole South.
TENNESSEE COUNTIES IN 1880

In 1870 the typical owner in the sample counties owned more valuable property than in the South as a whole. For African American owners, the mean value of real estate was $1,546 in the sample counties compared with $662 in the South as a whole. The sample counties relied about half as much on cotton agriculture, had about double the percentage of land in farms, and one-third more improved land as a percentage of farm land than in the South as a whole.
After choosing the counties, we compiled a list of all black and mulatto men in the 1880 census manuscripts between the ages of 25 and 85 to find African American male real estate buyers in the 1880 county deed records located at the Tennessee State Archives. Of the 11,291 deed records with male buyers that we examined, we identified 434 purchases by African Americans. To develop a control group, for each African American buyer we collected information for the next transaction in the deed records with a male purchaser. The next purchaser was white in all but one case. The names of the buyers and sellers, the transaction and recording dates, the sellers’ location, the price paid, the acreage, and the type of property (for example, house and lot) were obtained from the records. The sample was pared down to 406 African American buyers and 408 white buyers when the buyers and sellers were matched to the 1880 Manuscript Population Census and by eliminating 23 buyers who acted as agents for churches. We also merged tax assessment information from 1881 tax rolls to the information from deed records for 247 of our 814 transactions in those counties where the tax rolls were available.
Roughly two-thirds of the buyers of both races were in farming, compared with only 42.5 percent of African American sellers and 55 percent of white sellers. The next largest category for African American buyers and sellers was unskilled nonfarm labors (15 and 26 percent, respectively). Although most sellers were white, 86 percent of the 72 African American sellers sold to another African American.
COMPARISONS OF REAL ESTATE PURCHASES BY RACE, REGION, AND LITERACY
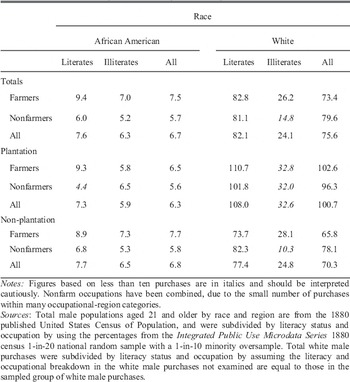
The racial disparity in the literacy of buyers in the sample was enormous. White buyers had literacy rates of 96 percent compared with 29 percent for African American buyers (including mulattoes). Literates purchased land at a higher rate than illiterates. Real estate purchases per thousand adult males by literate white men in Table 1 were 82.1 and only 24.1 for illiterates. Among African Americans, there was a much smaller difference between the purchase rates of literates (7.6) and illiterates (6.3).
ESTIMATED PURCHASES PER 1,000 MEN AGED 21 AND OVER BY RACE, OCCUPATION, LITERACY, AND REGION

Notes:
Figures based on less than ten purchases are in italics and should be interpreted cautiously. Nonfarm occupations have been combined, due to the small number of purchases within many occupational-region categories.
Sources:
Total male populations aged 21 and older by race and region are from the 1880 published United States Census of Population, and were subdivided by literacy status and occupation by using the percentages from the Integrated Public Use Microdata Series 1880 census 1-in-20 national random sample with a 1-in-10 minority oversample. Total white male purchases were subdivided by literacy status and occupation by assuming the literacy and occupational breakdown in the white male purchases not examined are equal to those in the sampled group of white male purchases.
Although many scholars have argued that the quest for landownership by African Americans was inhibited by their location in plantation regions, the larger racial disparities in purchase rates in Table 1 in plantation counties stems almost entirely from whites purchasing land at a much higher rate in the plantation counties, not from African Americans purchasing at a lower rate.Footnote 14 The purchase rates for African American men are statistically the same at nearly 6.3 and 6.8 in the plantation and non-plantation regions in our sample, which was limited to counties with African American population shares exceeding 15 percent. Although not shown in Table 1, African Americans purchased parcels ten acres and larger at a higher rate in plantation counties than non-plantation counties for farmers (4.7 to 4.3) and overall (3.7 to 2.5).
Earlier studies likely found higher land ownership rates in plantation than non-plantation counties because their samples included non-plantation counties with relatively few African Americans, where low land prices per acre would have stimulated African American land ownership. The 1880 average value of farmland per acre in the largely white counties outside our sample was only $7.24, compared with $11.54 in the plantation counties and $12.85 in the non-plantation counties in the sample of counties.Footnote 15
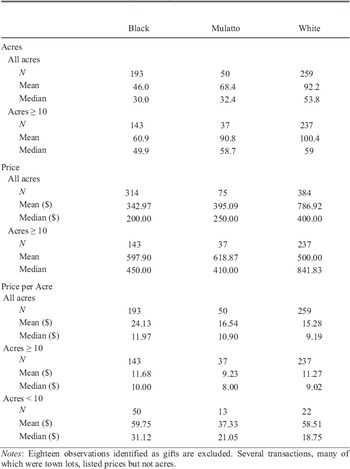
Table 2 summarizes the transaction characteristics for black, mulatto, and white buyers. Consistent with differences in average wealth, whites typically purchased larger parcels than mulattoes, who purchased larger parcels than blacks. Blacks paid a mean price per acre of $24.13, which was substantially higher than the $16.54 paid by mulattoes and the $15.28 paid by whites. Much of this difference is explained by the fact that blacks were more likely to buy smaller properties of less than ten acres, which typically sold for five times the price per acre of properties larger than ten acres. When only properties of ten acres and larger are considered, the racial gap narrows considerably, as mean prices per acre were $11.68 for blacks, $11.27 for whites, and $9.23 for mulattoes.
TRANSACTION ACRES, PRICES, AND PRICES PER ACRE BY RACE

Notes:
Eighteen observations identified as gifts are excluded. Several transactions, many of which were town lots, listed prices but not acres.
REGRESSION RESULTS
To learn more about how the barriers African Americans faced affected their quest for landownership, we conduct two regression analyses. The first analysis examines the factors influencing the acreages of purchases. The second analysis examines whether racial price discrimination further hampered African American landownership.
The following regressions are estimated using median regression, which is more robust than ordinary least squares (OLS) in the presence of outliers. Median regressions fit a regression line through the conditional median, whereas OLS fits a regression line through the conditional mean. Median regression estimates also fit the data better than OLS estimates when the dependent variable exhibits considerable variance and has few observations around the conditional mean. The dependent variables of interest fit this pattern. All the regressions exclude purchases smaller than ten acres, because unlike larger parcels they were often used for house lots and garden plots. These smaller parcels also typically sold for very high prices per acre. Even so, the central qualitative findings do not change when parcels under ten acres are included in the regressions.
Regressions on Acreage
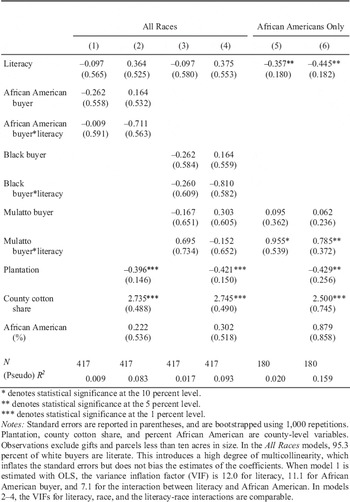
We estimate a series of median regressions of the log of acres on literacy, race, and literacy-race interactions.Footnote 16Table 3 reports the regression results for all buyers in specifications 1 through 4 and for African American buyers in specifications 5 and 6. Even-numbered equations include a plantation county dummy, the cotton share of improved land in the county, and the percent African American in the county population as controls.
MEDIAN REGRESSIONS EXPLAINING THE NATURAL LOGARITHM OF ACRES

*denotes statistical significance at the 10 percent level.
**denotes statistical significance at the 5 percent level.
***denotes statistical significance at the 1 percent level.
Notes:
Standard errors are reported in parentheses, and are bootstrapped using 1,000 repetitions. Plantation, county cotton share, and percent African American are county-level variables. Observations exclude gifts and parcels less than ten acres in size. In the All Races models, 95.3 percent of white buyers are literate. This introduces a high degree of multicollinearity, which inflates the standard errors but does not bias the estimates of the coefficients. When model 1 is estimated with OLS, the variance inflation factor (VIF) is 12.0 for literacy, 11.1 for African American buyer, and 7.1 for the interaction between literacy and African American. In models 2–4, the VIFs for literacy, race, and the literacy-race interactions are comparable.
Some scholars have argued that plantation agriculture hindered African American landownership. One particular argument says that white plantation owners refused to subdivide their holdings, and therefore African Americans in the plantation region had less opportunity to become landowners.Footnote 17 While land ownership may have been highly concentrated in the plantation region, the coefficients for plantation agriculture in Table 3 show that parcels bought in plantation areas were smaller than in other areas. Thus, a refusal among plantation owners to subdivide their land does not appear to have been a barrier to African American landownership. Rather the regression results show that areas with cotton production were the areas where parcel sizes were larger. The large, positive coefficients for cotton share may be due to economies of scale in cotton, unrelated to the complex mix of tenures found on plantations, or from cotton's negative influence on prices per acre, presumably from depleting soil quality.Footnote 18
Turning to the results for literacy, the coefficients on literacy for whites are slightly negative in the models without controls and positive in the models with controls. In each case, the literacy coefficients are statistically insignificant. Part of the reason for the statistical insignificance may be the high degree of multicollinearity between percent illiterate and percent black, which has the effect of increasing the standard errors that are used in the denominators of the t-statistics used in the tests. Such multicollinearity is avoided in specifications 5 and 6, which focus exclusively on African American buyers.
Among African Americans, the association between literacy and parcel size differs for blacks and mulattoes. For each equation, the influence of literacy on parcel size for mulattoes (the sum of the coefficients for literacy and the literacy-mulatto interaction) is positive but not statistically different from zero. In contrast, the influence of literacy on parcel size is strongly negative and statistically significant for blacks. This finding may have arisen because literacy enabled some poor blacks to purchase land who otherwise would not have been able to do so. Their poverty led them to purchase smaller than average-sized parcels. The qualitative results are the same when the regressions are estimated with only purchases made by farmers.
Did Blacks Pay More Than Whites for the Same Quality Land?
We have shown that blacks paid slightly more per acre on average than whites for transactions ten acres and larger (4 percent at the means and 11 percent at the medians). However, Southern contemporaries stressed that blacks typically owned farmland of lower average quality than whites.Footnote 19 If this was indeed the case, the premium blacks paid per acre was larger than is apparent based on prices per acre, quality mutatis mutandis. To see whether African Americans paid more than whites for the same quality of land, we estimate regressions on price per acre minus a measure of land quality per acre, which is measured using the assessed value of land per acre owned by the buyer, taken from the 1881 tax rolls. Tennessee had an ad valorem tax on property, as the state constitution mandated for all property to be “taxed according to its value.”
Tax assessments often are low estimates of the value of land, so the price paid minus the assessed value is often positive. This will not be a problem for comparisons of the prices paid minus the assessment value of land owned by African Americans and whites if the downward bias in assessment was the same for each race. However, there is some potential that tax assessors discriminated against blacks by inflating the assessed values of their land relative to whites (to enhance tax revenues) or by deflating the values of white-owned land relative to black-owned land. As yet, we have not found any empirical evidence of such assessment discrimination.Footnote 20 If discriminatory assessment practices inflated the assessed values of land owned by African Americans or deflated the assessed values of land owned by whites, the results reported below underestimate the extent of racial price discrimination in land transactions.
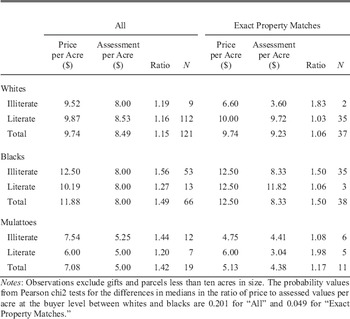
A number of data issues regarding the assessment data arose. First, the tax rolls for several counties were not available, thus reducing the number of observations. Second, the tax-assessment measure does not always match precisely the quantity of land sold in the transactions. Buyers identified in the tax rolls often owned land besides the parcel purchased and in a few cases owned less land than the land purchased. Therefore, the tax assessment variable is buyer-specific but not always parcel-specific. For observations where the tax assessment variable is not parcel-specific, it is akin to having measurement error which could bias all regression coefficients in a direction and magnitude that is not easily derived.Footnote 21 For a subset of the data, however, the acreages listed on the tax rolls precisely match the acreage of the land purchased. This subsample of exact property matches provides a check on the results for the overall sample.
The comparisons of median prices and assessments per acre in Table 4 show that the prices buyers paid were typically higher than the assessed values of the land. Based on the ratios of prices per acre to assessments per acre, the raw comparisons suggest that blacks paid more per acre relative to assessments than mulattoes, who paid more than whites. Although the numbers of white illiterates and black literates are small, the price assessment ratio tends to be higher for illiterates than for literates across race.
COMPARISON OF MEDIAN PRICES AND LAND ASSESSMENTS PER ACRE BY RACE AND LITERACY

Notes:
Observations exclude gifts and parcels less than ten acres in size. The probability values from Pearson chi2 tests for the differences in medians in the ratio of price to assessed values per acre at the buyer level between whites and blacks are 0.201 for “All” and 0.049 for “Exact Property Matches.”
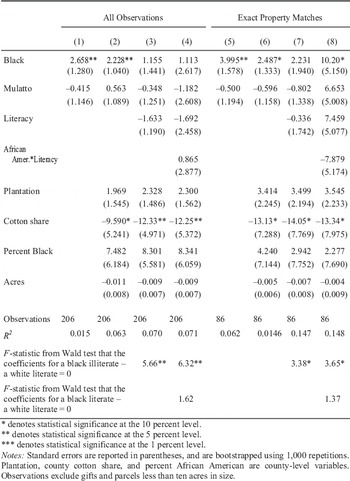
The regression results for price per acre minus assessment per acre are presented in Table 5 for the sample as a whole as well as for the subsample of exact property matches. The first model contains only measures of race in the form of dummy variables for black and mulatto, with white being the omitted group. The second regression model adds acres, a plantation-county dummy, the county cotton share, and the percent African American in the county population to control for differences in county assessment practices that might have been associated with structural differences in the local economy. The third regression model adds literacy. The fourth model allows the influence of literacy to vary by race by interacting literacy with African American buyers.
MEDIAN REGRESSIONS OF PRICE PER ACRE MINUS ASSESSMENTS PER ACRE

*denotes statistical significance at the 10 percent level.
**denotes statistical significance at the 5 percent level.
***denotes statistical significance at the 1 percent level.
Notes:
Standard errors are reported in parentheses, and are bootstrapped using 1,000 repetitions. Plantation, county cotton share, and percent African American are county-level variables. Observations exclude gifts and parcels less than ten acres in size.
We will focus on comparing the differences between blacks and whites, as the differences between whites and mulattos are always statistically insignificant. When only the race variables are used as regressors, the black coefficients are positive, large, and statistically significant. The estimated coefficients on blacks indicate that blacks paid $2.66 more per acre in the full sample and $4.00 more in the parcel-specific group than whites relative to assessments. The black coefficients fall but remain statistically significant and positive when the control variables other than literacy are added. The cotton share is the only statistically significant control variable, and its negative sign may reflect that assessors responded with a lag in revaluing land depleted from cotton.
Some of the racial difference between the prices for similar quality land might be attributed to differences in literacy. When literacy is added to the analysis in specification 3, the black coefficients become statistically insignificant and fall to $1.16 for the whole sample and to $2.23 for the parcel-specific group. The addition of an interaction term between literacy and a dummy for African Americans allows more careful distinctions to be drawn. The differences in quality-adjusted prices paid by black illiterates and white literates are shown by the coefficient on Black minus the coefficient on Literacy in specifications 4 and 8. These differences are statistically significant and large with values of $2.81 (1.113–(–1.692)) for the whole sample and $2.74 (10.200–7.459) for the parcel-specific group. The differences between literate blacks and literate whites (the coefficient on Black plus the coefficient on the race-literacy interaction in specifications 4 and 8) are positive and statistically insignificant, but not as large as the differences between black illiterates and literate whites, with values of $1.98 (1.113+0.865) for the whole sample and $2.32 (10.200–7.879) for the parcel-specific group. The differences between black illiterates and black literates are measured by the coefficient on the interaction between African American and literacy. They vary based on the sample used. When all observations are included and there is more measurement error, literate blacks pay a statistically insignificant $0.83 (–1.692+0.865) less than illiterate blacks for land of the same quality. When the measurement error is reduced in the exact match equations, literate blacks pay $0.42 (7.459+(–7.879)) less than illiterate blacks for similar land quality. Both comparisons between literate and illiterate African Americans are imprecisely measured and thus their differences are not statistically significant. Once again, it is important to note that if tax assessors discriminated against blacks, then the estimated racial differences in prices paid in excess of land values are underestimated.
These results suggest that blacks paid substantially more than whites for quality-constant land, although literacy appears to have mitigated the degree of racial price discrimination.Footnote 22 There are many accounts of illiterate African Americans having been exploited in early postbellum labor contracts, which like land contracts were typically written.Footnote 23 Certainly, the freedmen thought that literacy provided universal protection against being cheated. When one freedwoman was asked why she was determined to learn to read and write, she replied, “so that the Rebs can't cheat me.”Footnote 24
CONCLUSION
Using a new data set on land purchases by African Americans and whites, we discuss several potential barriers to African American property accumulation in the postbellum South. Scholars have disagreed about the role that plantation agriculture and cotton agriculture had in serving as a barrier to African American property ownership. The land purchase data suggests that the relationship between plantation agriculture and land ownership was complex. The rate of land purchase by African Americans differed little between the plantation and non-plantation counties. Although both African Americans and whites purchased smaller parcels in plantation counties than in non-plantation counties, this fact was offset to some degree by the fact that both groups tended to purchase larger parcels in areas where more cotton was produced.
Literacy was associated with larger rates of purchase for both races, but its effect was much smaller although still significant for blacks. The median purchase size was smaller for literate blacks than illiterate blacks. Perhaps, literacy allowed some poor blacks to become landowners, but due to their poverty could only manage to buy small parcels.
Finally, the data show that blacks paid more than whites for land of the same quality as measured by the value set by tax assessors. If blacks were discriminated against by tax assessors, then blacks paid even more for the same quality of land than whites than what our estimates show. Some or all of this racial difference in prices per acre could be due to racial differences in literacy. This conclusion should be considered tentative because there were relatively few black literates and white illiterates in the sample. Future research with larger sample sizes could lead to a more definitive answer about the role illiteracy had on the prices people paid for land.