Introduction
Intrauterine growth restriction (IUGR) refers to the restricted growth of a fetus (<10th percentile) compared to its expected capability when examined at a specific gestational age and results in a baby that has low birth weight (LBW). Reference Luyckx and Brenner1 Globally, the prevalence of a baby being born small for gestational age is approximately 20% of all births. Reference Lee, Kozuki and Cousens2 In Australia, the incidence of IUGR is approximately 10% of all singleton pregnancies. 3 This high frequency of IUGR is a significant concern, as these individuals are at an increased risk of developing chronic diseases later in life. Reference Barker4 Indeed, epidemiological studies have shown that LBW babies have a 1.8 times increased risk of developing hypertension as adults. Reference Spence, Stewart, Alderdice, Patterson and Halliday5,Reference Shankaran, Das and Bauer6 Additionally, human IUGR fetuses have reduced nephron number Reference Luyckx and Brenner1,Reference Wang, Chen, Zhang, Cui, Wang and Wang7 and increased expression of pre-apoptotic proteins Reference Wang, Chen, Zhang, Cui, Wang and Wang7 in their kidney tissues. Furthermore, LBW individuals that have died from cardiovascular disease have a lower number of glomeruli, the key structural unit of the nephron, Reference Keller, Zimmer, Mall, Ritz and Amann8,Reference Hughson, Douglas, Bertram and Hoy9 suggesting that an abnormal functioning kidney contributes to the hypertension. In order to reduce the health burden of these diseases, we need to know more about the mechanisms by which IUGR programs chronic disease risk later in life, specifically kidney and heart disease.
One of the most common causes of IUGR is uteroplacental insufficiency (UPI), a pregnancy complication in which the placenta functions poorly causing a limited delivery of nutrients and oxygen to the fetus. Reference Moritz, Mazzuca and Siebel10 There are two methods used to induce UPI in animal models that reflect IUGR metabolic characteristics in humans. The first involves clamping the abdominal aorta and the branches of uterine arteries, Reference Alexander11 while the second involves ligating both the uterine artery and vein of pregnant animals such as rabbits, Reference Bassan, Leider and Kariv12 guinea pigs, Reference Briscoe, Rehn and Dieni13 or rats. Reference Moritz, Mazzuca and Siebel10,Reference Wlodek, Westcott, Siebel, Owens and Moritz14–Reference Master, Zimanyi and Yin18 As expected, these offspring develop hypertension, Reference Wlodek, Westcott, Siebel, Owens and Moritz14,Reference Gallo, Tran and Cullen-McEwen17,Reference Master, Zimanyi and Yin18 have reduced glomerular number and, hence, glomerular hypertrophy, Reference Moritz, Mazzuca and Siebel10,Reference Wlodek, Westcott, Siebel, Owens and Moritz14,Reference Cuffe, Briffa and Rosser15,Reference Baserga, Bares and Hale19 which occurs concurrently with LBW in the F1 offspring. However, only male animals have glomerular hypertrophy, while females only develop it during pregnancy or when aged. Reference Moritz, Mazzuca and Siebel10,Reference Wlodek, Westcott, Siebel, Owens and Moritz14 Interestingly, the transmission of these phenotypes was found to be multigenerational as they are reported in second (F2) generation offspring down both parental lineages. Reference Melanie, Linda, Andrew, Karen and Mary16–Reference Master, Zimanyi and Yin18 Importantly, these phenotypes and disease risk are sex-dependent in both F1 and F2 offspring. Reference Moritz, Mazzuca and Siebel10,Reference Alexander11,Reference Cuffe, Briffa and Rosser15,Reference Melanie, Linda, Andrew, Karen and Mary16,Reference Baserga, Bares and Hale19,Reference Styrud, Eriksson, Grill and Swenne20
While the explanation of the association between IUGR and the increased risk of developing various chronic diseases in LBW offspring remains undetermined, epigenetic mechanisms (such as DNA methylation) are a potential pathway for the multigenerational transmission of disease. Reference Briffa, Wlodek and Moritz21 The expression of an allele of a gene based on its parental origin (monoallelic), called genomic imprinting, involves DNA methylation. Reference Gonzalez-Rodriguez, Cantu and O’Neil22 Over the last two decades, imprinted genes have been shown to be altered in numerous fetal growth disorders in humans, most of which have IUGR as one of their main clinical features. Reference Temple, Gardner and Robinson23–Reference Bliek, Verde and Callaway26 Notably, altered DNA methylation has been reported in different tissues of IUGR animal offspring, including hepatic, cerebral and pancreatic tissues in both F1 Reference Gonzalez-Rodriguez, Cantu and O’Neil22,Reference Ke, Lei and James27–Reference Park, Stoffers, Nicholls and Simmons29 and F2 Reference Gonzalez-Rodriguez, Cantu and O’Neil22,Reference Martínez, Pentinat and Ribó28 generations, supporting the idea that epigenetic mechanisms can potentially mediate the multigenerational transmission of IUGR-associated diseases.
In order to determine whether epigenetic mechanisms are involved in the multigenerational and sex-specific developmental programming of kidney deficits and dysfunction in UPI-induced IUGR offspring, we examined the expression of four imprinted genes known to be important in human and rodent kidney development in male and female rats from the F1 and F2 generations.
Methods
Kidney sample collection
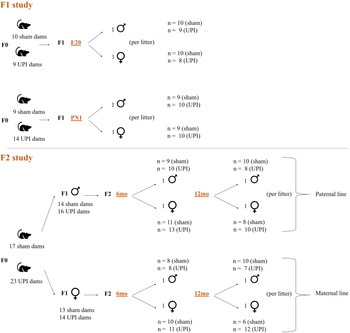
Kidney tissues of Wistar Kyoto rats were generated previously by Prof Mary Wlodek (Fetal, Postnatal & Adult Physiology & Disease Laboratory, The University of Melbourne; ethics numbers AEC 04138, 1011865, and 1112130) and Dr Tania Romano (La Trobe University AEC 12-42). Pregnant female Wistar Kyoto rats underwent either a sham (control) surgery or bilateral uterine vessel (artery and vein) ligation surgery at day 18 of gestation (term = 22 d) to induce UPI and hence IUGR as previously described. Reference Wlodek, Westcott, Siebel, Owens and Moritz14 For the F1 study, each F0 pregnant rat gave rise to 1 litter of F1 offspring, and only one male and one female pup were examined per litter. Kidney samples at embryonic day 20 (E20, n = 37) and postnatal day 1 (PN1, n = 38) were collected (Fig. 1). E20 fetuses were sexed by quantitative PCR (qPCR) of the sex-determining region Y (SRY). Reference Mangwiro, Cuffe and Mahizir30 PN1 pups were visually sexed by observing the anogenital distance. Reference Briffa, O’Dowd and Moritz31 For the F2 study, a different cohort of F0 was used. Female (maternal line; M) and male (paternal line; P) F1 offspring were mated with normal rats. Each F1 rat gave rise to 1 litter of F2 offspring. Kidney samples from both lines, at 6 and 12 months of age (M-6 months, n = 37; M-12 months, n = 35; P-6 months, n = 45; P-12 months, n = 39) were collected (Fig. 1). One male and one female pup were examined at 6 months of age, while a different male and female pup (litter siblings) were examined at 12 months of age. Tissues were stored at −80 °C.
Kidney samples from the first (F1) and second (F2) generation offspring of uteroplacental insufficiency (UPI) – induced or sham pregnant Wistar Kyoto rats. Litter size: 3–14 fetuses/pups per litter.

RNA extraction
Frozen kidney tissue samples were placed on ice after their removal from the −80 °C freezer. A small piece of tissue (approximately 30 mg) was quickly cut on a plastic weigh boat on ice using forceps and a sterile disposable scalpel blade. The piece of tissue (or whole kidney for the E20 samples) was placed into PowerLyser tubes (Qiagen) containing 0.4–0.6 g of 1.4 mm ceramic beads (Qiagen) and 600 μl of buffer RLT (RNeasy Plus Mini Kit, Qiagen) with 12 μl of 2M dithiothreitol. Tissue homogenization of F1 samples (E20 and PN1) was performed using the following PowerLyser settings: time “T” = 15 s, cycles “C” = 1, dwell/pause time “D” = 0 s, and speed “S” = 3,500 rpm. For the F2 samples (6 and 12 months), PowerLyser settings were adjusted to: “T” = 15 s, “C” = 2, “D” = 30 s, and speed “S” = 3,500 rpm. Total RNA was then extracted using the RNeasy Plus Mini Kit (Qiagen), following the manufacture’s protocol. RNA was quantitated using a NanoDrop spectrophotometer (Thermo Fisher Scientific), while RNA integrity was checked by agarose gel electrophoresis.
Genomic DNA (gDNA) contamination check of extracted RNA
Genomic DNA (gDNA) contamination of RNA samples was checked by qPCR using primers within an intron of Actb (Table S1). A total of 12.5 ng/μl of a positive control (rat kidney gDNA) and approximately 20 ng of each RNA sample (in duplicate) were used for qPCR to check for gDNA contamination. All 10 μL of qPCR reactions were set up using SsoAdvanced™ Universal SYBR® Green Supermix (Bio-Rad) on a Bio-Rad CFX384 instrument with the following cycling conditions: 98°C for 3 min, 98°C for 10 s, 60°C for 30 s – repeated for 40 cycles, followed by melt curve analysis: 65°C to 90°C with 0.5°C increment per 5 s. RNA samples positive for gDNA contamination (Cq < 35) were DNase-treated using the TURBO DNA-freeTM kit (Thermo Fisher Scientific), following the manufacturer’s protocol and re-checked by qPCR.
Reverse transcription
Six rat kidney RNA samples (2 μg each) were reverse transcribed using the iScript™ cDNA synthesis kit (Bio-Rad), following the manufacturer’s protocol. The cDNAs were pooled, diluted 1 in 5, and then serially diluted 1 in 2 five times. These pooled and serially diluted cDNA samples were used to optimize the primers for rat reference, imprinted, and epigenetic genes (Table S2). Additionally, this cDNA pool was used in all subsequent qPCRs as a positive control and an inter-run calibrator. Reverse transcription negative controls included no RNA and no reverse transcriptase controls. All kidney RNA samples (2 μg each) were reverse transcribed into cDNA using the iScript™ cDNA synthesis kit (Bio-Rad) in a 96-well PCR plate, then diluted 1:20 with nuclease-free water, and stored at −20°C until qPCR.
qPCR gene expression analysis
Primers for six reference genes (Hprt, Tbp, Ywhaz, Rpl13a, Sdha, and Gusb), four imprinted genes (Peg3, Snrpn, Cdkn1c, and Kcnq1), and two epigenetic genes (Dnmt1 and Dnmt3a) were designed using the NCBI Primer-BLAST (Table S2). All primer pair sequences were synthesized by Sigma Aldrich and each primer pair was optimized by performing qPCR on 1:2 serial dilutions of rat kidney cDNA samples to ensure primer efficiency of 100 ± 10%. Once all primer pairs were optimized, qPCR master mixes containing 5 μl of 2× SsoAdvanced™ Universal SYBR® Green Supermix (Bio-Rad), 0.4 μl of forward primer (10 μM), 0.4 μl of reverse primers (10 μM), and 2.2 μl of water per 10 μl reaction were prepared. The Qiagility liquid-handling robot (Qiagen) automatically pipetted (in duplicate) 8 μl of the master mix into each reaction well on a 384-well plate and 2 μl of cDNA template (or water for the no template control and 1:20 pooled cDNA for the inter-run calibrator). All plates were run on a CFX 384 instrument (Bio-Rad) with cycling conditions according to Tables S2.
The stability of six reference genes (Hprt, Tbp, Ywhaz, Rpl13a, Sdha, and Gusb) was examined using CFX Manager v3.1 software (Bio-Rad). Tbp and Ywhaz were identified as the two most stable reference genes with CV < 0.5 and M < 1 Reference Hellemans, Mortier, De Paepe, Speleman and Vandesompele32 and were used to normalize the expression data of the genes: Peg3, Snrpn, Kcnq1, Cdkn1c, Dnmt1, and Dnmt3a.
Data analysis
The researcher remained blinded with regard to the sample information while carrying out the experiment. Information regarding sham/IUGR status, sex, time point, generation of each sample, and F1 and F2 phenotypic data (including individual pup weight (g), left kidney weight (g), and left kidney weight (% pup weight)) were previously collected by Prof Mary Wlodek and Dr Tania Romano Reference Cuffe, Briffa and Rosser15,Reference Gallo, Tran and Cullen-McEwen17,Reference Briffa, O’Dowd and Moritz31 and sent to the researcher for statistical analyses after qPCR data were generated.
Statistical analyses of gene expression and phenotypic data were carried out in R version 4.0.1. 33,34 The data were checked for outliers (value beyond ± 3 standard deviations from the mean, removed if present) and homoscedasticity (Fig S1.1 and S1.2) to confirm the normal distribution and a constant variance of errors/residuals. Linear mixed effect models adjusted for litter size and litter siblings and Tukey’s post hoc testing were then performed to assess the phenotypic data and expression of each gene between sham and IUGR samples, in both sexes, at different time points in F1 and F2 generations (Table S3). Using GraphPad Prism v8.0.0, the phenotypic data or normalized gene expression of the four groups: sham female, sham male, IUGR male, and IUGR female at each time point were plotted side by side with the other time point within the same generation.
Results
Pup and kidney weights in the F1 and F2 generations
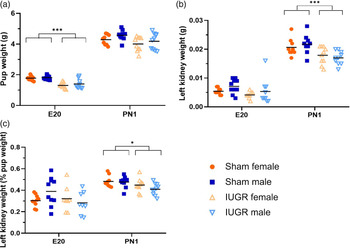
As expected, pup weight was significantly decreased in E20 IUGR rats compared to sham (−24.7%, P < 0.001) (Fig. 2a). There was no difference in pup weight between PN1 sham and IUGR rats. Absolute left kidney weight was significantly lower in PN1 IUGR offspring compared to sham (1.2-fold change, P < 0.001) (Fig. 2b). When left kidney weight was calculated as a percentage of pup weight (Fig. 2c), the difference between the IUGR and sham group was still significant.
Pup weight (a), absolute left kidney weight (b) and left kidney weight as a percentage of pup weight (c) in sham and IUGR rat offspring in the first (F1) generation. The mean value within each group is indicated by a black line. Significance was determined by a Tukey’s post hoc test following linear mixed effect models (***P < 0.001, *P < 0.05; n = 6–13 samples per group).

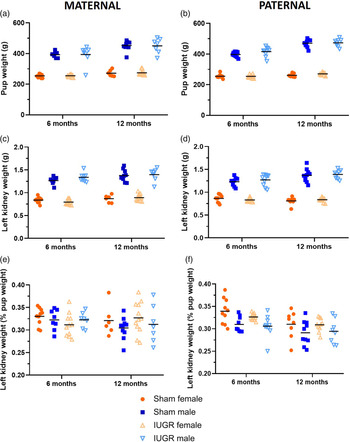
As phenotypic data at E20 and PN1 time points were not available for the offspring of IUGR or sham parents in the F2 generation, we examined the 6- and 12-month data. Unlike the F1 generation, there was no difference in either pup weight, absolute kidney weight, or kidney weight as a percentage of pup weight in offspring of IUGR rats compared to sham in the F2 generation, from both the maternal and paternal lines (Fig. 3).
Pup weight (a, b), absolute left kidney weight (c, d), and left kidney weight as a percentage of pup weight (e, f) in sham and IUGR rat offspring in the second (F2) generation (maternal (a, c, e) and paternal (b, d, f) lines). The mean value within each group is indicated by a black line. Significance was determined by a Tukey’s post hoc test following linear mixed effect models in each parental line (n = 6–13 samples per group).

Expression of DNA methyltransferase genes in rat kidney tissue
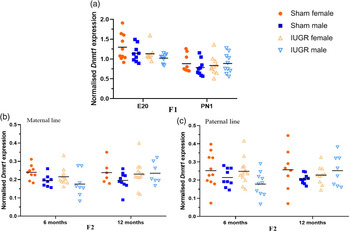
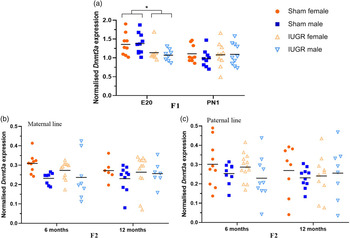
Expression of Dnmt1 and Dnmt3a in kidney tissue of sham and IUGR offspring was assessed in male and female rats, at different time points within the F1 (E20 and PN1) and F2 (6 and 12 months) generations. For Dnmt1, there was no alteration in expression at any time point in IUGR offspring compared to sham (Fig. 4) in any generation. On the contrary, there was a significant decrease in Dnmt3a expression (−19%, P < 0.05) in IUGR offspring compared to sham in F1 offspring at E20 (Fig. 5a, P < 0.05), regardless of fetal sex. However, the difference was not maintained at PN1 and was not found in the F2 generation (Fig. 5b and 5c).
Normalized expression of Dnmt1 in kidney tissues of sham and IUGR rat offspring in the first (F1; a) and second (F2; b, c) generation offspring. The mean value within each group is indicated by a black line. Significance was determined by a Tukey’s post hoc test following linear mixed effect models in each generation and parental line (n = 6–13 samples per group).

Normalized expression of Dnmt3a in kidney tissues of sham and IUGR rat offspring in the first (F1; a) and second (F2; b, c) generation offspring. The mean value within each group is indicated by a black line. Significance was determined by a Tukey’s post hoc test following linear mixed effect models in each generation and parental line (*P < 0.05; n = 6–13 samples per group).

Expression of imprinted genes important for kidney development
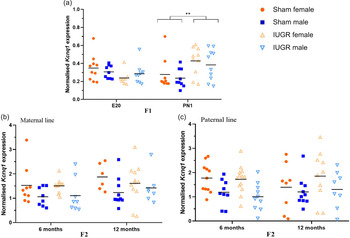
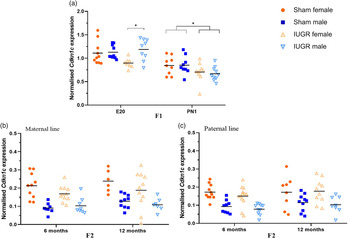
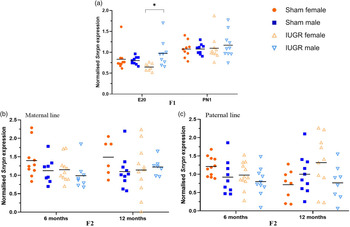
As Dnmt3a changes were found in F1 IUGR offspring at E20, a critical time point in rat’s nephron formation, imprinted genes involved in kidney development (Peg3, Snrpn, Kcnq1, and Cdkn1c) were also investigated. Reference Stampone, Caldarelli and Zullo35–Reference Zheng, Verlander and Lynch40 In regard to Kcnq1, there was an increase in expression in F1 IUGR rats at PN1 (1.6-fold change, P < 0.01) compared to sham, despite a similar expression at E20 (Fig. 6). Meanwhile, no differences were detected in the F2 generation. Interestingly, Cdkn1c expression in the F1 generation was significantly altered by treatment, sex, and time point (Fig. 7). Whereby, there was a 29% (P < 0.05) lower expression in Cdkn1c in IUGR female compared to IUGR male rats at E20, without sex-specific differences detected in sham kidneys (Fig. 7a). At PN1, although the sex-specific difference in Cdkn1c expression within the IUGR group was lost, there was significantly lower Cdkn1c expression in IUGR rats compared to sham (-19%, P < 0.05) (Fig. 7a). Within the F2 generation, Cdkn1c expression was similar between sham and IUGR offspring, in both maternal and paternal lines (Fig. 7b and 7c). A similar result was also seen for Snrpn, in which the gene expression was lower in IUGR female rats compared to IUGR males at E20 (−34%, P < 0.05) (Fig. 8a). Meanwhile, there was no differences in Snrpn expression in the E20 sham group, at PN1 time point, or in the F2 generation (Fig. 8a, 8b, and 8c). Peg3 expression, regardless of treatment, sex, and time point, was similar among all groups within each generation (Fig S2). However, when data from all males and females in the F2 maternal line were combined (as 6 and 12 months old rats were litter siblings), there was a sex-specific difference in Peg3 expression in the sham group but not the IUGR group (Fig S3a). This result was not observed in the paternal line (Fig S3b). Furthermore, within the F2 generation, there was a large variability in gene expression within each group with no statistical differences found between treatments, sexes, or time points, which was due to the low expression of all genes at 6 and 12 months.
Normalized expression of Kcnq1 in kidney tissues of sham and IUGR rat offspring in the first (F1; a) and second (F2; b, c) generations. The mean value within each group is indicated by a black line. Significance was determined by a Tukey’s post hoc test following linear mixed effect models in each generation and parental line (**P < 0.01; n = 6–13 samples per group).

Normalized expression of Cdkn1c in kidney tissues of sham and IUGR rat offspring in the first (F1; a) and second (F2; b, c) generations. The mean value within each group is indicated by a black line. Significance was determined by a Tukey’s post hoc test following linear mixed effect models in each generation and parental line (*P < 0.05; n = 6–13 samples per group).

Normalized expression of Snrpn in kidney tissues of sham and IUGR rat offspring in the first (F1; a) and second (F2; b, c) generations. The mean value within each group is indicated by a black line. Significance was determined by a Tukey’s post hoc test following linear mixed effect models in each generation and parental line (*P < 0.05; n = 6–13 samples per group).

Discussion
Epigenetic modifications, including DNA methylation, have been reported to be associated with fetal growth restriction in numerous human Reference Heijmans, Tobi and Stein41–Reference Novielli, Mandò and Tabano44 and animal Reference Gonzalez-Rodriguez, Cantu and O’Neil22,Reference Martínez, Pentinat and Ribó28,Reference Pham, MacLennan, Chiu, Laksana, Hsu and Lane45–Reference Fujioka, Nishida and Ashina47 studies. In the current study, we examined the gene expression of key enzymes involved in DNA methylation in kidney tissues of IUGR rats. This study found that Dnmt3a expression was decreased in the kidney of IUGR rats compared to sham at E20, 2 d after UPI was induced. This is consistent with the overall decrease in DNA methylation seen in kidneys from growth-restricted offspring. Reference Wanner, Vornweg and Combes48 These results are not surprising as the DNMT3A enzyme is responsible for de novo DNA methylation, especially during embryonic and fetal developmental stages and, therefore, is more likely to be altered by IUGR. Reference Yang, Huang and Shiue49,Reference Watanabe, Suetake, Tada and Tajima50 Moreover, although the completion of nephrogenesis in rats usually takes place at PN11-15, Reference Seely51 E14-20 is a critical time in kidney development, in which the metanephric mesenchymal to epithelial transformation, an important process in nephron formation, occurs. Reference Abdel-Hakeem, Henry and Magee52 Consequently, Dnmt3a changes at E20 are more likely to alter DNA methylation, including that of imprinted genes and, hence, impacts on gene expression, such as Cdkn1c. Reference Kaneda, Okano and Hata53 A similar result was reported by Peña et al. in which Dnmt3a, but not Dnmt1, expression was significantly altered in the placenta of rats whose mother experienced restraint stress (i.e., captivity in a small cage) during gestational days 14–20. Reference Peña, Monk and Champagne54 The up-regulation of Dnmt3a expression in that study was associated with a decrease in placental 11β-hydroxysteroid dehydrogenase type 2 (HSD11B2) expression, which plays an important role in protecting cells from the apoptosis triggered by cortisol. Reference Peña, Monk and Champagne54 On the contrary, a study by Wanner et al. on mouse kidney tissues at E19.5 showed a reduced number of nephron progenitor cells, nephron numbers, and kidney weight to body weight ratio in association with Dnmt1, but not Dnmt3a, deletion. Reference Wanner, Vornweg and Combes48 Although these studies were not carried out on the same model as the one used in this study, their findings still support the importance of DNA methyltransferases in embryonic and fetal development, and that alterations of these key epigenetic enzymes may impact kidney development.
In addition to DNA methyltransferases, we also identified changes in imprinted genes known to have a critical role in kidney development, including Kcnq1, Cdkn1c, Snrpn, and Peg3. Kcnq1 is known to encode one of the pore-forming subunits (α) of voltage-gated potassium channels, which play an important role in maintaining ion homeostasis in cardiac and epithelial tissues, including renal epithelial tissues. Reference Jespersen, Grunnet and Olesen39 In IUGR studies in humans, KCNQ1 was shown to be increased in different cells and tissues, such as amniocytes Reference De-Crescenzo, Sparago and Cerrato55 and placentas. Reference Cordeiro, Neto, Carvalho, Ramalho and Dória56 In this current study, there was also an increase in expression of Kcnq1 in kidney tissues of IUGR offspring at PN1, suggesting an effect of IUGR on this gene.
For the Cdkn1c gene, its expression in kidney tissues of F1 IUGR offspring was altered in a sex-specific manner at E20. At PN1, the sex-specific difference in the IUGR group was lost; however, there was lower Cdkn1c expression in IUGR offspring compared to sham at PN1, suggesting a maintenance of the IUGR effect on this gene. To our knowledge, this current research is novel as it is the first study to investigate the expression of the imprinted gene Cdkn1c in kidney tissues of UPI-induced IUGR offspring, from late gestational to early postnatal stage. However, the imprinted gene, 11β-HSD2, has previously been shown to be down-regulated in kidneys of UPI-induced IUGR offspring at birth and postnatal day 21 and this down-regulation was due to epigenetic changes. Reference Baserga, Hale and Wang57,Reference Baserga, Kaur and Hale58 In regard to the function of Cdkn1c in the development, the human ortholog CDKN1C is known to encode one of the cyclin-dependent kinase complex (CDK) inhibitors called p57Kip. Reference Lee, Kozuki and Cousens2,Reference Stampone, Caldarelli and Zullo35 Via its regulation of CDK activities, p57KipReference Lee, Kozuki and Cousens2 plays an important role in controlling the cell division cycle, especially during embryogenesis. Reference Stampone, Caldarelli and Zullo35 Therefore, it is expected that changes in Cdkn1c expression at E20 may contribute to smaller pup weight, and aberrant expression of Cdkn1c in IUGR kidneys may affect nephrogenesis, which may predispose animals to kidney disease and hypertension later in life. In line with our study, significantly decreased expression of CDKN1C was found to be correlated with the aberrant development of embryonic renal cells and growth of aggressive renal tumors in humans. Reference Algar, Muscat and Dagar37,Reference Schwienbacher, Angioni and Scelfo59,Reference Gadd, Sredni, Huang and Perlman60 Meanwhile, increased expression of CDKN1C/Cdkn1c in response to adverse in utero environments has been reported in the placenta in other models, such as IUGR due to maternal cadmium exposure at embryonic day 7.5, Reference Xu, Wu, Yang and Wang61 selective IUGR in monozygotic twins induced by unequal placental sharing, Reference Gou, Liu and Shi62 or LBW singletons as a result of assisted reproductive technology (ART). Reference Chen, Chen and Lv63
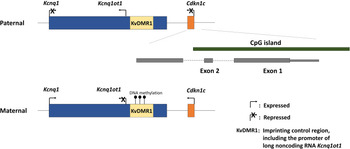
Interestingly, Kcnq1 and Cdkn1c are located next to each other on the rat chromosome 1q42 region 1 (as per the human imprinting region 11p15; Fig. 9). Both KCNQ1 and CDKN1C are paternally imprinted and their expression is controlled by DNA methylation of the KvDMR1 imprinting control region (ICR) located in KCNQ1. Reference Cordeiro, Neto, Carvalho, Ramalho and Dória56,Reference Saha, Verma, Pathak and Mishra64 Furthermore, Cdkn1c contains a large CpG island, spanning its promoter and exons 1 and 2. Via studies in mice, the monoallelic expression of the paternally imprinted Cdkn1c has been established to be a result of the coordination between DNA methylation of the Cdkn1c CpG island region in the paternal allele (secondary, maintaining imprinting status) and DNA methylation of the KvDMR1 ICR in the maternal allele (primary, introducing imprinting status; Fig. 9). Reference Bhogal, Arnaudo, Dymkowski, Best and Davis65 Loss of KvDMR1 function results in the repression of the maternally expressed Cdkn1c allele and re-expression of the paternally imprinted Cdkn1c allele, which is associated with lower pup weight (i.e., a fetal growth restriction phenotype). Reference Fitzpatrick, Soloway and Higgins66 Nonetheless, observations of increased KCNQ1 and CDKN1C expression were reported in a KvDMR1 deletion model, Reference Mancini-Dinardo, Steele, Levorse, Ingram and Tilghman67 as well as in amniocytes Reference De-Crescenzo, Sparago and Cerrato55 and placentas Reference Cordeiro, Neto, Carvalho, Ramalho and Dória56 of IUGR fetuses in association with a reduction in the DNA methylation status of the KvDMR1 ICR. Reference De-Crescenzo, Sparago and Cerrato55,Reference Cordeiro, Neto, Carvalho, Ramalho and Dória56 However, in this study, Cdkn1c expression was decreased in a sex-specific manner in kidney tissues of IUGR offspring at PN1, while the expression of Kcnq1 markedly increased. Therefore, further research is needed to elucidate the relationship between Kcnq1 and Cdkn1c in kidney development and how their gene expression is regulated and disrupted in IUGR offspring.
Kcnq1 and Cdkn1c are located on the rat chromosome 1q42 region 1 (as per the human imprinting region 11p15) (modified from Saha et al. Reference Saha, Verma, Pathak and Mishra64 and the UCSC Genome Browser on Rat Jul. 2014 (RGSC 6.0/rn6) assembly). As a result of DNA methylation of the KvDMR1 imprinting control region on the maternal allele, both Kcnq1 and Cdkn1c are maternally expressed. Imprinting status of the Cdkn1c paternal allele is also maintained by DNA methylation of the CpG island spanning Cdkn1c promoter, exons 1 and 2.

In this current study, besides Kcnq1 and Cdkn1c, Snrpn is another maternally imprinted gene that was altered in the F1 IUGR offspring. Snrpn is involved in RNA splicing and has been shown to have tissue-specific methylation of two differentially methylated regions (DMRs) on the 5’ and 3’ end of the locus during development. Reference Miyazaki, Mapendano and Fuchigami68 Loss of imprinting of SNRPN has been reported in IUGR placental tissues in humans, in association with decreased SNRPN expression. Reference Diplas, Lambertini and Lee69,Reference Bourque, Avila, Peñaherrera, von Dadelszen and Robinson70 Reduced DNA methylation at the Snrpn ICR was seen in placentas of ART-induced growth-restricted mice at embryonic day 10.5. Reference Li, Chen and Tang71 Future research might investigate whether the lower Snrpn kidney expression in E20 IUGR females compared to IUGR males is associated with epigenetic changes.
In contrast to other studies that reported a multigenerational transmission of altered gene expression associated with IUGR, Reference Gonzalez-Rodriguez, Cantu and O’Neil22,Reference Martínez, Pentinat and Ribó28 in this study, no altered expression patterns of Kcnq1, Cdkn1c, or Snrpn were detected in the F2 generation. However, in the F2 maternal line, Peg3 was expressed in a sex-specific manner in sham but not the IUGR offspring, although there was no sex-specific expression differences of this gene in the F1 generation. This observation remains to be explained, although it is likely to involve an epigenetic mechanism.
There was a limitation in this current study, as the imprinted gene expression at E20 and PN1 time points of the F2 generation or 6 and 12 months in the F1 generation were not available for investigation. Additionally, without the assessment of DNA methylation status of these genes in IUGR offspring at different time points in both F1 and F2 generation, it is not possible to confirm at this stage whether the altered gene expression in the F1 generation was due to an epigenetic mechanism that was not transmitted to the F2 generation.
In conclusion, this study demonstrates for the first time in kidney tissues of UPI-induced rats that IUGR is associated with altered expression of imprinted genes known to be important for kidney development in the F1 generation. The abnormal expression of these imprinted genes was shown to be associated with aberrant Dnmt3a expression at fetal, but not postnatal life, suggesting a critical time point in fetal kidney development that is sensitive to epigenetic changes. The reported altered phenotypic outcomes (including pup weight and kidney weight) in IUGR offspring are in agreement with the hypothesis that epigenetic changes occurring early in life, especially during fetal developmental stages, have the potential to program long-term risk of chronic diseases later in life. Reference Barker4
Supplementary material
To view supplementary material for this article, please visit https://doi.org/10.1017/S2040174420001257
Acknowledgments
The authors would like to thank Sandy Khor and Neil Shirley (The University of Adelaide) for their assistance in experimental design and Qiagility liquid-handling robot programming and setup. The authors also gratefully acknowledge James Cowley (The University of Adelaide) for the assistance with statistical analyses of data.
Financial support
This research was supported by the National Health and Medical Research Council (NHMRC) of Australia (M.E.W.; 1045602), the Heart Foundation (M.E.W.; G 11M 5785), a La Trobe University Faculty of Health Sciences Research Grant Award (T.R.), and a Robinson Research Institute (RRI) Seed Grant (T.B-M, M.E.W. and J.F.B.) and supported by the School of Agriculture, Food and Wine, University of Adelaide.
Conflicts of interest
None.
Ethical standards
The authors assert that all procedures contributing to this work comply with the ethical standards of the relevant national guides on the care and use of laboratory animals and have been approved by the University of Melbourne’s Animal Experimentation Sub-Committee and the La Trobe University’s Animal Ethics Committee.