Introduction
There is a general perception that the welfare of farm animals improves as the system of management becomes more extensive. It is generally perceived that under extensive systems domestic animals should be adapted to the ‘natural’ conditions that pertain and consequently experience less stress. However, the welfare of extensively managed animals may not necessarily be enhanced (Lawrence and Appleby, Reference Lawrence and Appleby1996). Adverse physical and social environments may challenge welfare and artificial selection since domestication has potentially changed the animals such that they are not fully adapted for extensive management systems. Thus, the assessment of welfare of animals in extensive systems requires to be addressed from the animal’s perspective (Turner and Dwyer, Reference Turner and Dwyer2007). The Five Freedoms (Farm Animal Welfare Council, 2005) provide one approach for assessing the broad range of challenges faced by farm animals and it is likely that the balance of these challenges will alter depending on the degree of extensification. Depending on the region, freedom from hunger and discomfort are particularly pertinent to the extensive management of beef cows in winter since they are often allowed to lose body condition (The Scottish Agricultural College (SAC), 1978) and, if kept outdoors, weather conditions (cold, wind and rain) may present a challenge to thermoregulation.
Under the appropriate field conditions (soil type and climate) out-wintering pregnant beef cows on winter fodder crops and conserved forage offers the management advantages of reduced bedding and feeding costs and has the potential to reduce disease (Hill, Reference Hill2006). However, when cattle are out-wintered in Northern Britain there may be periods when the climatic and animal conditions result in the animals experiencing cold stress, defined as periods when the ambient temperature is below their lower critical temperature (LCT). In addition, rainfall and soil conditions may result in wet and matted coats with potential implications for thermoregulation and comfort. Periods of cold stress are influenced by the energy intake and resulting heat production of the animal and there are well-established models to calculate the LCT and energy demand for the maintenance of body temperature (Blaxter, Reference Blaxter1977; National Research Council (NRC), 2000). However, these models are based on metabolic and physical relationships of heat production and loss and are not validated against the cow’s perception of its state of welfare. For example, there is relatively little understanding at which point behaviour (as an indication of the animal’s evaluation of its state) may change in response to a physical challenge and how such behavioural responses correspond with predictions from the physical models.
In this experiment we aimed to explore the relationships between behaviour and the predicted physical challenges experienced by out-wintered beef cows. To do this, we managed groups of pregnant beef cows at two body condition scores (CS) exposed to winter conditions in Southern Scotland and where feed and shelter were physically separated, requiring cows to make choices to access these resources.
Material and methods
Experimental site
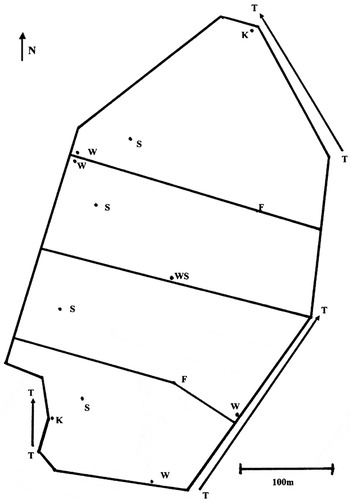
The experiment was carried out at the SAC Bush Farms in Midlothian (55:52:10N; 3:12:46W). The site comprised two fields of 6.3 and 7.5 ha separated by a fence and each field was divided into two paddocks using electric fencing (see Figure 1). The fields were situated below the Pentland Hills and the eastern edge of the fields was at an elevation of 200 m above sea level and the western edge at 225 m. Previous to the experiment, the fields had produced a crop of barley and thus they contained straw stubble and some natural grass growth.
The experimental site comprising two fields each divided into two paddocks. F: feeding sites with ring feeders on each side of electric fence; K: subsidiary weather stations; S: shelters; T: wooded areas; W: water trough; WS: main weather station.

A feeding site was created for each paddock by placing large round straw bales in a gap in the electric fence between the paddocks. Access to the bales by the cows was prevented by an electric fence, which was used as a feed barrier when the concentrate pellets were fed on the ground. In each paddock, a woodchip base provided a dry feeding area and straw was fed from the bale placed in a ring feeder (diameter 2 m; height 1.4 m; 20 feeding spaces 290 mm wide × 700 mm high) on the woodchips. Each day a new bale (approximately 175 kg) was placed in the ring feeder. There was no shelter over the ring feeder. In addition, each paddock had a water trough.
Along the western edge of the fields there was a ridge approximately 1 m high with a single line of mature trees and this provided some shelter. More shelter was provided by the wooded areas shown in Figure 1. In addition, an unroofed artificial shelter was created in each paddock at a distance of 100 to 160 m from the feeding area. This comprised plastic mesh (Farmflex 45/55 Mesh; Galebreaker Products, GBR Industries Ltd, Gloucestershire, UK) 1.6 m high in a ‘Y’ shape with 9 m arms.
Cows
A total of 20 Aberdeen Angus cross cows and 20 Limousin cross cows, drawn from a herd of two-breed reciprocal crossing between Aberdeen Angus and Limousin, were allocated according to CS, to one of four groups to achieve five cows of each breed per group. The 40 cows had been selected from the SAC spring calving herd at weaning using a target CS (Lowman et al., Reference Lowman, Scott and Somerville1976) of 3.0 (scale 1 = thin to 5 = fat). The mean (± s.e.) cow weight (kg) and CS was Group A: 731 (16.5) and 3.03 (0.059), Group B: 722 (10.6) and 2.98 (0.058), Group C: 734 (14.1) and 2.95 (0.062) and Group D: 751 (18.6) and 2.98 (0.058), respectively. The date of weaning and selection was 3 weeks before the start of the experiment at which time the cows weighed Group A: 707 (19.3), Group B: 701 (10.4), Group C: 711 (13.8) and Group D: 733 (19.2) kg. The cows were in parities 2 to 8 with a mean of 5.0 (4.7, 4.7, 5.4 and 5.3 for Groups A, B, C and D, respectively).
Design
Data collection was carried out over 12 weeks. The four groups of cows were allocated at random to the four paddocks and rotated around them using a Latin square design with periods of 3 weeks. The experiment started 16 weeks before the expected calving date, thus, the mid-point of Periods 1, 2, 3 and 4 were 15, 12, 9 and 6 weeks before calving, respectively. The experiment was authorised by the Animal Experiments Committee of the SAC.
Treatments
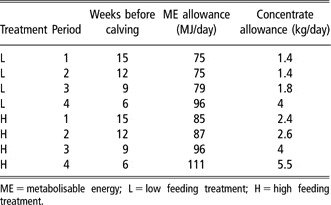
The cows were offered barley straw ad libitum and were supplemented with a pelleted concentrate, given in the morning, to achieve two levels of energy intake. The high feeding treatment (H: groups B and D) was designed to maintain CS at 3.0 throughout the experiment. The low treatment (L: groups A and C) was formulated to provide energy at a level which would allow the cows to lose CS and calve at a score of 2.5 as is normally recommended in practice (The Scottish Agricultural College (SAC), 1978). Each feeding treatment was offered to two groups of cows. Concentrate feeding levels were calculated using the SAC FeedByteFIM ration formulation program (based on the requirements of the Agriculture and Food Research Council (AFRC), 1993), assuming that the cows were 15, 12, 9 and 6 weeks before calving in experimental Periods 1, 2, 3 and 4, respectively. One unit of CS was assumed to be 0.13 × live weight (Wright and Russel, Reference Wright and Russel1984). No allowance was made for the fact that the cows were out-wintered. Predicted straw intakes were around 9 to 10 kg dry matter (DM)/day and it was assumed that the straw contained 6.3 MJ metabolisable energy (ME)/kg DM. The allowance of concentrate (kg/day) is given in Table 1 and was adjusted during the course of the experiment to achieve the target CS changes.
ME allowance (MJ/day) and concentrates offered (kg/day) according to treatment (L or H) and period (with straw offered ad libitum)

ME = metabolisable energy; L = low feeding treatment; H = high feeding treatment.
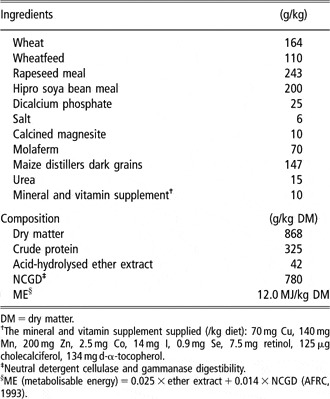
The concentrate was provided as a large pellet (diameter 15 mm) and its ingredient and chemical composition is given in Table 2. The concentrate provided adequate levels of protein and contained a mineral and vitamin supplement.
Ingredient and determined chemical composition of concentrate

DM = dry matter.
†The mineral and vitamin supplement supplied (/kg diet): 70 mg Cu, 140 mg Mn, 200 mg Zn, 2.5 mg Co, 14 mg I, 0.9 mg Se, 7.5 mg retinol, 125 μg cholecalciferol, 134 mg d-α-tocopherol.
‡Neutral detergent cellulase and gammanase digestibility.
§ME (metabolisable energy) = 0.025 × ether extract + 0.014 × NCGD (AFRC, 1993).
Records
Animals
The cows were weighed at the beginning of the experiment and at the end of each period. Their CS was measured at the end of each period. Coat thickness was measured on eight cows (four of each breed) taken at random at the end of the experiment. An engineer’s depth gauge was used to measure the depth of the coat at several sites on both sides of the cow in three horizontal lines to give a minimum of 24 measurements per cow with at least one measurement from the neck, the top of the front leg and the middle section of the rear leg (Blaxter and Wainman, Reference Blaxter and Wainman1964; Webster et al., Reference Webster, Chlumecky and Young1970).
Behaviour
The cows in each group were identified individually by applying tail tape of differing colours according to a code and by spray-painting their number on their sides. On six occasions (three morning (0900 to 1200 h) and three afternoon (1230 to 1530 h)) in each period the behaviour of the cows was assessed by taking six instantaneous scan samples every 30 min and recording posture, behaviour and location of each cow. The observation sessions were limited to 0900 to 1530 h owing to the low daylight outwith these times.
Climate
In order to assess the thermal demand on the cows a weather station (Vantage Pro2; Davis Instruments, Hayward, CA, USA) was situated half way along the fence line between the two fields (Figure 1) This was used to record air temperature, humidity, wind speed and direction, rainfall, atmospheric pressure and solar radiation. The console was fitted with a data logger (Weatherlink; Davis Instruments, CA, USA), which accumulated records every 30 min. Supplementary climate information (temperature, humidity and wind speed) was recorded every 30 min at two sites by the tree shelter belts at each end of the fields (Figure 1) using a Kestrel 4000 Weather Tracker (Richard Paul Russell Ltd, Lymington, UK) fixed to a wind vane.
Estimation of lower critical temperature
The heat production of the cow was calculated as HP = MEI – ER, where MEI is the assumed metabolisable energy intake and ER is the calculated energy retained in the conceptus (AFRC, 1993; adjusted for mean calf birth weight) and retained or mobilised as maternal body weight (24.4 MJ/kg; NRC, 2000). The heat production was then used to calculate the LCT of the cows using the models of Blaxter (Reference Blaxter1977) and NRC (2000) as follows: maternal body weight change was calculated as measured weight change minus weight change of conceptus calculated from the Agricultural Research Council (1980), adjusted for mean calf birth weight. For the model of Blaxter (Reference Blaxter1977) the coat depth was 13 mm, as measured on the eight cows at the end of the experiment; the cow body radius was calculated (from heart girth) to be 340 mm for cows of 700 kg (Wanderstock and Salisbury, Reference Wanderstock and Salisbury1946); minimum evaporative loss was assumed to be 1.5 MJ/m2 per day (Blaxter, Reference Blaxter1977); tissue insulation was assumed to be 1.59°C/m2 per day per MJ (Blaxter, Reference Blaxter1977); external insulation was calculated from air insulation, coat insulation and solar radiation according to Joyce et al. (Reference Joyce, Blaxter and Park1966; adapted according to Blaxter (Reference Blaxter1977)), using cow radius and coat depth as above, wind speed and solar radiation recorded in each period with an emissivity of 0.85 (Blaxter, Reference Blaxter1962) and assuming half the cow’s surface area was exposed to the solar radiation. For the NRC (2000) model, the mean cow CS for each treatment in each period was used, the hide thickness was assumed to be average and the coat condition was assumed to be some mud on lower body.
Statistical analysis
Live weight and condition score change
For performance parameters, period, paddock and treatment effects were tested by analysis of variance with a blocking structure reflecting the nesting of animals within groups and the crossing of animals with periods.
Behaviour
Comparisons of the proportion of time spent exhibiting individual behaviours between treatment regimes, between paddocks, between periods and between morning and afternoon sessions were tested by fitting a mixed model to percentage data for each observation point for each behaviour separately using the residual maximum likelihood procedure (Patterson and Thompson, Reference Patterson and Thompson1971) in Genstat 9. Treatment regimen, paddock, period and morning/afternoon were fitted as fixed effects. Group, group period, period session and group period session terms were fitted as random effects.
Results
One cow was removed from Group D on the second day of the experiment because she was lame. Since this was as a result of a serious wound from the penetration of a nail into the hoof and would take some time to heal, she was not returned to the experiment. Two other milder cases resulted from the lodging of a stone between the claws of the hoof in each cow. Once the stones had been removed the cows recovered quickly. These two cases may have been related to the ground conditions which were soft mud in places with stones around 15 cm below the surface. One cow in Group D aborted at the end of the second period and was removed from the experiment. Two further cows aborted (one in each of Groups A and D) on the 16th day of Period 3 and were removed from the experiment. Veterinary examination of the cows and aborted material did not reveal any common factor that could have been related to the experiment. The cause of the first abortion could not be determined. In the second case, there were suggestions of foetal anoxia owing to placental insufficiency of unknown cause and the third case was attributed to a possible streptococcal infection.
Climatic conditions
A summary of the climatic conditions prevailing in each of the four periods is given in Table 3. The mean ambient temperature varied only slightly across periods but the rainfall was considerably greater at the start of the experiment than the end. The mean wind speed was rather high throughout the experiment. As would be expected for this location and time of year, the solar radiation was low. Data from the subsidiary weather stations showed that the ambient temperature was similar at all sites but the wind speed was considerably reduced at the station placed near the trees in the south west corner of the site (mean wind speeds in Periods 2, 3 and 4 were 1.7, 2.3 and 1.6 m/s).
The climatic conditions prevailing in each of the four periods

Cow condition score and live weight
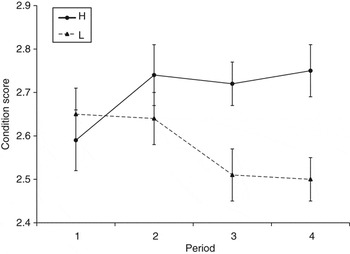
The cows lost more body condition and live weight than was intended, particularly in Groups B and D on the high feeding treatment, and the quantity of concentrate was adjusted accordingly at the end of the second and third Periods in order to return the cows to the intended pattern of CS change (Table 1).
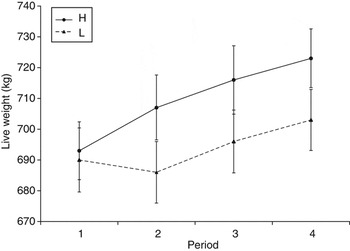
The patterns of CS change and live weight change of the individual groups are shown in Figures 2 and 3, respectively. It can be seen from these figures that the initial fall in CS and live weight below the targets was corrected by the change in feeding regime. There was no overall significant effect of period, paddock or treatment on the CS (L: 2.58, H: 2.70, s.e.d. 0.180, P > 0.05) or live weight (L: 697 kg, H: 707 kg, s.e.d. 3.6 kg, P > 0.05) of the cows.
The mean (± s.e.) condition score of the cows on high feeding (H) (––●––) and low feeding (L) (- -▴- -) treatments measured at the end of each experimental period.

The mean (± s.e.) live weight (kg) of the cows on high feeding (H) (––●––) and low feeding (L) (- -▴- -) treatments measured at the end of each experimental period.

Calf birth weight
For the 37 cows that calved, only one required slight assistance at calving, the rest requiring no assistance. There was no effect of feeding treatment on calf birth weight (L: 44.2 kg, H: 43.5 kg, s.e.d. 1.31 kg, P > 0.05).
Cow behaviour
Posture
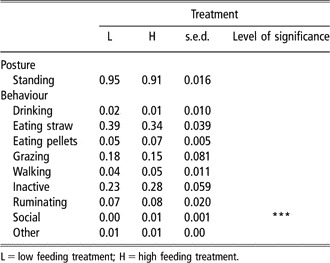
Overall the cows spent most of the time standing (0.931) during the observation sessions. The proportion of observations spent standing was not affected by treatment (Table 4) and was not different for time of observation or paddock. Although the time spent lying apparently increased from 0.04 and 0.02 in Periods 1 and 2, respectively to 0.08 and 0.14 in Periods 3 and 4, respectively, this was not statistically significant.
Effect of treatment on proportion of time spent standing and on each activity in the observation sessions

L = low feeding treatment; H = high feeding treatment.
Activity
The main activities during the observation periods were eating straw (0.364), inactive (0.255) and grazing (0.167). There was no effect of treatment (Table 4) on the proportions of observations in each activity except for more social behaviour on treatment H (P < 0.001). There was more grazing activity (P < 0.05) in Periods 1 (0.33) and 2 (0.22) than in Periods 3 (0.06) and 4 (0.06; s.e.d. 0.050). Grazing activity was also higher (P < 0.01) in Paddocks 3 (0.24) and 4 (0.31) than in Paddocks 1 (0.04) and 2 (0.08; s.e.d. 0.041).
Cow location
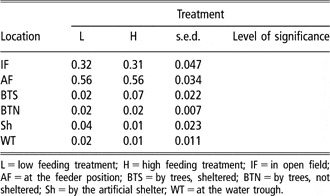
During the observation sessions the cows spent most of the time in the feeder area (0.56) and in the open field (0.32) (Table 5). There was no effect of treatment on the proportion of observations spent in each location. The cows were observed in the field on more (P<0.05) occasions in Paddocks 3 (0.42) and 4 (0.45) than in Paddocks 1 (0.17) and 2 (0.23; s.e.d. 0.075). They were observed more frequently (P < 0.05) at the feeder in Paddocks 1 (0.76) and 2 (0.66) than in Paddocks 3 (0.44) and 4 (0.39; s.e.d. 0.102).
Effect of treatment on proportion of observations spent in each location

L = low feeding treatment; H = high feeding treatment; IF = in open field; AF = at the feeder position; BTS = by trees, sheltered; BTN = by trees, not sheltered; Sh = by the artificial shelter; WT = at the water trough.
Cow lower critical temperature
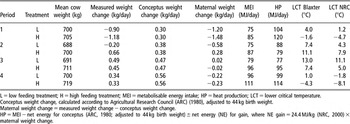
The actual calving dates were about 1 week later than expected, so calculations of conceptus weight change were based on 16, 13, 10 and 7 weeks before calving for Periods 1, 2, 3 and 4, respectively. The calculated heat production of the cows and their LCTs are shown in Table 6. In general the two models gave similar results but the NRC (2000) model always gave a slightly lower LCT than that of Blaxter (Reference Blaxter1977). In Periods 2 and 3 the ambient temperature (Table 3) was consistently below the calculated LCT of the cows and thus they would be expected to have experienced cold stress. However, the models are very sensitive to wind speed and a reduction in this to 3 and 1.5 m/s in Period 2 and 1.25 and 4 m/s in Period 3 would eliminate the thermal demand for treatments L and H, respectively. These are the wind speeds typically recorded by the weather station placed in the shelter of the trees. The correlation coefficient between the average time the cows spent in the shelter of the trees and the average wind speed for each observation session was 0.673 (P < 0.001; n = 24).
Cow live weight (kg), measured live weight change (kg/day), calculated conceptus and maternal weight change (kg/day), assumed metabolisable energy intake (MJ/day), calculated heat production (MJ/day) and lower critical temperature (according to Blaxter or National Research Council (NRC); °C) of the cows on each treatment in each period

L = low feeding treatment; H = high feeding treatment; MEI = metabolisable energy intake; HP = heat production; LCT = lower critical temperature.
Conceptus weight change, calculated according to Agricultural Research Council (ARC) (1980), adjusted to 44 kg birth weight.
Maternal weight change = measured weight change − conceptus weight change.
HP = MEI − net energy for conceptus (ARC, 1980; adjusted to 44 kg birth weight) ± net energy (NE) for gain, where NE gain = 24.4 MJ/kg (NRC, Reference Olson and Wallander2000) × maternal weight change.
Discussion
Feeding treatments and cow production parameters
As the experiment progressed, the allowance of pellets was adjusted in the light of the actual CS and the target values and, although there was no significant effect on CS overall, the cows on treatment H maintained their CS after Period 2 and those on treatment L showed a slow loss, as intended. Restricting the ME intake by 17% (L v. H) had no effect on the behaviour of the cows, calving ease or calf birth weight. Other workers have shown that unless severe restrictions in feeding level (energy allowance) are applied, there are only minor effects, if any, of feeding level on calf birth weight (e.g., Bellows and Short, Reference Bellows and Short1978; Russel et al., Reference Russel, Peart, Eadie, MacDonald and White1979; Bellows et al., Reference Bellows, Short and Richardson1982), with the main effect being on change in cow weight and CS. Thus this lack of effect on calf weight was in agreement with previous studies and suggests that, with cows in good condition initially, a moderate loss of CS over the winter may not be detrimental to cow productivity and calf welfare.
Climatic conditions and calculated lower critical temperature
The experiment was carried out in December 2006 and in January and February 2007. The mean ambient temperatures recorded in the four periods were at the upper end of the range of the mean daily minimum and maximum temperatures given by The Meteorological Office (2008) for this location. Wind speeds were high, with some severe short periods of high winds but speeds were considerably reduced in the area sheltered by the trees in the south-west of the field. The ring feeders and straw bales would also have provided some shelter from the wind and the cows spent a large proportion of the observation periods in this location. The artificial shelters were designed to provide shelter from the wind from most directions, but were rarely used during the observation periods.
Estimates of the LCT of pregnant cows indoors are very low (e.g., −25°C; NRC, 1981) and may be low for cows outdoors in dry, still conditions. However, for cows outdoors, the LCT can be substantially higher depending on factors such as wind speed and coat conditions, to which the models are very sensitive. In fact the LCT of our cows, calculated by both models, was very sensitive to wind speed. Olson and Wallander (Reference Olson and Wallander2002) similarly reported a large effect of wind speed on their standard operative temperature, which was reduced by 3.7°C for each m/s. In Periods 2 and 3, the wind speed recorded in the centre of the fields created conditions where the cows’ LCT was above ambient temperature and they would be expected to suffer discomfort from cold stress. However, a reduction of wind speed to that recorded in the sheltered area removed this theoretical challenge. The shelters and trees were some distance from the feeder area with the intention that the cows should choose between access to shelter or food. However, it was apparent that the feeder and the grouping of the cows around it also provided shelter. The cows spent 0.63 of the time in sheltered locations (by trees, at the feeders and at the shelters) where they were less likely to suffer cold stress than in the open areas of the paddocks. Furthermore, the cows were never observed to be shivering. In the experiment of Olson and Wallander (Reference Olson and Wallander2002), the time cows spent behind windbreaks was not correlated with temperature but more time was spent standing and lying behind shelter when the wind speed was high and the standard operative temperature was reduced.
In practice, beef cows show a further management of exposure to the thermal challenge by adjusting their standing and lying behaviour (Olson and Wallander, Reference Olson and Wallander2002; Keren and Olson, Reference Keren and Olson2006). Standing exposes more surface area to the wind and increases heat loss compared to lying, where the wind speed is lower closer to the ground. However, standing allows the cow to orient the body to gain the maximum solar radiation and tracking the sun while standing requires less energy than repeatedly standing from lying, changing orientation and lying. Integration of the direction of wind and solar radiation will require a further refinement of orientation behaviour.
Ames and Insley (Reference Ames and Insley1975) demonstrated the importance of the coat in providing external insulation. The NRC (2000) model for calculating LCT is particularly sensitive to this factor. Here the coat depth was measured at the end of the experiment and was only 13 mm. At this time the cows were indoors and the weather was relatively mild, so their hair would not have been erect; therefore, it is possible that the calculated LCT were overestimated.
Using a computer model of climatic energy demand, Bruce (Reference Bruce1982) concluded that the savings in ME intake by housing suckler cows during the winter was small at around 7 MJ/day at most. Wassmuth et al. (Reference Wassmuth, Wallbaum and Langholz1999) provided only 40% to 60% of the maintenance energy requirement and speculated that any extra energy intake from pasture and straw bedding would have been small. Nevertheless, their cows, even with unroofed shelters and in more severe weather conditions than those recorded here, maintained their body temperature within the normal range and no cases of hypothermia were recorded. These authors concluded that out-wintering can be designed in accordance with animal welfare by providing dry lying areas and windbreaks. Similarly, Olson and Wallander (Reference Olson and Wallander2002) commented that, although winter weather may be energetically demanding, cows selected over time for such conditions adjust physiologically and behaviourally, providing they have sufficient body condition.
The models of climatic demand agreed well when calculating the LCT of the cows and they indicated that there were times when there were potential welfare challenges. However, the behavioural observations revealed that the cows took action to avoid exposure. This emphasises the benefits to be gained by combining different experimental approaches to interpret conditions.
Rainfall and cow lying behaviour
The cows could only be observed in sessions of 0900 to 1200 and 1230 to 1530 because there was insufficient daylight at other times. Thus only 0.25 of the day’s activity was recorded. The cows spent most of the time during the observation sessions standing and, although there was an apparent increase in time spent lying in Period 4, when the ground was drier, this did not reach significance. Compared to the average rainfall in this location (The Meteorological Office, 2008), the precipitation during the experiment was characterised by a progression from very wet conditions in Period 1 to a dry Period 4. Soil conditions reflected this rainfall pattern with very muddy conditions at the start, particularly around the feeding area. The wet nature of the soil conditions may have discouraged the cows from lying down in the first part of the experiment.
Olson and Wallander (Reference Olson and Wallander2002) quoted work that showed that large ruminants spend 40% or more of their time lying during the winter. This is to reduce convective heat loss since the wind speed is lower closer to the ground. However, this does require the ground surface to be dry. Their cows spent 0.10 to 0.13 of the time lying between the daylight hours of 0745 and 1715. The cows in our experiment, during a similar observation period, spent a similar low amount of time lying. Several authors have reported an inverse relationship between lying time and the moisture content of the lying surface (e.g., Keys et al., Reference Keys, Smith and Weinland1976; Fregonesi et al., Reference Fregonesi, Veira, von Keyserlingk and Weary2007). When dairy cows had access to stalls with dry bedding, their lying time was 13.8 h/day but with wet bedding this fell to 8.8 h/day (Fregonesi et al., Reference Fregonesi, Veira, von Keyserlingk and Weary2007) which is well below the inelastic demand of 13 h/day reported by Jensen et al. (Reference Jensen, Pedersen and Munksgaard2005). Munksgaard et al. (Reference Munksgaard, Jensen, Pedersen, Hansen and Matthews2005) found that lying time had a higher priority than social contact or eating time. Tucker et al. (Reference Tucker, Rogers, Ververk, Kemball, Webster and Matthews2007) and Webster et al. (Reference Webster, Stewart, Rogers and Verkerk2008) created extreme outdoor weather conditions using water sprinklers and fans and cows spent less time lying with wet conditions than cows housed indoors. In both reports, the outdoor cows also had elevated plasma cortisol concentrations, indicative of stress, a result also reported by Krohn and Konggaard (Reference Krohn and Konggaard1982) in lying-restricted cows. Wassmuth et al. (Reference Wassmuth, Wallbaum and Langholz1999) concluded that a lack of a dry lying area could lead to a disturbance of lying behaviour with adverse effects on animal welfare and Metz (Reference Metz1985) similarly concluded that an imposed short-term restriction of lying impairs the well-being of cows.
It is evident that the restriction of lying time imposed by wet lying surface conditions constitutes a challenge to the welfare of cows.
Conclusion
Physical records and climatic energy demand models are useful for identifying potential welfare challenges to out-wintered cows. However, the cows used behavioural adaptation in seeking shelter from the wind to counteract the potentially adverse climatic conditions. This experiment has demonstrated the benefits of combining physical and behavioural approaches to assessing welfare.
Acknowledgements
The authors are grateful to Bert Tolkamp, Jimmy Hyslop and Simon Turner for helpful discussion in designing the experiment and to Ian Nevison for statistical advice. Neil Scott condition-scored the animals and Sarah Ison, Mhairi Jack and Jo Donbavand gave invaluable technical assistance. Ken Oman and Dougie Watt took care of the day-to-day management of the cows. The experiment was funded by the Rural and Environment Research and Analysis Directorate of the Scottish Government.