Introduction
In 2007 we undertook a systematic review of psychotic experiences (PE) to examine questions on the validity of the psychosis continuum (van Os et al. Reference van Os, Linscott, Myin-Germeys, Delespaul and Krabbendam2009). The review revealed that more than 8% of the general population report PE; that for many, PE are not associated with clinical impairment; and PE are predicted by those factors that also predict non-affective psychotic disorder. Since 2007, the number of publications on PE in the general population has increased dramatically. Our aims were to undertake a new review of this literature and to address two specific objectives. First, the reported rate of PE in the general population (8%) may have been overestimated because the review included self-report data derived from items that describe phenomena that, although like psychosis, would almost certainly not constitute evidence of psychotic phenomena. Therefore, in this review we adopted a much more conservative approach to self-reported PE to determine whether our previous conclusions were justified. Second, the large increase in available data affords an opportunity to test the psychosis-proneness–persistence–impairment model of psychotic disorder. Therefore, we identified key propositions of this model and tested these by review and meta-analysis of epidemiological evidence of the frequency, persistence and outcome of PE. Other types of evidence are undoubtedly relevant but are not considered here.
PE and continuity
PE comprise hallucinations and delusions. PE may or may not be bizarre, engender distress, draw attention or prompt help seeking. They comprise phenomena that may be appraised as clinically relevant symptoms or as subclinical, not reaching a threshold of clinical relevance because of the absence of sufficient corollaries of disorder. PE merge somewhat indistinguishably with hallucination- and delusion-like personality, individual difference or dispositional characteristics. In combination, these are referred to as schizotypal personality, schizotypy or psychosis-proneness. Although psychotic disorder currently may be diagnosed in the absence of PE, PE is typically only used narrowly, in reference to hallucinations and delusions and not other phenomena that may also characterize psychotic disorder.
It is frequently claimed that PE are continuous, although what is meant precisely is seldom specified. There are three ways to understand continuity: first, phenomenological continuity refers to the idea that PE that are characteristic of psychotic disorder are not exclusive to disorder, and that PE occur independently of disorder, differing only quantitatively from dispositional or personality variables captured by the notion of psychosis-proneness or schizotypy. Second, temporal continuity or persistence refers to the idea that PE may endure over time. Third, structural continuity relates to the distribution of PE in the general population; that is, whether a population is composed of a single class of people, with or without quantitative variation in phenotype expression, or two or more classes of people with qualitatively distinguishable phenotypes that may or may not also vary quantitatively.
The psychosis-proneness–persistence–impairment model holds that PE are continuous with psychotic disorder in two senses. In the model, early expression of psychosis-proneness, incorporating PE, is typically transient and relatively common. However, stressors act to prolong and exacerbate the severity of psychosis-proneness, increasing the probability of clinical significant PE, need for care, and psychotic disorder (van Os et al. Reference van Os, Linscott, Myin-Germeys, Delespaul and Krabbendam2009). Thus, the psychosis-proneness–persistence–impairment model involves concepts of both phenomenological and temporal continuity.
This model of continuity between PE and disorder incorporates two important propositions: first, the PE–disorder relationship is part of the pathogenesis of psychotic disorder insofar as PE occur early in the sequence that results in the onset of disorder. Second, the relationship is probabilistic and not deterministic. Factors that affect the odds of disorder include PE attributes (e.g. intrusiveness, frequency) in addition to prior and co-occurring variables that increase stress, whether psychosocial and biological, or decrease the effectiveness of compensatory mechanisms and coping behaviour (Johns & van Os, Reference Johns and van Os2001). Similar propositions are inherent in other continuity models (e.g. Meehl, Reference Meehl1990).
By contrast, this model does not require structural continuity (a single class with quantitative variation in expression) and is compatible with basic forms of both structural continuity and discontinuity. Indeed, the weight of evidence suggests that the general population is composed of two classes, one corresponding to a liability class and the other an unaffected complement (Fossati & Lenzenweger, Reference Fossati and Lenzenweger2009; Linscott et al. Reference Linscott, Allardyce and van Os2010). However, this evidence is also affected by significant psychometric, method and interpretive challenges (Maraun et al. Reference Maraun, Slaney and Goddyn2003; Linscott & van Os, Reference Linscott and van Os2010; Linscott, unpublished observations).
Tests of the psychosis-proneness–persistence–impairment model
Several types of evidence cannot be interpreted as supporting, or even consistent with, phenomenological continuity. The shape or structure of the distribution of PE in the general population depends substantially on structural continuity or discontinuity and so does not indicate phenomenological continuity. Moreover, the arbitrary nature of measurement, particularly of psychosis-proneness, means that simple distributions of scores do not necessarily reflect the true underlying distribution (Blanton & Jaccard, Reference Blanton and Jaccard2006).
If PE by definition occur independently of psychotic disorder and include subclinical experiences, it is tautological to argue that the greater prevalence of PE over disorder is evidence of phenomenological continuity; a difference could be explained by subclinical PE. In addition, given PE are neither necessary nor sufficient for the diagnosis of psychotic disorder (e.g. schizophrenia can be diagnosed in the absence of hallucinations and delusions, and the presence of hallucinations is not sufficient for the diagnosis of schizophrenia; APA, 2000), there is also no firm ground for predicting that the prevalence of PE is greater than that of psychotic disorder; an absence of difference could be attributed to diagnostic definitions. For the same reason, the prevalence of persistence over an interval may be greater than the incidence of psychotic disorder over that interval, but this is not required. However, if a narrower set of clinically relevant PE were observed to be more common than psychotic disorder, this difference could not be attributed to subclinical PE and so may be evidence consistent with phenomenological continuity (APA, 2000).
The best tests for phenomenological continuity derive from the proposition that PE arise from fundamental pathogenic mechanisms that also produce psychotic disorder. In other words, PE should generally behave like psychotic disorder itself or as if these are on the path to disorder. This proposition leads to hypotheses on the rates of PE in general population samples and relationships between PE and key risk factors (substance misuse, urbanicity, unemployment, marital status, trauma, ethnicity, migration, education, family history). In particular, the odds of PE should be greater among those exposed to factors known to predict psychotic disorder. Insofar as any of these risk factors distinguish among cohorts (e.g. urbanicity), these factors should also account for variability in PE across cohorts.
Persistence requires several outcomes. If PE are temporally continuous with psychotic disorder, PE should persist over time and should be associated with psychotic disorder outcomes. Second, given the probabilistic nature of the relationship, assuming other variables are equal (e.g. risk factors, measurement criteria), the rate of outcome should have a constant relationship with the rate of PE and the rate of persistence. By implication, the rate of persistence should have a constant relationship with the rate of PE.
Methodological considerations
In the 2007 review, rate estimates were based in part on data from self-report measures containing items that refer to both PE and dispositional phenomena (van Os et al. Reference van Os, Linscott, Myin-Germeys, Delespaul and Krabbendam2009). An important criticism of that review is that rates may have been inflated by inclusion of semantically related phenomena that would not normally count towards a diagnosis of psychotic disorder. In the systematic review reported here, we restricted our focus to rates obtained using (a) diagnostic or screening instruments administered in an interview format and (b) items from self-report instruments only if these refer to specific, happened, personally relevant events that are unlikely to be culturally accepted or to have reasonably probable realistic interpretations. The effects of assessment mode were also ascertained.
Method
Sample
We obtained the intersection of three sets of research papers published from 1950 to August 2010 and listed in Medline or PsycINFO: (a) entries containing any of the (truncated) keyword phrases ‘delus’, ‘hallucinat’, ‘paranoi’, ‘psychoses’, ‘psychosis’, ‘psychotic’, ‘schizophr’ or ‘schizotyp’; (b) entries containing one or more of ‘incidence’, ‘prevalence’, ‘sensitivity’ or ‘specificity’; and (c) entries containing ‘general population’, ‘normal population’, ‘normal individuals’, ‘normal sample’, ‘healthy population’, ‘healthy individuals’, ‘healthy sample’, ‘community individuals’, ‘community sample’, ‘nonpsychotic’, ‘survival’, ‘screening’ or ‘subclinical’. The intersection set contained 1925 records for human samples. We read the title of each paper and, as necessary, the abstract and the paper itself to find reports on the incidence or prevalence of hallucinations or delusions in general population samples. Papers were retained if they met the following criteria and information was sufficient to determine this was the case:
(1) The paper described one or more studies of PE in general population samples.
(2) The sample n available for analysis was at least 100.
(3) The results included precise incidence or prevalence rates of dichotomous phenotype outcomes or count data or scores from which such rates could be derived.
(4) Where rates were based on self-report, data came only from items that referred to specific, happened, personally relevant events (e.g. ‘Have you ever felt you were under the control of some special power?’ was included but ‘Do you ever feel as if you are under the control of some force or power other than yourself?’ was not because the latter includes the hypothetical qualifier ‘as if’ and offers an interpretation the individual may or may not have arrived at unaided), events unlikely to be culturally accepted (e.g. ‘Do you believe in the power of witchcraft, voodoo or the occult?’ was excluded because the item describes the beliefs of a significant cultural subgroup), and events that do not have reasonably probable non-pathological interpretations (e.g. ‘Have you ever known what another person was thinking even though that person wasn't speaking?’ was excluded because non-verbal communication has this effect; Hays et al. Reference Hays, Niven, Godfrey and Linscott2004). Item coding is reported in the Supplementary Online Material.
(5) Outcome indices did not conflate PE with non-PE phenotypes, such as affective or dissociative phenotypes, or with sleep-related PE.
(6) Participants were not recruited through secondary or tertiary health services, prisons or aged-care facilities.
(7) Psychosis in late life seems to have a somewhat different risk profile compared to psychosis earlier in the life course (Howard et al. Reference Howard, Rabins, Seeman and Jeste2000; Ropacki & Jeste, Reference Ropacki and Jeste2005; Köhler et al. Reference Köhler, van Os, de Graaf, Vollebergh, Verhey and Krabbendam2007) and may also have different persistence outcomes in the context of late-life neurological conditions such as Alzheimer's disease (Ropacki & Jeste, Reference Ropacki and Jeste2005). Therefore, a simple age-related inclusion criterion was applied. To strike a balance between excluding too many studies by use of an overly conservative criterion (e.g. no participants aged >65 years), we applied the more liberal criterion that at least 80% of the sample was <65 years.
We searched among citations in papers meeting these criteria. We included papers provided directly by authors (although there was no systematic enquiry of authors) and pre-prints of in-press publications that came to our attention.
Measures
For each observed rate, we recorded the name and attributes of the research cohort (sampling population, whether the sampling population was a whole nation, recruitment method, response rate, age, proportion of males, proportion 65 years or older, important inclusion and exclusion criteria), assessment (construct, instrument names, assessment mode, number of items, reference time-frame, endorsement thresholds and exclusion criteria including graded thresholds of severity or frequency, the ratio of hallucination to delusion items) and data handling (weighting correcting for sampling design, mean rate versus any endorsement, the denominator). Occasionally, different reports on the same cohort using the same or very similar methods contained different observed rates. In such cases, all rates were recorded.
For each cohort we determined the degree of geographic dispersal and population density of the sampling population using two sources (accessed February 2011): www.wikipedia.org (Wikimedia Foundation, USA) and www.fallingrain.com (Falling Rain Genomics Inc., USA). If the sampling population was a single city, dispersal was recorded as zero and density was that of the city. Otherwise, dispersal was the standard deviation (s.d.) of coordinates for multiple city studies or the s.d. of the geographical centre and most populous city for whole country studies; and density was the minimum estimated density for the sampling population.
Analyses
Saha et al.'s (Reference Saha, Chant and McGrath2008) graphical analysis was used to summarize rate data. This approach captures the variability in observed rates and allows inclusion of all rates in the results. However, a disadvantage of this approach is that if a method characteristic predicts both observed rates and the number of rates reported for each cohort, including all rates from a cohort could alter the observed variability. Therefore, we also used Monte Carlo permutation sampling (MCPS) to find what would have been observed had only one rate per cohort been reported. Specifically, in each of 10 000 permutations (5000 in the case of incidence rates), one rate was randomly selected for each multi-rate cohort and combined with rates from single-rate cohorts. The median rate×cumulative relative frequency curve and the observed 95% margins were then obtained. Observed margins were loess smoothed in R (R Development Core Team, 2004). Statistics obtained using MCPS have an MC subscript.
Associations between risk factors and rates were estimated in two ways. First, odds ratios (ORs) and relative risk (RR) for univariate exposures, and associated confidence intervals (CIs), were recorded or derived from counts or rates. If there were multiple ratios for the same exposure (e.g. male versus female for definite and probable PE; or urban versus rural and urban versus semi-rural), all were recorded. Ratios for exposure interactions (e.g. sex by age) were not recorded. Then, weighted meta-analytic estimates of ORs were obtained using metan in Stata v. 10.1 (Stata Corporation, USA). Where multiple ORs were available, the most adjusted estimate was used. If multiple ORs corresponded to different conditions for the same exposure variable, the median OR was obtained by taking the inverse log of the median of the log-transformed rates. RR was used as a substitute for OR if the latter was not available, the reported rate was <10% and substitution did not significantly alter the outcome.
Second, we estimated between-cohort associations of prevalence with exposures and method variables using MCPS (10 000 permutations, one rate per cohort). Point-biserial r was calculated for dichotomous variables, Pearson's r for arcsine-transformed proportions and Spearman's ρ for other data types. Population density was log transformed before analysis. Mean coefficients, exact 95% margins and the proportion of coefficients falling away from zero were obtained.
Results
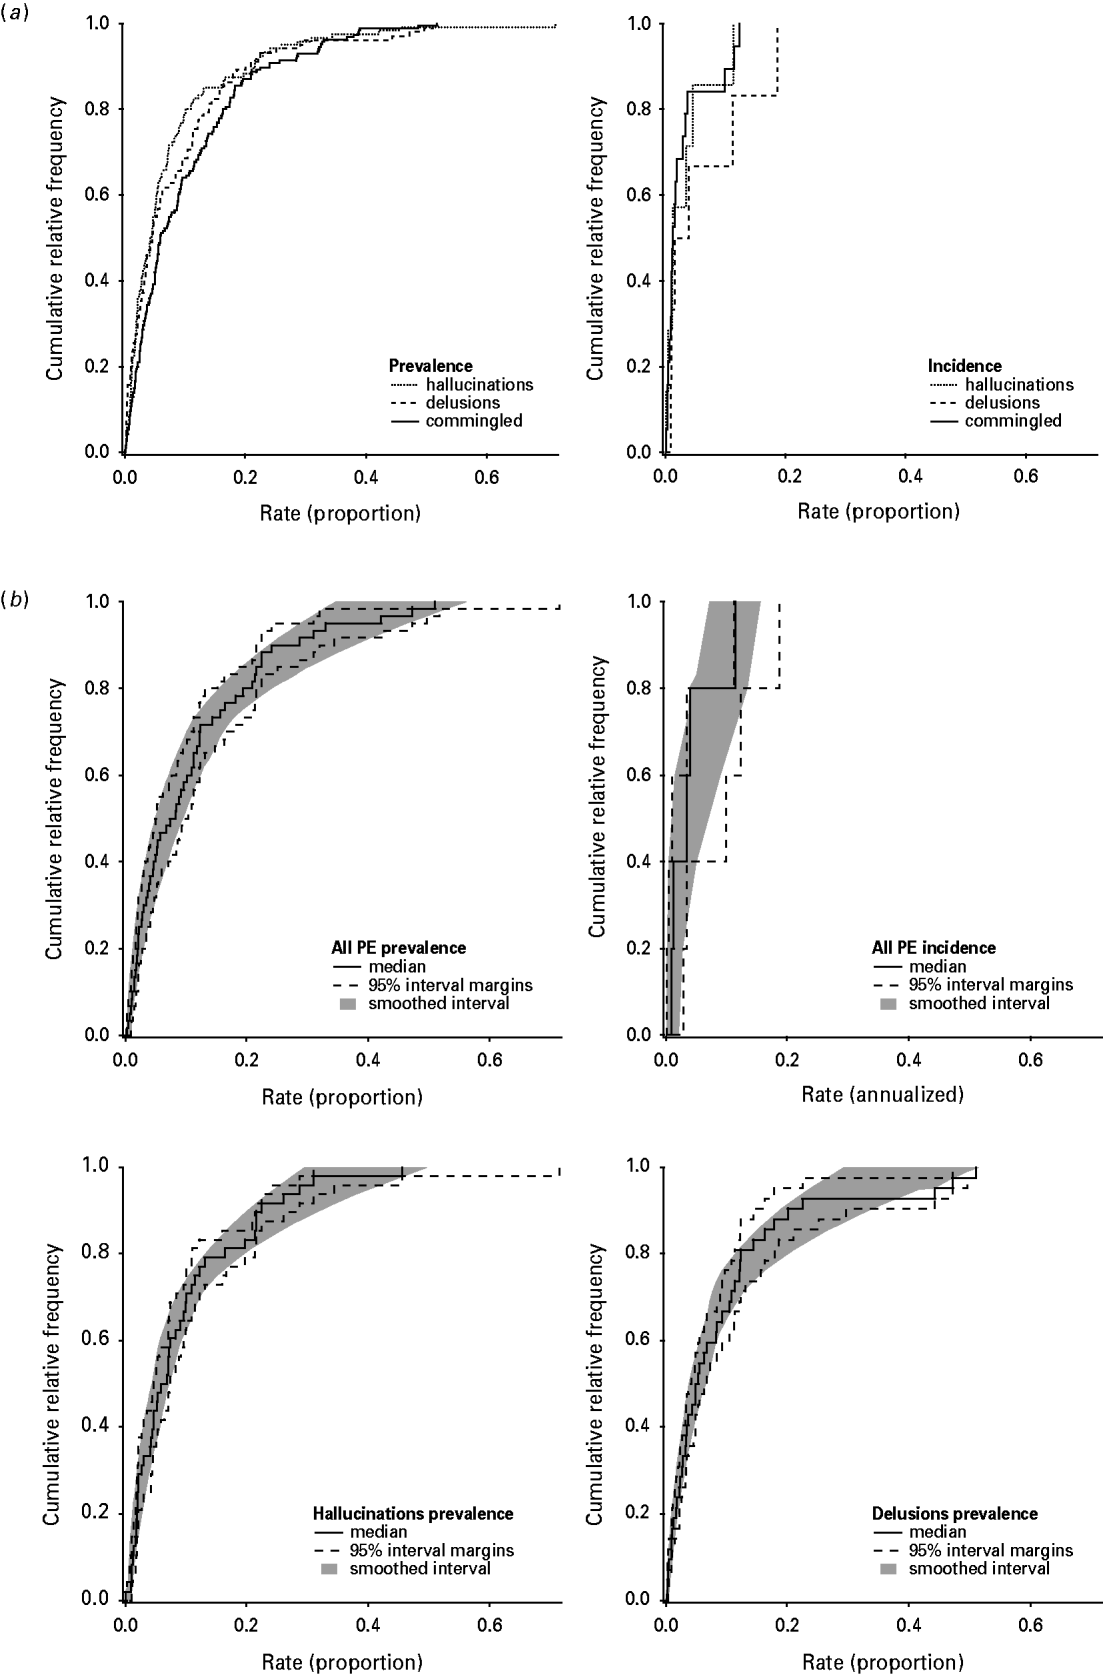
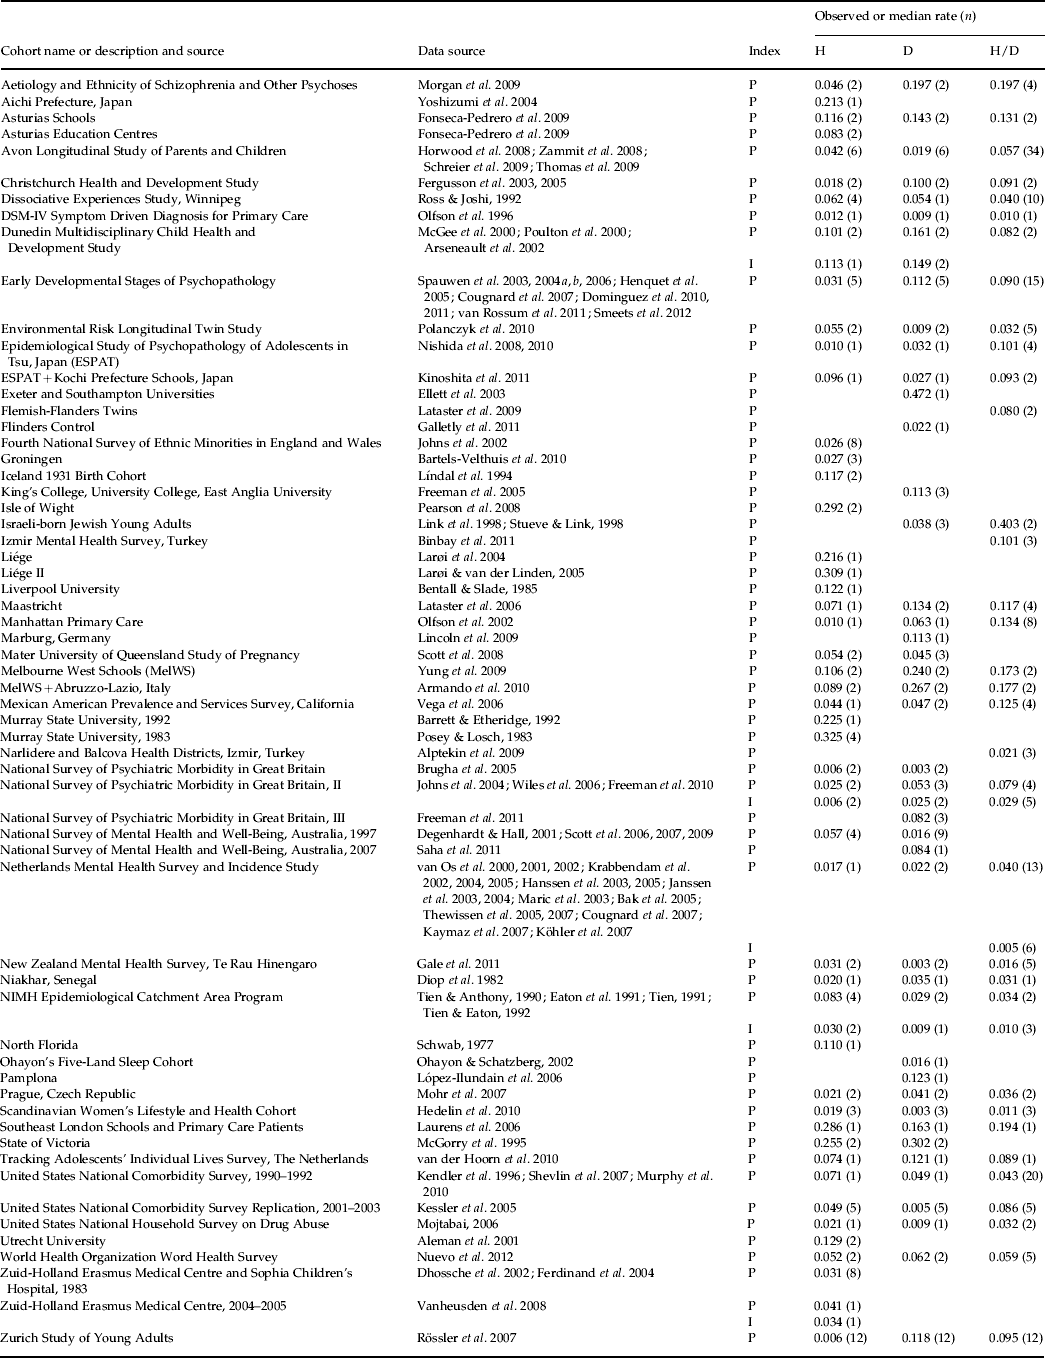
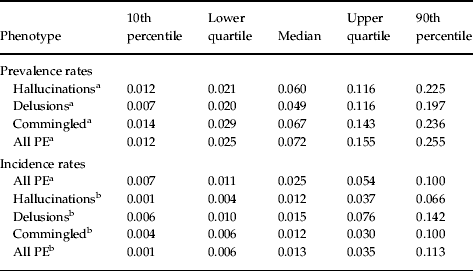
Reports that met the inclusion and exclusion criteria (n=95) contained 411 prevalence and 35 incidence rates from 61 participant cohorts (Table 1). The median numbers of rates per report and per cohort were 3 and 4 respectively, and the maximum, 38 and 46 respectively. Fifty per cent of rates came from nine (15%) cohorts. Incidence data were available for six cohorts only. Reported prevalence rates ranged from 0 to 0.715 (Fig. 1). Annual incidence rates ranged from 0.001 to 0.187. Table 2 gives percentiles and quartiles of reported rates.
Cumulative relative frequency plots. (a) Plots for all reported prevalence and annual incidence rates for hallucinations (n=121, n=8), delusions (n=103, n=7) and commingled hallucinations or delusions (n=187, n=20). (b) Plots obtained with Monte Carlo permutation sampling (MCPS) of rates, for the prevalence of all psychotic experiences (PE) (i.e. hallucinations, delusions and commingled hallucinations or delusions; n=61 cohorts), the incidence of all PE (n=6 cohorts), and the prevalence of hallucinations (n=49 cohorts) and delusions only (n=43 cohorts).

Cohorts and data sources identified and included in the review
D, Delusion; H, hallucination; H/D, undifferentiated; I, (annual) incidence; P, prevalence.
Prevalence and annual incidence percentiles and quartiles
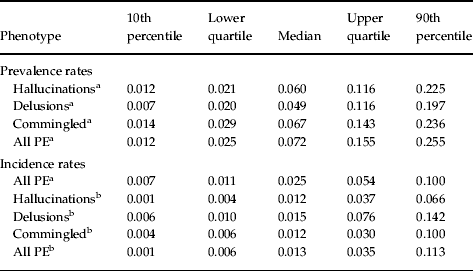
PE, Psychotic experiences.
a Derived from Monte Carlo permutation sampling (MCPS).
b Derived using all observed rates.
Is PE more prevalent than psychotic disorder?
The most robust estimate of the prevalence of psychotic disorder in the general population comes from a comprehensive national interview survey of Finland in 2000 (Perälä et al. Reference Perälä, Suvisaari, Saarni, Kuoppasalmi, Isometsä, Pirkola, Partonen, Tuulio-Henriksson, Hintikka, Kieseppä, Härkänen, Koskinen and Lönnqvist2007). In this survey, the lifetime prevalence in the consenting general population aged >29 years was reported to be 0.0299. This rate included all non-affective psychoses, affective psychoses with psychotic features, substance-induced psychoses, and psychoses due to a general medical condition.
In comparison, the median lifetime prevalence of interview-assessed PE (MdnMC) was 0.0534 (n=17 cohorts); the observed proportion of medians below 0.0299 was p=0.043. Four of the 17 cohorts in this subset were of children or adolescents. For the remaining 13 cohorts, most of which had age ranges spanning from the late teens through to beyond 55 years, MdnMC was 0.0526 (p=0.050). Widening the range of cohorts to include both interview and self-report rates, regardless of age, gave an MdnMC of 0.0873 (p<0.001, n=30 cohorts).
What method variables account for variance in observed prevalence rates?
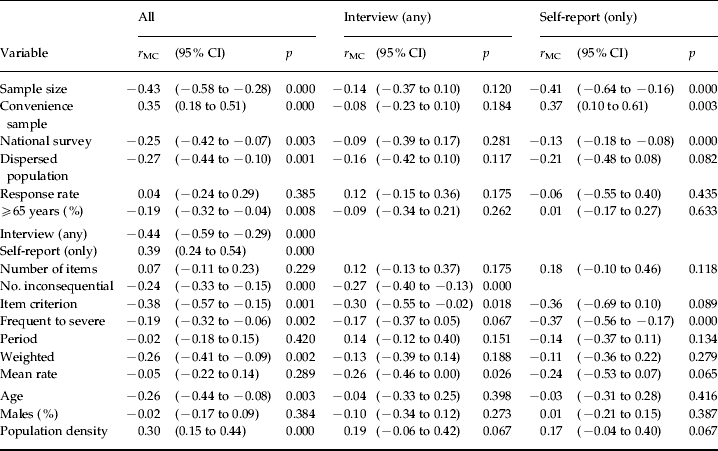
Table 3 shows correlations between method variables and prevalence rates. Rates were lower where PE were assessed with interviews, samples were larger, the sampling population was a whole nation or was dispersed, inconsequential PE were not counted, or there were higher grading or item endorsement thresholds. Higher rates were reported from convenience samples and self-report studies.
Associations between cohort variables and observed rates obtained with interview, self-report, or all methods
CI, Confidence interval; r MC, correlation coefficient derived using Monte Carlo permutation sampling (MCPS).
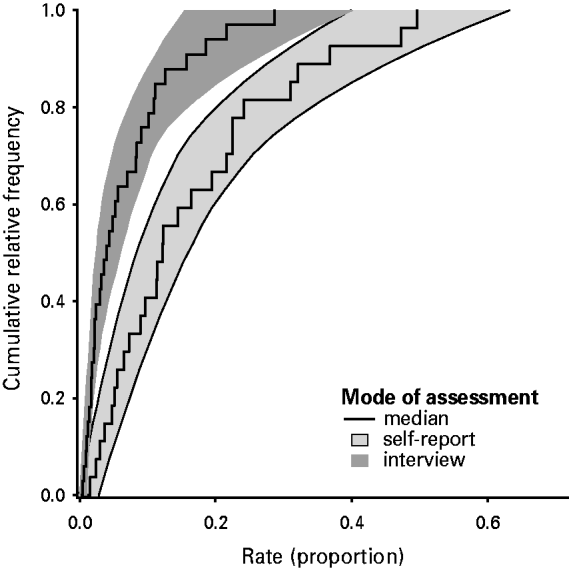
Of all the method variables, the distinction between interview and no-interview methodologies accounted for the greatest proportion of observed variance in rates, 19.7%. When separated into interview (i.e. researchers used interview with or without other assessment methods) and self-report (i.e. researchers used self-report methods only) subsamples, the median estimates of prevalence of PE were 0.038 and 0.119 respectively. Moreover, the distributions of observed rates were almost entirely non-overlapping (Fig. 2). When separate MCPS analyses were conducted for interview and self-report studies, different relationships with method variables emerged (Table 3).
Cumulative relative frequencies of prevalence rates for psychotic experiences (PE) measured with self-report questionnaires (n=28 cohorts) or lay or professional interviews (n=34 cohorts). Frequency distributions were obtained using Monte Carlo permutation sampling (MCPS). Shaded regions are loess-smoothed intervals within which 95% of observations fell. In these confidence intervals (CIs), non-overlapping areas comprised 97.7% to 99.4% of the total CI area (smoothed or unsmoothed).
What is the nature of the relationship between PE and risk factors?
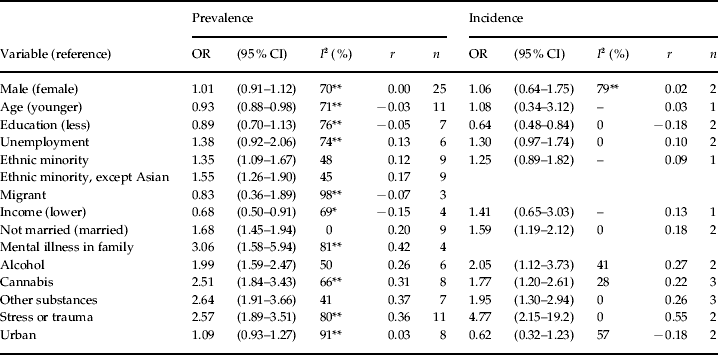
PE was more common among younger individuals, members of ethnic minorities, the lower paid, and the unmarried (Table 4). PE occurred in association with misuse (or the degree of misuse) of alcohol, cannabis and other recreational drugs, and with exposure to stressful or traumatic events. Family history of mental illness was among the most potent of risk factors. By contrast, and somewhat unexpectedly, there was no evidence that education, unemployment or urbanicity predicted PE.
Meta-analytic estimates of odds of PE given exposure variable
PE, Psychotic experiences; OR, odds ratio; CI, confidence interval; I 2, percentage of variance in OR estimates reflecting inconsistency across studies (Higgins et al. Reference Higgins, Thompson, Deeks and Altman2003); r, Pearson's tetrachoric approximation (Bonett, Reference Bonett2007).
* p<0.05
** p<0.01.
However, heterogeneity (I 2) affected many of these analyses (Table 4). Notably, ORs for education and unemployment from the third National Survey of Psychiatric Morbidity in Great Britain (NSPMGB-III; Freeman et al. Reference Freeman, McManus, Brugha, Meltzer, Jenkins and Bebbington2011) were inconsistent with ORs from other cohorts. When these were removed, the meta-analytic ORs for education (reference=less) and unemployment were 0.77 (95% CI 0.67–0.89) and 1.56 (95% CI 1.27–1.91) respectively, and the heterogeneity decreased (I 2=0% and 18% respectively). I 2 for urbanicity decreased from 91% to 0% when reanalysed without the NSPMGB-III and Groningen cohorts (Bartels-Velthuis et al. Reference Bartels-Velthuis, Jenner, van de Willige, van Os and Wiersma2010), giving an OR of 1.24 (95% CI 1.16–1.32). I 2 for cannabis decreased to 18% without data from the Izmir cohort (Binbay et al. Reference Binbay, Drukker, Elbi, Tanık, Özkınay, Onay, Zağlı, van Os and Alptekin2011), which yielded unusually high odds. I 2 for migrant status decreased from 98% to 0% with the removal of the Mexican American cohort (Vega et al. Reference Vega, Sribney, Miskimen, Escobar and Aguilar-Gaxiola2006), giving an OR of 1.20 (95% CI 1.02–1.40). I 2 for family history decreased to 8% without a very high OR from the Narlidere–Balcova cohort (Alptekin et al. Reference Alptekin, Ulas, Akdede, Tümüklü and Akvardar2009), leaving an OR of 2.39 (95% CI 1.85–3.07). Heterogeneity affecting estimates for age and stress or trauma was not attributable to any single cohort.
MCPS showed that lower cohort age and higher cohort population density were strongly correlated with higher cohort prevalence rates (Table 3). However, when performed separately for interview and self-report rates, age was not related to prevalence. The association with urbanicity seemed to survive despite the mode of assessment, although the evidence was marginal (p=0.067).
What is the rate of psychotic disorder outcome associated with PE?
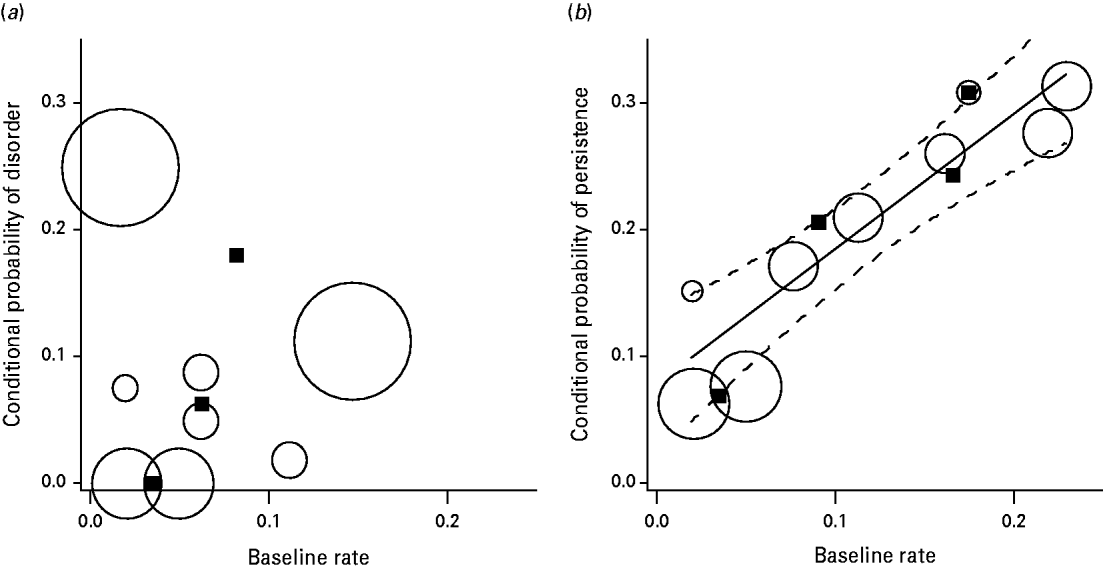
Authors' definitions of psychotic disorder outcomes were accepted at face value. Eight estimates of the prevalence of psychotic disorder outcomes were obtained from five reports on analysis of three cohorts: none in the Zuid-Holland cohort (Dhossche et al. Reference Dhossche, Ferdinand, van der Ende, Hofstra and Verhulst2002) developed a psychotic disorder during an 8-year interval (n=2 rates). The prevalence of disorder outcomes for the cohort from the Dunedin Multidisciplinary Health and Development Study (DMHDS; Poulton et al. Reference Poulton, Caspi, Moffitt, Cannon, Murray and Harrington2000) was 0.033 over 15 years (n=2). The Netherlands Mental Health Survey and Incidence Study (NEMESIS; Krabbendam et al. Reference Krabbendam, Myin-Germeys, Hanssen, Bijl, de Graaf, Vollebergh, Bak and van Os2004, Reference Krabbendam, Myin-Germeys, Hanssen, de Graaf, Vollebergh, Bak and van Os2005; Hanssen et al. Reference Hanssen, Bak, Bijl, Vollebergh and van Os2005) generated estimates from 0.003 over 2 years to 0.008 over 3 years, with a median rate of 0.005 (n=4). The conditional probabilities of psychotic disorder given baseline PE ranged from 0.000 to 0.250 (n=8), with a mean value of 0.074 (Fig. 3). Given the small n, caution is warranted when interpreting the evidence that follows.
The conditional probabilities of (a) psychotic disorder outcome and (b) persistence of psychotic experiences (PE) given baseline PE. Circles indicate any observation; squares, median observation per cohort. Plot symbol size is proportional to latency between baseline and follow-up (range 1–15 years); lines indicate least-squares regression line (solid) and its 95% confidence interval (CI) (dashed).
There was no evidence that disorder outcomes were associated with baseline prevalence of PE, with r=0.34 for all observations (p=0.41, df=6) and r=0.90 for medians per cohort (p=0.290, df=1). Furthermore, conditional probabilities were not correlated with baseline PE, with r=−0.13 for all observations (p=0.757, df=6) and r=0.97 for medians per cohort (p=0.161, df=1). Visual inspection of the relationship (Fig. 3) suggests that, within cohorts, narrower definitions of PE give higher conditional probabilities.
What proportion experience persistent PE?
Persistence was defined as the proportion of people who, having met some threshold for PE during a baseline assessment, met the same threshold for PE at some later point in time. Nine estimates of persistence were obtained from six reports based on four cohorts and intervals spanning 1–8 years (Dhossche et al. Reference Dhossche, Ferdinand, van der Ende, Hofstra and Verhulst2002; Hanssen et al. Reference Hanssen, Bak, Bijl, Vollebergh and van Os2005; Wiles et al. Reference Wiles, Zammit, Bebbington, Singleton, Meltzer and Lewis2006; Cougnard et al. Reference Cougnard, Marcelis, Myin-Germeys, de Graaf, Vollebergh, Krabbendam, Lieb, Wittchen, Henquet, Spauwen and van Os2007; Dominguez et al. Reference Dominguez, Wichers, Lieb, Wittchen and van Os2011; van Rossum et al. Reference van Rossum, Dominguez, Lieb, Wittchen and van Os2011). The prevalence of persistent PE ranged from 0.001 to 0.072, with median rates of 0.024 (n=9 rates) and 0.032 (n=4 cohorts). The comparable median estimates of incident PE from the same cohorts for the same periods were 0.035 (n=9 rates) and 0.035 (n=4 cohorts). Conditional probabilities of persistence given baseline PE ranged from 0.063 to 0.315 (median=0.211; Fig. 3). The small n indicates caution is again warranted.
Rates of persistent PE were correlated with baseline PE, with r=0.99 for all observations (p<0.001, df=7) and r=0.99 for medians per cohort (p=0.013, df=2). The conditional probability of persistence was correlated with baseline PE, with r=0.92 for all observations (p<0.001, df=7) but r=0.95 for medians per cohort (p=0.054, df=2). The latter suggest that, given any particular cohort, the conditional probability of persistence will be approximately 145% of baseline prevalence (e.g. if baseline prevalence=0.07, persistent PE occurs in ∼10% of those with baseline PE).
Persistence was not predicted by the latency between baseline and follow-up or cohort age. Predictors of persistence identified by others included higher levels of affective disturbance (van Rossum et al. Reference van Rossum, Dominguez, Lieb, Wittchen and van Os2011) and exposure to environmental stressors, including cannabis, stress and urbanicity (Cougnard et al. Reference Cougnard, Marcelis, Myin-Germeys, de Graaf, Vollebergh, Krabbendam, Lieb, Wittchen, Henquet, Spauwen and van Os2007).
Discussion
Among the numerous studies of PE in general population samples, the median estimated prevalence of PE is 7.2% and the annual incidence is 2.5%. The rate of PE is significantly greater than the comparable rate of psychotic disorder (Perälä et al. Reference Perälä, Suvisaari, Saarni, Kuoppasalmi, Isometsä, Pirkola, Partonen, Tuulio-Henriksson, Hintikka, Kieseppä, Härkänen, Koskinen and Lönnqvist2007). Crucially, PE seemed to behave a lot like psychotic disorder. The risk of PE was greater among younger individuals, ethnic minority and migrant groups, the lower paid, the less educated, the unemployed, and those who were not married. Exposure to alcohol, cannabis, other recreational drugs, stressful or traumatic events, greater urbanicity and family history of mental illness predicted greater risk of PE. Urbanicity accounted for significant between-cohort variation in PE. Method variables also contributed significantly to the variability in observed rates, particularly mode of assessment. Studies based on self-report generated rates more than three times greater (in absolute terms, 0.081 higher) than rates obtained from interview-based assessments.
PE were transient for nearly 80% of affected individuals and persisted in only a minority of cases. Of those with baseline PE, 7.4% developed a psychotic disorder outcome. Contrary to expectation, there was no evidence that disorder outcome was constantly related to baseline PE across samples. Explanations for our failure to find evidence may include the very limited statistical power of the analyses and, as suggested by one reviewer, differences in methods of classification of disorder across studies and geographical regions. By contrast, the conditional probability of persistence was constantly related to the rate of PE within the population.
In sum, the findings provide good support for the phenomenological and temporal continuity of PE. PE behave like psychotic disorders, and schizophrenia in particular, PE persist over time, and persistence seems to have a probabilistic and constant relationship with baseline PE. Thus, key propositions of the psychosis-proneness–persistence–impairment model seem sound. However, the evidence also contains significant limitations that constrain confidence in this interpretation.
First, in prospective epidemiological research, persistence is operationalized imprecisely. Imprecision is a function of both the length of follow-up intervals and the design of assessment instruments. Consequently, those who experience continuous PE during baseline and follow-up intervals, those who experience significant periods of remission during the follow-up interval, and those who have PE at baseline and then experience full remission of PE for the remainder of the follow-up interval are all classed as experiencing persistent PE.
Second, the rates of persistent and incident PE over an interval were markedly similar (MdnMC=0.032 and 0.035 respectively). This may indicate that there are fundamentally different course profiles of PE experience. Indeed, the length of the follow-up interval was not significantly associated with either persistent or new-onset PE (r=−0.30 and r=−0.13 respectively). However, it is unclear from the available research to what degree rates of persistent and new-onset PE are a product of research design. Several design variables may contribute: the a priori definition of, or threshold for, persistence; item wording that imposes a duration or frequency criterion on PE (e.g. ever versus sometimes); and the length of the follow-up interval. Importantly, the absence of a significant correlation between persistence interval and rate of persistence does not constitute evidence that these are unrelated as the power of the test was only 0.09.
Other limitations include the fact that, unlike self-report data, interview data were not limited to those reflecting specific, happened, personally relevant events, etc. Persistence and disorder outcome results rest on very small samples of cohorts, and the reliability of extraction of rates and odds from articles was not examined.
Given these limits, the evidence and tests reported here are not sufficient bases for rejecting competing discontinuity models. For the same reasons, it is important to consider what would be required to reject a continuity model or at least to provide a more rigorous test of it. Defensible definitions of persistence are required, along with clarification of what constitutes remission and recurrence of PE. If a high threshold definition is used (e.g. continuously experienced, vis-à-vis continually, intermittently), persistence may be found to be exceedingly rare. Integration of survey with other research designs is also crucial. Whereas surveys can detect intermittent persistence, continuous or continual PE would be better examined in experience sampling designs. Phenomenological continuity would be discounted if the causal mechanism of PE in one group of individuals differed from that giving rise to PE in another. The groups may align conveniently with the threshold for psychotic disorder, although, given the way such thresholds are determined, that seems unlikely. Equally, clear epidemiological evidence on the proximal causal mechanism in the general population would strengthen support for continuity.
It is important to justify our reliance on, and integration of, self-report and interview data in this review. There are several reasons why we did not restrict the review to just one assessment methodology, such as interview-based assessment. First, self-report and clinical interviews each introduce different types of systematic variance into the assessment of psychotic experiences. For example, there is some evidence that interview methodologies are less sensitive to heritability variance than self-report methodologies (Kendler et al. Reference Kendler, Myers, Torgersen, Neale and Reichborn-Kjennerud2007). This may be in part because of the role that observer-interviewers have on filtering information from respondents (Linscott & van Os, Reference Linscott and van Os2010). However, response biases may affect self-report. By including both forms of assessment in the review, it has been possible to capture and describe that variance and to obtain findings that may be generalized beyond the one methodology. Second, it is not clear which assessment method is better. Interview-based assessments are not any more valid or reliable than self-report assessments. The lower rate of PE in general population samples obtained from interview-based measures does not mean that the interview rate is more accurate. Self-report instruments have been shown to accurately predict interview-ascertained PE (Kelleher et al. Reference Kelleher, Harley, Murtagh and Cannon2011). Third, many of the interview-based rates were obtained from lay-trained research assistants using the CIDI or similar diagnostic interviews. The CIDI functions much like a self-report instrument would if item content were delivered orally and responses were audio recorded. In other words, the interview–self-report dichotomy is not necessarily sound. Finally, research evidence suggests that self-reported PE, even when not verified by clinical interview, are predictive of psychosis and other clinical outcomes (van Nierop et al. 2011; Kaymaz et al. Reference Kaymaz, Drukker, Lieb, Wittchen, Werbeloff, Weiser, Lataster and van Os2012).
Continuity between PE and psychotic disorder has several clinical implications (cf. Lawrie et al. Reference Lawrie, Hall, McIntosh, Owens and Johnstone2010). Evidence of continuity should not imply that categorical diagnosis or systems should be abandoned. Nevertheless, for many, the experience of psychosis is not associated with disability or need for care. Greater understanding of the nexus between PE and dysfunction, and careful maintenance of distinction between these, is warranted and may aid identification of alternative intervention targets. Intervention targets may also emerge from a better understanding of what it is that protects some from developing dysfunction despite PE.
In communication with patients, a shift in emphasis from disorder class towards symptomatology and dysfunction would be consistent with the continuity theory and have several clinical benefits. The tautology inherent in diagnosis of psychotic disorders, which arises from the descriptive vis-à-vis explanatory nature of psychiatric diagnosis, would be avoided while still providing patients the reassurance they derive from knowing what is going on. Emphasis on symptomatology would reduced the risk of stigmatization and facilitate the identification of proximal antecedents of distress, thereby providing a more salient, amenable target for monitoring and intervention.
Supplementary material
For supplementary material accompanying this paper visit http://dx.doi.org/10.1017/S0033291712001626.
Declaration of Interest
None.