1. INTRODUCTION
The wind power generation industry is growing quickly and is becoming an economical sustainable energy source. Compared to land turbine installations, offshore wind farms benefit from stronger and more uniform wind profiles (Uzunoglu et al., Reference Uzunoglu, Karmakar, Guedes Soares, Castro-Santos and Diaz-Casas2016; Zhang et al., Reference Zhang, Zhang, Cai and Ma2017), which has motivated the development of many offshore wind farm projects as the technology improves and the investment and operational costs decrease (Papadopoulos et al., Reference Papadopoulos, Glinou and Papachristos2008).
Commercial use of Offshore Wind Farms (OWFs) has become common in many countries as an important element of energy generation strategies. For example, wind energy is the key alternative resource in Portugal, contributing to 22% of the total electricity consumption (Campos and Guedes Soares, Reference Campos and Guedes Soares2018), and a full-scale offshore floating wind turbine prototype (WindFloat) has been constructed and tested since 2011 (Roddier et al., Reference Roddier, Cermelli, Aubault and Weinstein2010). In China the first OWF was built near the Donghai Bridge in 2005, and the total capacity of offshore wind in China reached 2·79 GW in 2017 (Nie and Li, Reference Nie and Li2018).
Newly built OWFs have some potential impacts to wildlife, the natural environment and navigational safety (Rein et al., Reference Rein, Lundin, Wilson and Kimbrell2013, Kim et al., Reference Kim, Jang and Kim2018). Several studies have emerged over recent years covering many aspects, such as, OWF site selection (Ho et al., Reference Ho, Lie, Leong and Clear2018; Noorollahi et al., Reference Noorollahi, Yousefi and Mohammadi2016); OWF operation and maintenance (Florian and Sørensen, Reference Florian and Sørensen2017; Martin et al., Reference Martin, Lazakis, Barbouchi and Johanning2016; Santos et al., Reference Santos, Teixeira and Guedes Soares2018); wildlife impact (Hooper et al., Reference Hooper, Hattam and Austen2017; Höfer et al., Reference Höfer, Sunak, Siddique and Madlener2016); among others.
The impact on the collision risk of passing ships with the turbines is a major issue among the navigational effects of OWFs (Petersen, Reference Petersen, Guedes Soares and Santos2015; Yu, et al., Reference Yu, Liu, Zhang, Xin, Guedes Soares and Santos2018). Past research works show some focus on collision consequence analysis for wind turbines and ship structures (Bela et al., Reference Bela, Le Sourne, Buldgen and Rigo2017; Presencia and Shafiee, Reference Presencia and Shafiee2018; Dai et al., Reference Dai, Ehlers, Rausand and Utne2013). Others have covered modelling of allision mechanisms. Hassel et al. (Reference Hassel, Utne and Vinnem2017) performed an extensive analysis that evaluated the changes in the ship traffic flow before and after the installation of an oil platform on the Norwegian Continental Shelf. Several studies have used Automatic Identification System (AIS) data to assess the impacts of OWFs on vessel traffic in the Thames Estuary, Penghu waterway and South coast of Busan (Rawson and Rogers, Reference Rawson and Rogers2015; Chang et al., Reference Chang, Tseng and Chang2014; Mujeeb-Ahmed et al., Reference Mujeeb-Ahmed, Seo and Paik2018). Copping et al. (Reference Copping, Breithaupt, Whiting, Grear, Tagestad and Shelton2016) compared the likelihood of commercial vessel accidents on existing shipping routes, obtained from historical AIS data, and on future routes in the presence of wind farms along the United States (US) Atlantic coast, derived from a numerical simulation model. Despite the large uncertainty in the estimates, the results obtained do not show a statistically significant increase in the mean frequency of collisions for wind farm scenarios.
In these studies, some combinations of ship traffic flows before and after the OWF installation were used. These studies have also shown the advantages of using AIS data to study ship behaviour near the offshore installations. However, they lack a conceptual framework and the results obtained are general, the impacts of different vessel types are typically not discussed, and these need further study.
In this context, this study aims to provide a more precise data-driven framework for assessing the OWF influence on maritime traffic, extending the current knowledge of OWF impacts on ship traffic flow. The proposed framework includes models for data acquisition, data filtering and statistical analysis that quantitatively characterise the influence of offshore wind farms on the traffic flow of ships based on AIS data collected before and after the installation of the offshore wind turbines. Strategies for AIS data acquisition and filtering are defined with the objective of assessing the Minimum Passing Distance (MPD) and other dynamic historical information of each passing ship in a monitoring area around the OWF. The effect of the OWF is probabilistically characterised in terms of lateral distributions of the trajectories and velocities of the ships near the OWF. In addition, the influence of the ship categories on the traffic flow and the MPD is analysed.
For illustrating the framework, an OWF located on the northwest coast of the Taiwan Channel for which historical AIS data before and after the OWF installation is available has been selected as a case study area.
The contributions of the study are as follows. First, a raw AIS data processing model is proposed to process the raw AIS data and to collect the required parameter data. Second, a statistical analysis is conducted on a case study region in China and the results show many aspects of maritime traffic changes after the OWF installation.
This paper is organised in five main sections. Section 2 presents the proposed framework for assessing the influence of OWFs on maritime traffic and its main elements. Section 3 provides detailed information about the case study, such as, the study area and the data available. Section 4 presents the results of the statistical analysis and provides a detailed discussion on the impact of the OWF on ship navigation and traffic flow. Finally, conclusions are drawn, and future research directions are described in Section 5.
2. FRAMEWORK
AIS provides considerable amounts of data for ship traffic flow analysis. Historical AIS data has been used to study the characteristics of the maritime traffic (Silveira et al., Reference Silveira, Teixeira and Guedes Soares2013; Breithaupt et al., Reference Breithaupt, Copping, Tagestad and Whiting2017), the operational behaviour of ships (Zhang et al., Reference Zhang, Shi, Liu, Zhao and Wu2018), for detecting the possibility of ship collisions or near-misses (Zhang et al., Reference Zhang, Goerlandt, Montewka and Kujala2015; Wang et al., Reference Wang, Zhang, Chen, Chu and Yan2013; Rong et al., Reference Rong, Teixeira and Guedes Soares2015), to study ship traffic flow in narrow waterways (Altan and Otay Reference Altan and Otay2017; Wu et al., Reference Wu, Rahman and Zaloom2018) and in port areas (Rong et al., Reference Rong, Teixeira and Guedes Soares2015). AIS data can also be used to evaluate the impacts of OWF installations on maritime traffic flow. An AIS data-driven framework for assessing the influence of an OWF installation on the nearby maritime traffic is proposed in this paper. The framework includes modules for data acquisition, data filtering and statistical analysis with the objective of probabilistically characterising the OWF influence on the nearby traffic flow. The proposed framework is presented in Figure 1. First, some relevant parameters related to the data set and the OWF boundary are defined. Second, an AIS filtering model is introduced and a MPD algorithm is presented. Third, a statistical model is proposed to evaluate OWF impacts on ship traffic flow from different points of view. Details of the framework are introduced in the following sections.
Framework for assessing the influence of OWFs on the maritime traffic.

2.1. Data acquisition and parameter definition
Operational OWF Safety Zones (SZs) are typically defined to safeguard the safety of the OWFs and of passing maritime traffic. The SZ is an area around the offshore wind farm corresponding to the minimum clearance distance of the wind farm boundaries from shipping routes. OWF SZs have been suggested in the literature and by several guidelines and regulations. For instance, under the United Kingdom's legislation, the OWF reserved area has been defined as 500 metres (m) during construction. The UK Maritime and Coastguard Agency (MCA, 2016) suggests that a distance between the OWF boundary and shipping routes less than 0.5 nautical miles (nm) is intolerable. Some studies have provided some recommendations on SZ selection based on expert judgements or experience. Rawson and Rogers (Reference Rawson and Rogers2015) suggest that the passing distance of ships should not be less than 1,000 m to reduce the risk of collisions. Ultimately, SZs are assessed on a case by case basis using a risk-based approach, taking into account maritime traffic and site-specific conditions so that the collision and contact risks are “As Low As Reasonably Practicable” (ALARP) (MCA, 2016).
In this paper a 0·5 nm SZ has been adopted, corresponding to the ALARP lower bound distance proposed by the MCA (2016). Consequently, any passing ship with a minimum passing distance less than this distance is considered as a SZ crossing.
2.1.1. Monitoring zone
The Monitoring Zone (MZ) is defined to identify candidate objects around the OWF from the AIS data. Mujeeb-Ahmed et al. (Reference Mujeeb-Ahmed, Seo and Paik2018) adopted a 10 nm exclusion zone to detect collision candidates near an offshore platform. A risk analysis of offshore petroleum installations conducted by Hassel et al. (Reference Hassel, Utne and Vinnem2017) limited a radius of 4 nm around the platform and discussed the traffic pattern changes within 2 nm. The UK MCA has suggested that the risk for a ship is broadly acceptable if the passing distance is larger than 3·5 nm. Distance between 0·5 to 3·5 nm is tolerable if appropriate risk controls are implemented (MCA, 2016). A large MZ will lead to many ship candidates, which increases the computational effort of the data filtering model. Therefore, a MZ distance of 4 nm is set in the model presented here.
2.2. Data filtering model
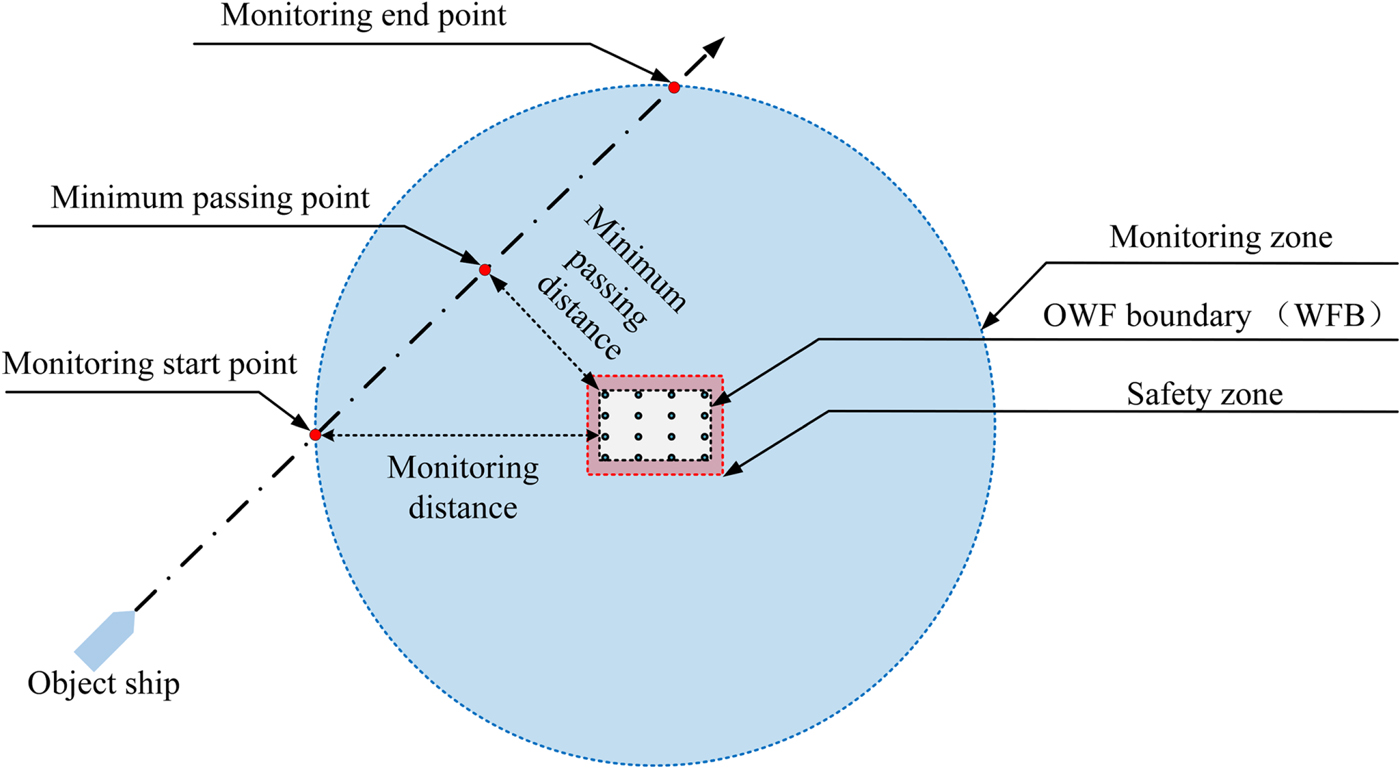
To analyse the traffic information around the OWF, an AIS filtering model is proposed that includes some elements such as the SZ of the OWF, the MZ, the ship MPD and the Minimum Passing Point (MPP).
2.2.1. Minimum Passing Distance Algorithm (MPDA)
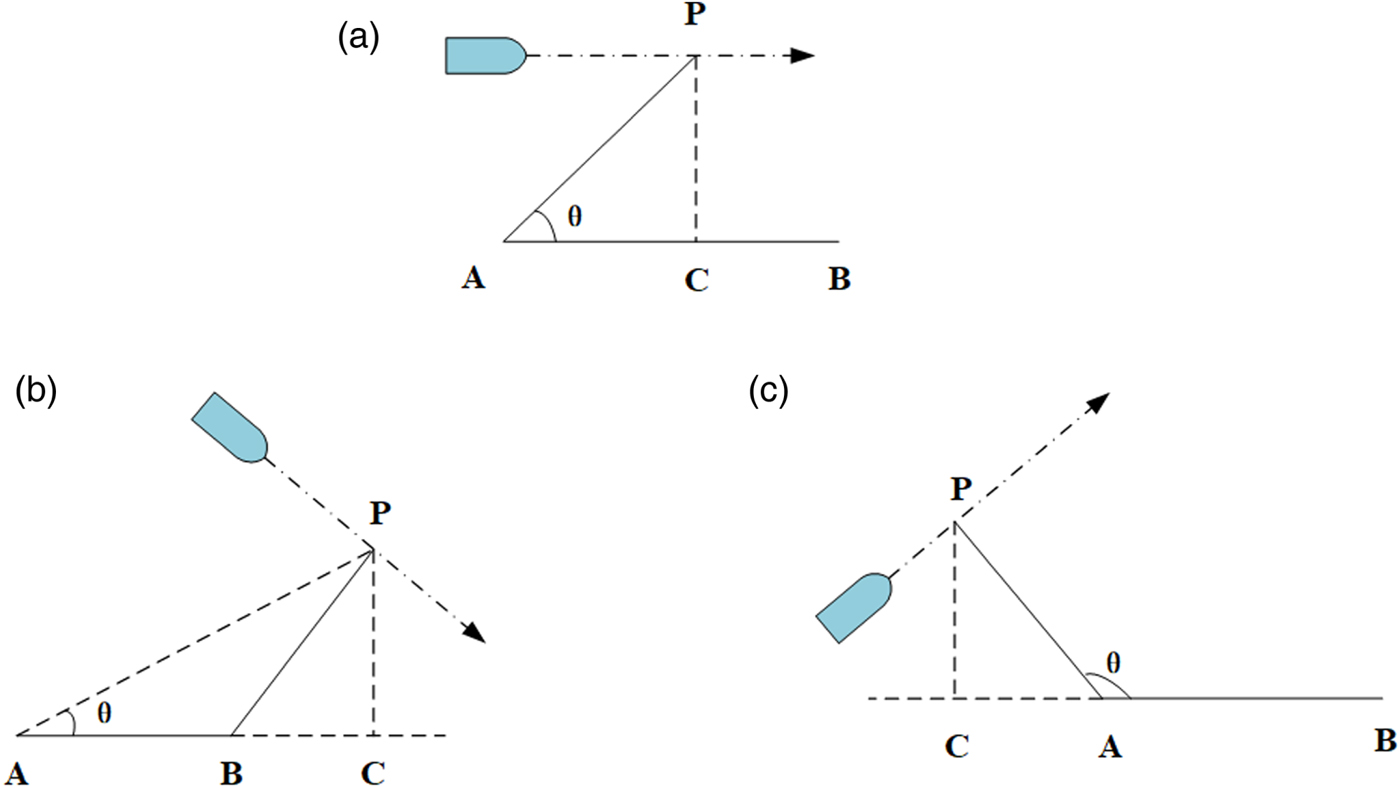
The concept of the passing distance is based on the idea that in order to ensure safety, each ship should keep a clear distance from OWFs to avoid collisions with the wind turbines, which is similar to the concept of “Distance to Closest Point of Approach” used in ship collision studies (for example, Silveira et al., Reference Silveira, Teixeira, Guedes Soares, Guedes Soares and Santos2015). The MPD has been used by Hassel et al. (Reference Hassel, Utne and Vinnem2017) to assess the collision risk to oil and gas platforms by considering the platform as a mass point when calculating minimum ship passing distances. An OWF cannot be considered as a mass point. The shape of the OWF is not a circle as there are many borders that define the OWF area. A Minimum Passing Distance Algorithm (MPDA) is proposed to calculate the MPD and MPP of each passing ship inside the monitoring zone. In the MPDA, there are three situations that should be considered, as shown in Figure 2, where A and B are two corner points along the OWF Boundary (WFB) (see Figure 3) and, therefore AB, is a segment of the WFB. The point P is the ship position and the point C is the projection of the point P on the line segment AB.
Passing distance and passing point under three situations.

Illustration of monitoring (MZ) and safety (SZ) zones used for assessing MPDs.

As shown in Figure 2, the ship can pass parallel to the WFB (Figure 2(a)) or on the right (Figure 2(c)) or left (Figure 2(b)) sides. For each condition, the MPD is represented by different line segments (CP, BP or AP). In the MPDA, the MPD is defined as follows:
 $$MPD = \left\{ {\matrix{ { \vert \vec {AP} \vert } \hfill & {f\;K < 0} \hfill \cr { \vert \vec {BP} \vert } \hfill & {f\;K \ge 0} \hfill \cr { \vert \vec {CP} \vert } \hfill & {otherwise} \hfill \cr } } \right.$$
where the parameter K is defined as the ratio between the vector  $\vec{{\rm AC}}$ and the vector
 $\vec{{\rm AB}}$. K with a value larger than one means that the ship passes the OWF on the right side and K less than zero means that the ship passes the OWF on the left side. For K between zero and one the ship passes “parallel” to the OWF. According to the rules of vector operations,
 $\vec{{\rm AC}}$ is calculated as:
 $$\vec {{\rm AC}} = \displaystyle{{(\vec {AP} \cdot \vec {AB} )} \over { \vert \vec {AB} \vert ^2}}\cdot \vec {AB}$$
and therefore the K parameter is given by:
 $$K = \displaystyle{{\vec {AC} } \over {\vec {AB} }} = \displaystyle{{(\vec {AP} \cdot \vec {AB} )} \over { \vert \vec {AB} \vert ^2}}$$
When applying the MPDA to real AIS data, after obtaining the location (Lat-Latitudeand Lon-Longitude) of each AIS record, the line segments  $\vec{AP}$,
 $\vec{BP}$ and
 $\vec{CP}$ for a ship n passing the WFB AB can be calculated as follows:
 $$\matrix{ { \vert \vec {AP} \vert } \hfill & { = \sqrt {{(Lon._n-Lon._A)}^2 + {(Lat._n-Lat._A)}^2} } \hfill \cr }$$
 $$\matrix{ { \vert \vec {BP} \vert } \hfill & { = \vert \vec {AP} \vert \times \cos \theta } \hfill \cr }$$
 $$\matrix{ { \vert \vec {CP} \vert } \hfill & { = \vert \vec {AP} \vert \times \sin \theta } \hfill \cr }$$
The angle θ is calculated by (see Figure 2):
 $$\theta = tan^{-1}\left( {\displaystyle{{Lon._n-Lon._A} \over {Lat._n-Lat._A}}} \right)-tan^{-1}\left( {\displaystyle{{Lon._B-Lon._A} \over {Lat._B-Lat._A}}} \right)$$
Then, the MPD for ship n is given by:
 $$MPD_n = \{ MPD_{P_1},MPD_{P_2}, \ldots MPD_{P_n}\} _{min}$$
2.2.2. Detecting the objects
Figure 3 shows SZ and MZ zones proposed for detecting crossing ships. When a ship approaches an OWF, ship dynamic information is received and stored via AIS stations. Once the ship enters the MZ, the Maritime Mobile Service Identity (MMSI) of the ship is recorded and the ship is tracked continuously until it leaves the monitoring area. During the period the ship sails inside the MZ, the ship positions (P n) are recorded as well as the corresponding ship courses and speeds. By using the proposed MPDA, the distance between the ship position P n and the OWF is calculated and the smallest distance is the MPD corresponding with the MPP at position P.
2.2.3. Data filtering
Figure 4 shows the general procedure for AIS data filtering. The starting point of the flowchart is data collection, which includes both AIS data and OWF-related information. The MPD of each MZ crossing ship is calculated by using the MPDA and the dynamic information of ships recorded at the MPP. The results need to be contextualised by some additional elements such as ship details (for example, ship type, ship size, ship speed, ship course, etc) and environmental conditions (for example, season).
Framework of the AIS data-filtering model.

2.3. Statistical analysis
The framework analyses the characteristics of the ship traffic flow before and after the OWF installation. By using statistical approaches, the MPD distributions after OWF installation can be generated to characterise probabilistically the most likely passing distance of the ships. Gaussian mixture models are adopted to describe the uncertainty on the ship route lateral distributions before and after the OWF installation, and these distributions reflect the ship route changes due to the newly built OWF.
However, OWF impact on different type of ships can be different. Therefore, a multivariate statistical analysis is conducted to investigate relationships within different traffic flow characteristics. The multivariate statistical analysis refers to analysing the impact of the OWF under different conditions. In the Marine Guidance Note (MGN) 543 (MCA, 2016), the MPD is an important factor for evaluating the ship passing risk. Thus, comprehensive analyses between the MPD and other factors such as the ship type categories and seasons are suggested.
2.4. Discussion and guidance
By following the above steps, results can be obtained to assess OWF impacts on nearby maritime traffic. For example, the study of MPD distribution in the presence of the OWF provides information to properly identify safety passing distances for specific scenarios. The comparison of the ship traffic flow distributions before and after OWF installation also provides relevant information to characterise the level of traffic congestion and, consequently, the impact on the risk of ship collision.
3. CASE STUDY DESCRIPTION
The area of interest has been selected specifically for illustrating the methodology. The following case study selection criteria are set:
The location of the OWF should be close to the ship traffic flow;
The traffic flow around the OWF is stable and continuous;
The AIS data sets for the study area are easily accessible;
Impacts from other elements such as presence of channels, ports and anchorages are relevant.
3.1. Study area
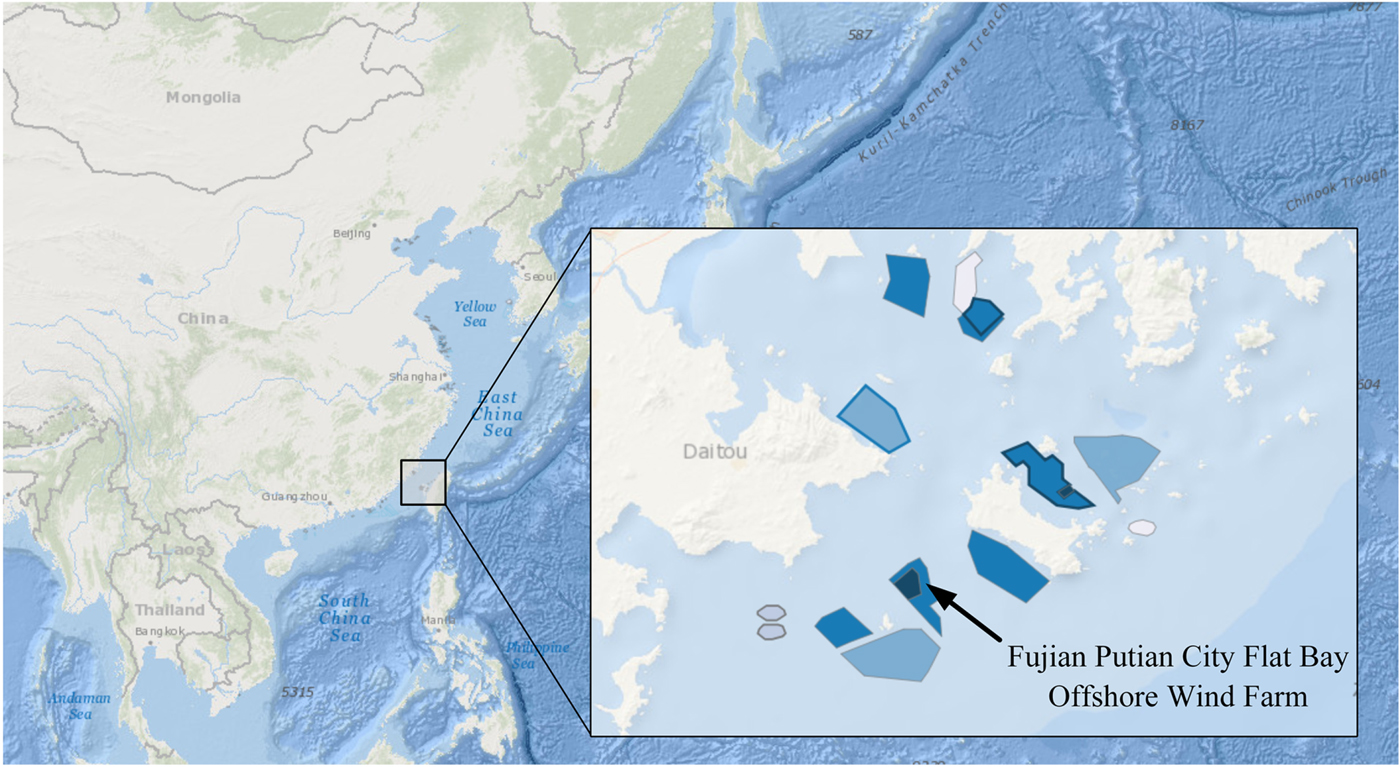
Considering the above criteria, a subproject (zone B) of the Fujian Putian City Flat Bay OWF is selected (see Figure 5). This wind farm is located northwest of Taiwan Strait, Putian coast. The distance from the OWFs to shore is about 8·3 km and the water depth is from 6 to 14 m. The generation capacity of this OWF is 50 Mega Watts (MW) and it covers 24·3 km2. The project started in 2014 and the second phase was concluded in 2016.
Location of Fujian Putian City Flat Bay Offshore Wind Farm.

The navigation environment around the study area is complex with numerous fishing vessels crossing the traffic lane of merchant ships and shallow reefs for fishing. Several OWFs are under construction in this area, and these new OWF projects limit the navigable waters area both on the northwest and southeast bounds (see Figure 5), Meanwhile, Nanri island in the northwest of the water area naturally constrains the vessel traffic flow, and the shallow waters with reefs to the northeast of the route do not provide enough water depth for shipping. As a result, a route called the Nanri vessel route was established and became a main route for coastal vessels passing through the water area. There is no Traffic Separation Scheme (TSS) and all merchant ships were recommended to follow the Nanri vessel route, which partly crosses the proposed OWF area. After OWF installation, ships needed to offset their routes to adapt to the new conditions. Hence, this route is an excellent case study to analyse the OWF influence on local marine traffic.
3.2. AIS database
The raw AIS data used in this paper was provided by the China Maritime Safety Authority (MSA). As mentioned above, the study area has several fisheries, and the number of fishing vessels is significant. It is noteworthy that according to regulations from the China Oceanic and Fishery Bureau, fishing vessels with more than 60 horsepower registered in China are required to be fitted with an AIS equipment to ensure safety, either the Very High Frequency (VHF) AIS and the BeiDou satellite AIS (Ministry of agriculture of the People's Republic of China, 2015). Hence, the collected AIS data sets include most of the vessels in the study area. The data sets contain historical AIS data before and after the wind farm had been fully constructed. The OWF was fully built in 2016 and, therefore, one-year raw AIS data sets for the years 2014 and 2017 were used in this study. The boundary points of the AIS data are 24° 57′ 55·980″ N, 119° 5′ 15·960″ E (lower-left corner) to 25° 19′ 43·440″ N, 119° 42′ 42·600″ E (top right corner).
4. STATISTICAL RESULTS AND DISCUSSION
The proposed framework has been used to process the two one-year AIS data sets corresponding to the monitoring area previously defined. During 2017, 17,444 ships crossed the MZ. The AIS data set of 2014 shows that 26,645 ships crossed the same MZ. Most of the crossings in the 2017 data set were merchant ships, fishing vessels and some maintenance ships. An obvious decrease in the number of passing ships after the OWF had been installed is apparent.
4.1. Statistical results of MPDs and MPPs
In order to assess the OWF influence on maritime traffic, the distribution of the MPDs after OWF installation is investigated. The results obtained are presented in Table 1. The MPD statistics after the OWF installation (year 2017) show that very few ships passed the OWF with MPDs smaller than 0·5 nm (8%). The range from 1 nm to 2 nm corresponds to the most likely MPD observations, contributing to 61% of the total number of ships in the MZ after the OWF had been built.
Ship Minimum Passing Distance (MPD) statistics after OWF installation.

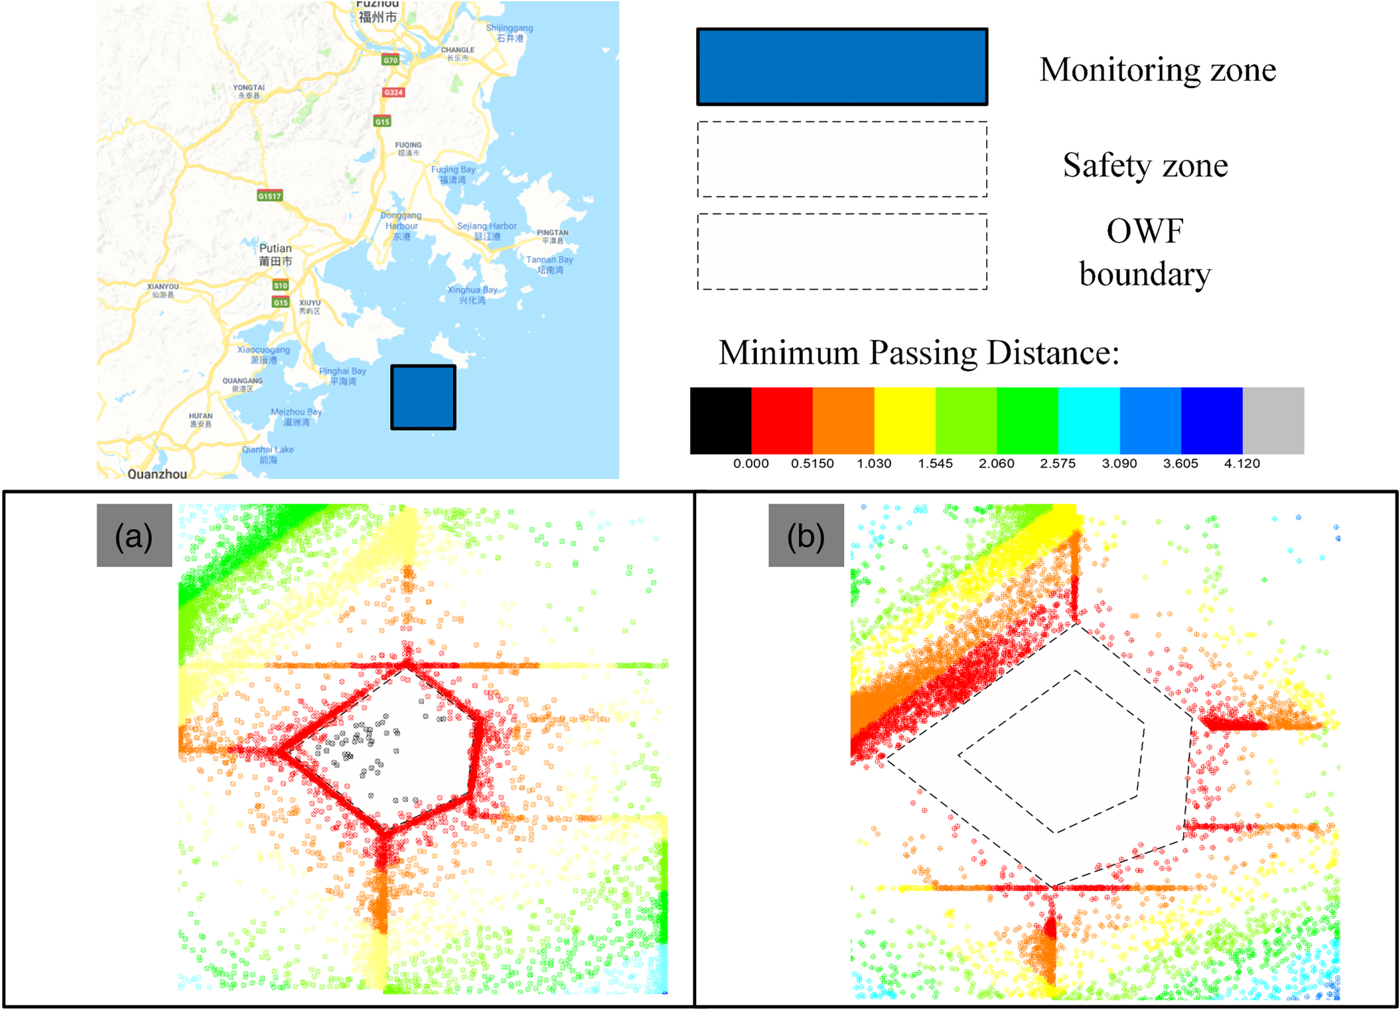
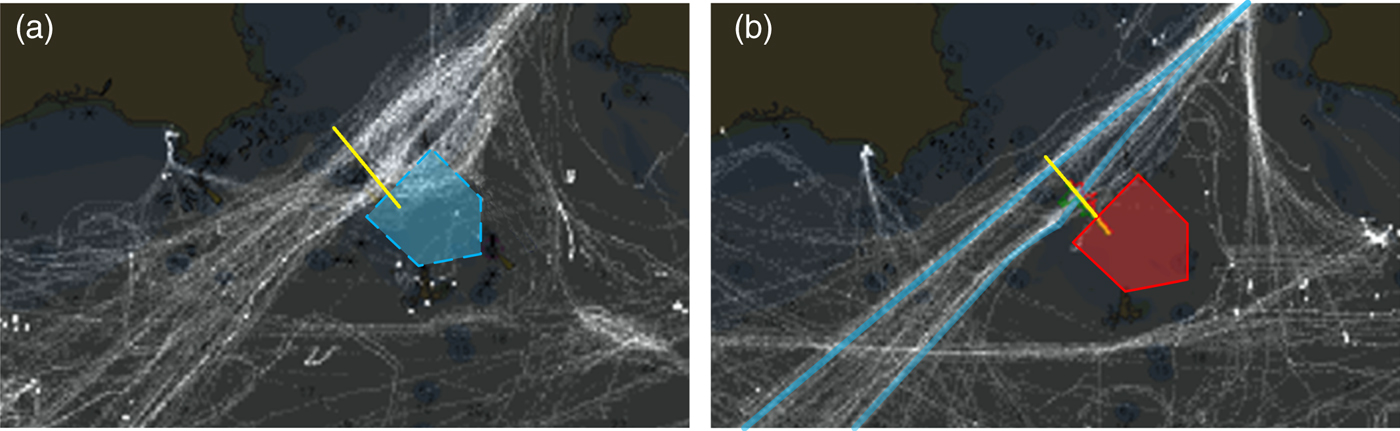
Figures 6 and 7 show the MPPs and the trajectories of all passing ships before and after OWF installation. Before OWF installation, the traffic route northwest of the proposed OWF site was spread along a wide lane (Figures 6(a) and 7(b)). Figures 6(b) and 7(b) show that after the OWF installation the northwest maritime traffic (Nanri route) has changed and merchant ships do not cross the OWF boundary and that most of the ships kept an acceptable distance from the wind turbines. The northwest ship traffic flow is now organised and compressed with a high density of ship trajectories near the SZ. The average MPD is about 1·5 nm.
Ship Minimum Passing Points (MPPs) before (a) and after (b) installation.

Ship trajectories before (a) and after (b) OWF installation.

4.2. Route changes
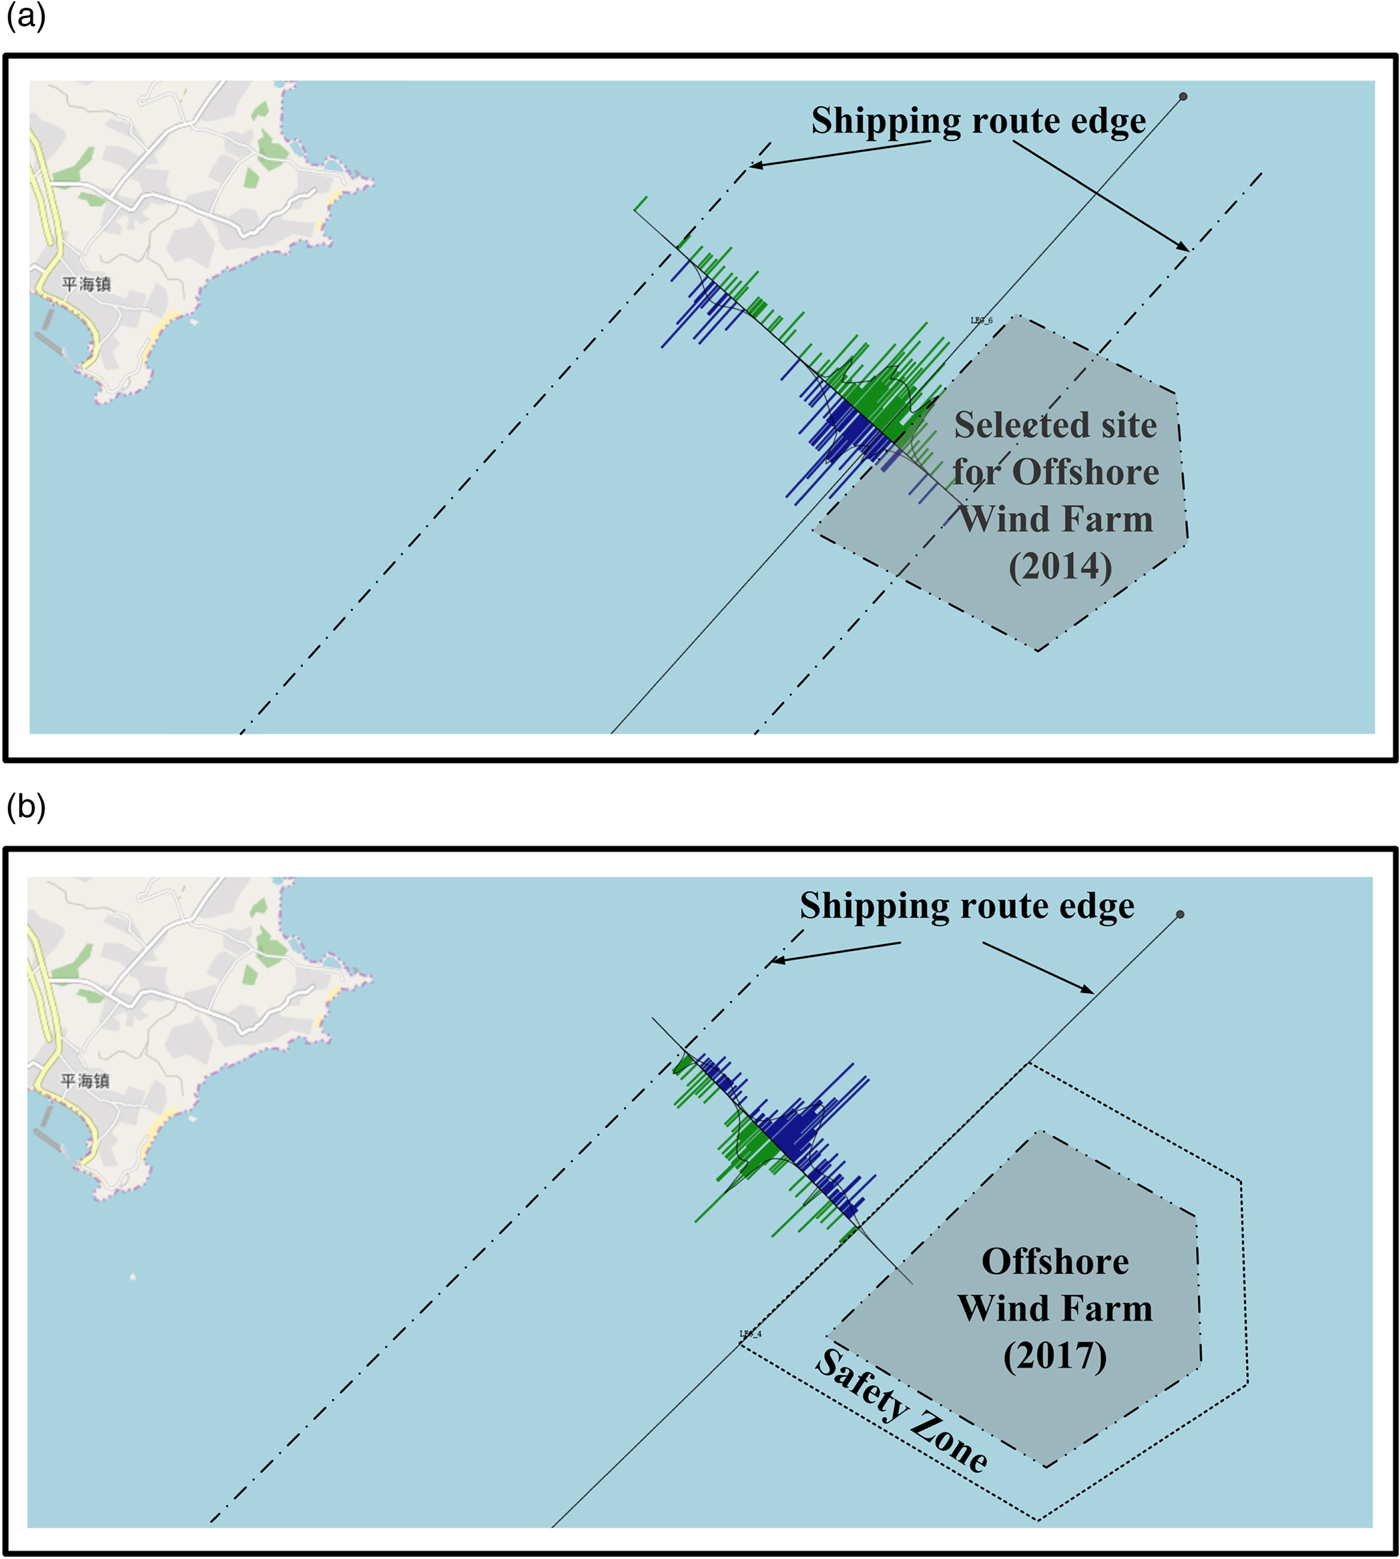
In order to investigate the influence of the OWF on the route traffic an observation gate was set that crosses the Nanri vessel route transversely (see Figures 7, 8(a) and 8(b)). A total of 16,379 ship trajectories were observed crossing the gate before the OWF was installed, these included 11,349 north bound and 5,030 south bound trajectories. After the OWF was constructed, 15,176 ships were observed crossing the observation gate, 10,392 north bound and 4,784 south bound trajectories.
Lateral distribution of the marine traffic at the observation gate set at the Coastal Small Ship Route. (a) Lateral distribution of the marine traffic in 2014. (b) Lateral distribution of the marine traffic in 2017.

The Mixture Distribution approach has been adopted to describe the lateral probability distribution of the ship trajectories at the observation gate before and after OWF installation. The mixture distribution is a weighted sum of m component Gaussian densities, given by:
 $$f_{MG}(x) = \sum\limits_{k = 1}^m {w_k} f_k(x)$$
with:
 $$\sum\limits_{k = 1}^m {w_k} = 1$$
where the f MG(x) is the mixture Gaussian (MG) probability density distribution, k is the mixture number, w k is the mixture weight or mixture coefficient and f k(x) stands for each sub probability density distribution.
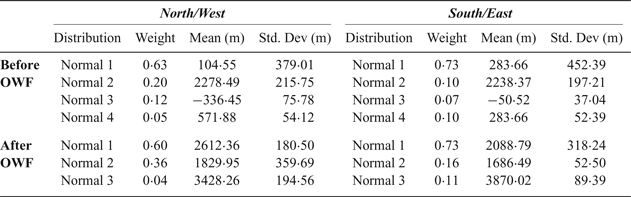
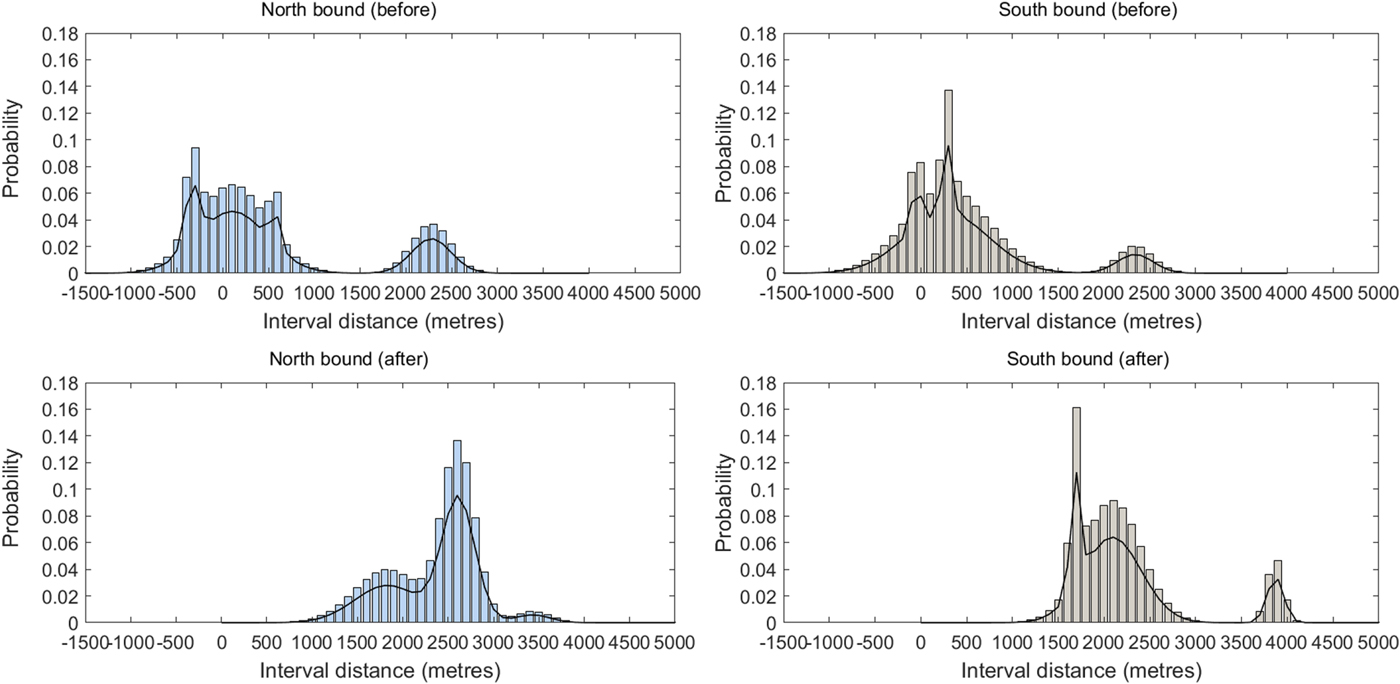
In this paper, the International Association of Lighthouse Marine Aids to Navigation and Lighthouse Authorities (IALA) Waterway Risk Assessment Programme (IWRAP) toolbox (IALA, 2019) is employed to obtain the mixture distribution coefficients for two traffic patterns, before and after the OWF installation. IWRAP has been recommended by IALA and it provides a model to extract the route lateral distribution from AIS data. For example, Cucinotta, et al. (Reference Cucinotta, Guglielmino and Sfravara2017) applied the IWRAP model to evaluate the ship collision risk in the Strait of Messina. Table 2 shows the distribution coefficients of the traffic flow before and after OWF installation calculated by the IWRAP tool. The obtained Gaussian mixture distributions are shown in Figure 9.
Distribution coefficients of the marine traffic at the Coastal Small Ship Route before and after OWF installation.

Probability distribution of the ship trajectories before and after the OWF installation.

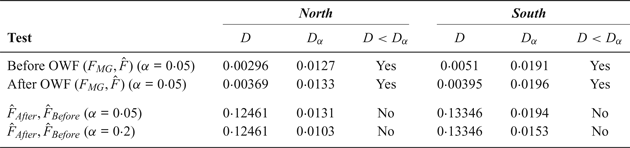
The Kolmogorov-Smirnov (KS) test (Gopal, Reference Gopal2006; Tasseda and Shoji, Reference Tasseda and Shoji2018; Pachakis and Kiremidjian, Reference Pachakis and Kiremidjian2005) is used to assess the goodness of fit of each mixture Gaussian distribution (F MG) to the observed north and south bounds trajectories and to assess whether the lateral distributions of the traffic before and after the OWF installation differ from a statistical point of view. The results of the Kolmogorov-Smirnov tests are shown in Table 3. The K-S test consists of comparing the maximum difference D between the empirical (F̂) and the theoretical (F MG) cumulative distributions with a critical value D α. If D < D α, the null hypothesis that the two distributions are similar at a level of significance α is approved (Gopal, Reference Gopal2006). The critical value D α can be calculated  $D_{\alpha}=1.36/\sqrt{n}$, for α = 0 · 05 where n is the number of observations. Table 3 shows that the mixture Gaussian distributions adequately describe the individual traffic flows (first two lines of Table 3), as D < D α for all individual traffic flows.
Mixture Gaussian distribution tests.

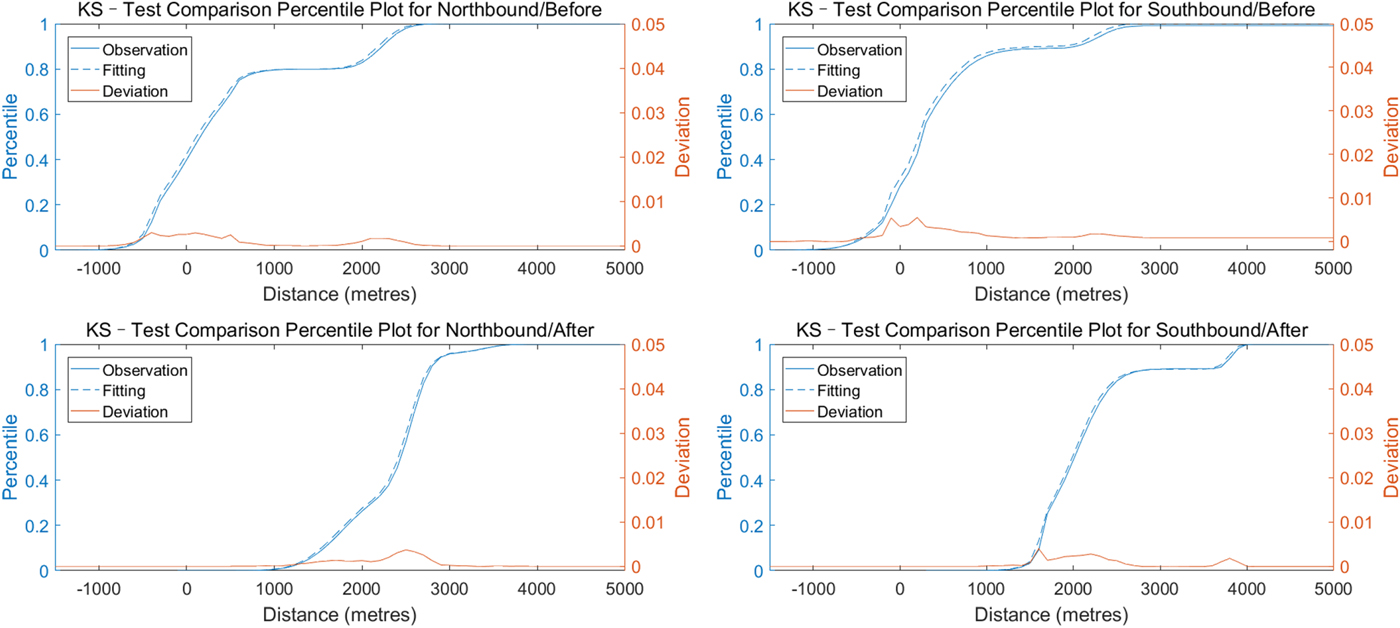
Moreover, Table 3 shows that the empirical distributions of the traffic before and after the OWF installation  $\lpar \hat{F}_{After}\comma \; \hat{F}_{before}\rpar $ are statistically different as D > D α for α = 0 · 05 and 0·20 (last two lines of Table 3). Figure 10 shows the cumulative distributions of the maritime traffic before and after OWF installation and the corresponding deviations between the distributions.
K-S test for four fitted distributions of traffic patterns.

In Figure 9, the OWF boundary is selected as the start point for all distributions. Therefore, the changes of the traffic flow before and after the OWF installation can easily be compared. The results show that both the interval distance and the route width have obviously changed. Before the OWF was installed, the route width was about 4,000 m (2·2 nm). The ship trajectories show a scattered distribution. In the north bound flow, distance groups from −1,000 to 1,000 m and 1,700 to 2,900 m contain most of the ship trajectories, 79·5% and 20% respectively. South bound are grouped between −1,000 to 1,500 m and between 2,000 to 2,700 m. The route width was approximately 3,900 m (2·1 nm). After the OWF was built, ship trajectories have been compressed and shifted to the west. Figure 9 shows that many northbound ships passed the OWF between 2,400 to 2,800 m, and the southbound passing ships were grouped between 1,500 to 2,400 m. All ship trajectories keep a clear distance from the OWF boundary, which is about 1,000 m. Northbound ships crossed the route gate at a distance from 1,000 to 3,700 m, and southbound ships crossed the route gate between 1,100 to 4,000 m. The total width of the route decreased to approximately 3,000 m (1·6 nm).
4.3. Passing ships speed differences
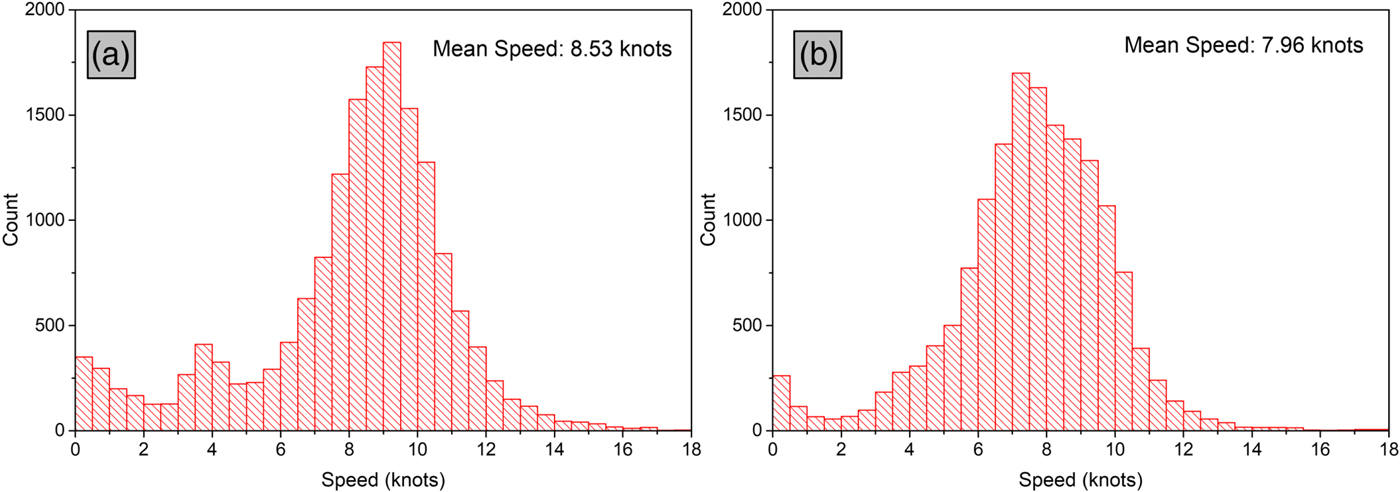
The passing speeds of the ships at the MPPs before and after the OWF installation have also been assessed. The speed distribution of all monitored ships shows that the OWF also influences the average passing speed, as shown in Figure 11. The average speed of the ships before OWF installation was 8·53 knots. However, after the OWF was installed, the average passing speed decreased to 7·96 knots and the uncertainty also reduces. It can be seen that a large amount of ship speeds were concentrated in the range 6–12 knots (20,983 records, 78·8%) prior to OWF installation. After the OWF installation, the speed distribution is compressed from 5–10 knots (13,060 records, 74·9%). Two reasons can explain the observed reduction in ship speed. One possible reason is that although previous results have shown that the number of passing ships has dropped, the density of ships on the route has increased due to the compression of the route width. Another reason is possibly that ships typically decelerate voluntarily before approaching the OWF due to the allision potential with the OWF.
Speed distributions of passing ships before (a) and after (b) OWF installation.

4.4. Ship passing distance for different ship type categories
The data set was next used to analyse the MPDs for different ship type categories. All ships were categorised into four groups: (1) general cargo ships that include bulk carriers, containers, general cargo ships and Roll on-Roll-Off (Ro-Ro) ships; (2) oil and gas tankers that group all types of oil and gas tankers (Liquid Petroleum Gas (LPG) or Liquid Natural Gas (LNG) tankers); (3) fishing vessels and (4) supply and maintenance vessels. The overall distributions in the years of 2014 and 2017 are shown in Figure 12. In 2014, before the OWF was installed, 65% of the passing vessels (17,319 ships) were merchant ships, including 11,109 general cargo ships and 6,210 oil and gas tankers. The number of fishing vessels was 8,793, corresponding to about 33%. Supply and maintenance vessels were very rare and made up only 2% of the total (533 ships). In 2017, after the OWF installation, the percentage of merchant ships decreased to 52% (9,071 ships), due to a significant reduction in the number of general cargo ships (from 11,109 to 4,251 ships). The percentage of fishing vessels rose from 33% to 41% but the number of vessels decreased from 8,793 to 7,152. Only the supply and maintenance vessels increased both in terms of number and percentage, which reflects the increased number of vessels for building and servicing new OWF projects that have been constructed in this area. In this case, the percentage of ships increased from 2% to 7% and number of ships doubled in year 2017 in comparison to 2014. The above results show a significant decline in the number of ships on passing traffic flows after the construction of the OWF.
Number of ships for each ship category in year 2014 (before) and in year 2017 (after OWF installation).

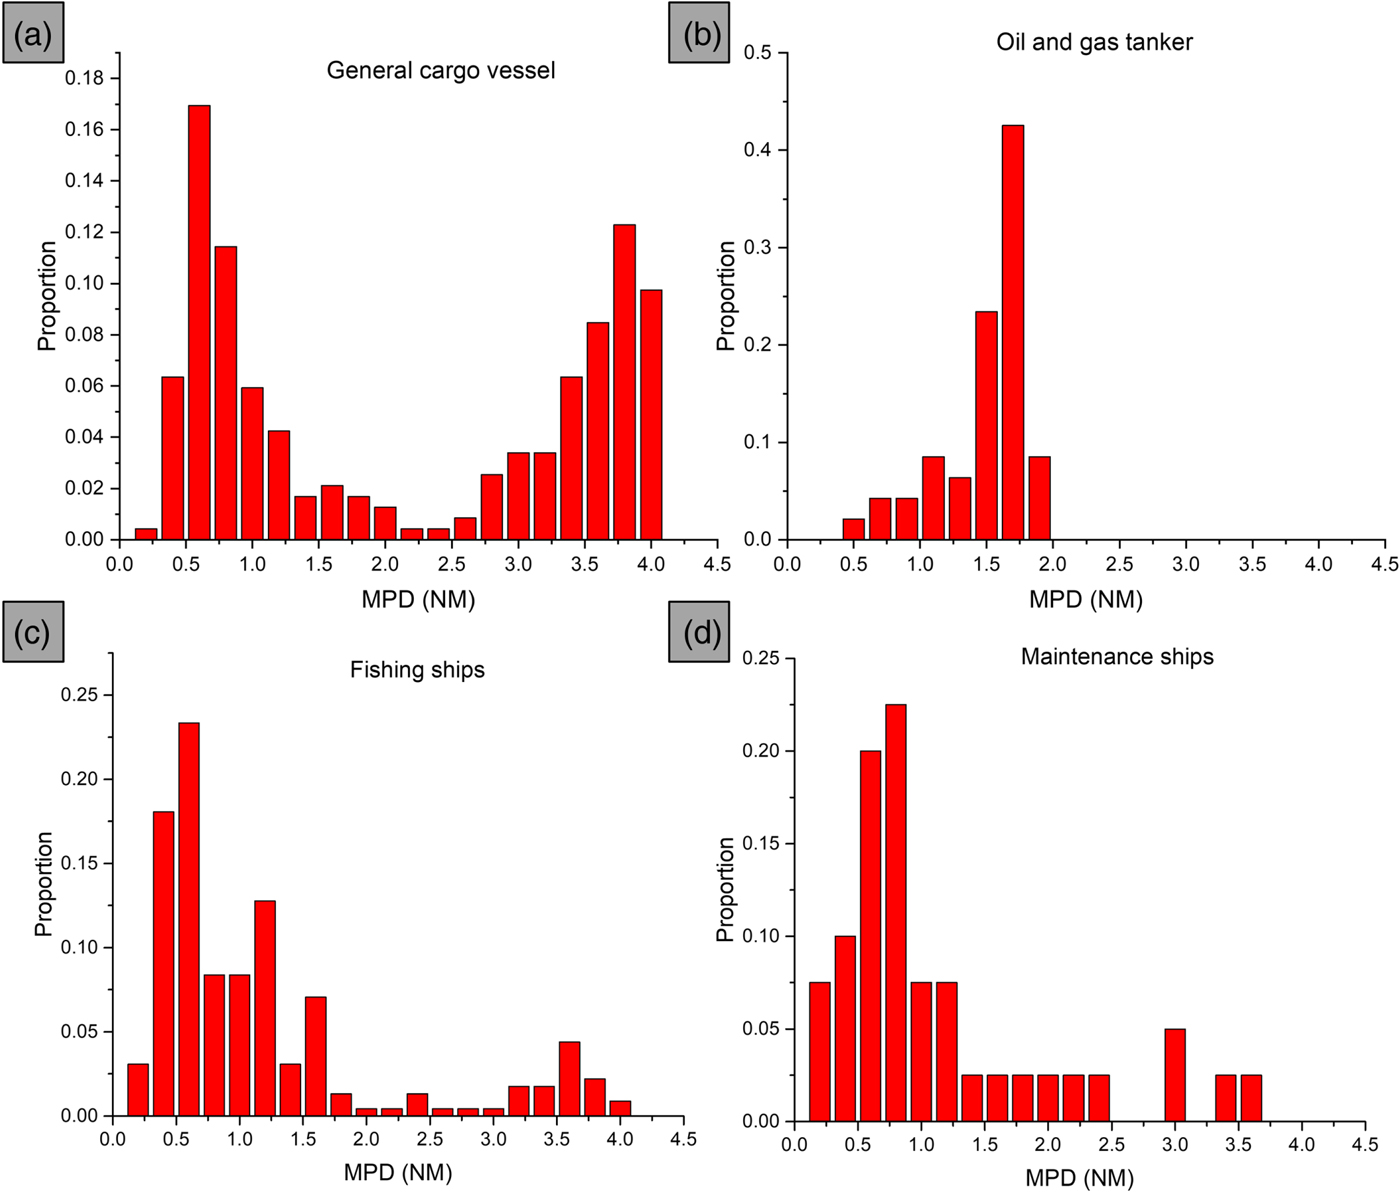
Considering the MPD under different ship categories, Figure 13(a) shows that the MPDs of general cargo ships concentrate at two ranges, one from 0·5 to 1 nm, which accounts for 34% of the total volume, and another from 3·3 to 4 nm (32%). Ships in the range between 0 nm to 0·5 nm were very rare. Figure 13(b) shows the MPD of tankers. 72% of all tankers kept a distance (MPD) between 1·5 to 2 nm, which is higher than all other ship categories. Figure 13(c) illustrates the MPD of fishing vessels. About 45% of the fishing vessels crossed the OWF area at less than 0·7 nm. The distance between 0·3 to 0·7 nm is extremely likely due to two reasons. Firstly, the ability of fishing vessels to operate in shallow and confined water is much better than that of merchant ships. Secondly, this area was a fishery in the past, which has been occupied by the OWF. The fishing vessels sail closer to the OWF and fish there. To avoid collisions with other ships, the fishing vessels have to work between the OWF borders and the traffic routes, which increases their risks. Figure 13(d) shows the MPD distribution of maintenance ships, which is similar to that of fishing vessels. The supply and maintenance ships enter and sail around the OWF boundary, and therefore, the average MPD for maintenance ships is small (43% between 0 to 0·9 nm).
Ship Minimum Passing Distance (MPD) distributions for different ship categories.

5. CONCLUSIONS
This paper proposes a framework to characterise the impact of an OWF on maritime traffic and on a specific route by means of a statistical analysis of AIS data. The Putian City Flat Bay OWF is adopted as a case study, for which two one-year AIS data sets before (2014) and after (2017) OWF construction are available.
The paper first describes an effective AIS-data filtering algorithm to obtain the MPD and the MPP of all ships that have crossed a monitoring area set around the OWF. In total 26,645 ships crossed the MZ in 2014, which reduced to 17,444 ships in 2017, showing an obvious reduction in the number of passing ships on the monitoring area after OWF construction, as the OWF is located on a previous shipping route and, therefore, the ships have to change their trajectories to adapt to the new conditions.
A statistical analysis of the MPDs and MPPs of all passing ships in the monitoring area has quantitatively characterised the impact of the OWF on the ship traffic patterns.
The results show that the ship trajectories in the vicinity of the OWF change. Before the OWF was built, MPDs of the passing ships were normally less than 0·5 nm. After OWF construction, the most likely MPD increased to around 1–2 nm.
Gaussian Mixture distributions have been adopted to describe the lateral probability distribution of the ship trajectories on a route located northwest of the OWF. The model shows that the width of the route has been compressed due to the presence of the OWF and that the ships kept a distance of approximately 0·5 nm from the OWF boundary. A comparison on the average speeds of the passing ships was also conducted, showing that the presence of the OWF leads to a reduction in speed of the ships in the vicinity of the OWF.
Then, the MPDs data sets were subdivided according to the ship categories with the objective of analysing the impact of the ship type on the MPDs. The OWF installation has caused a significant reduction in the number of nearby passing ships. It was also shown that tankers have the largest MPD. MPDs of fishing and supply and maintenance ships are smaller, which indicates that these ships have a higher probability of allision than merchant ships.
The methodology and the results obtained by this paper can be used effectively in many other studies. First, the AIS data filtering method provides an approach to quantitatively assess the OWF influence on the ship traffic flow under different conditions. Secondly, the statistical analysis of the MPDs and MPPs of passing ships and the probabilistic modelling of the ship trajectories before and after OWF construction provide insights on the characteristics of the ship traffic flow for maritime safety authorities during the OWF planning, construction and operation stages. Moreover, this paper provides a data-based approach for further research works on OWF site selection, and collision/allision risk analysis and management.
ACKNOWLEDGMENTS
The contribution of the first and second authors was supported by the National Science Foundation of China (NSFC), under Grant No. 51479157. The contribution of the third and fourth authors was co-funded by the European Regional Development Fund (Fundo Europeu de Desenvolvimento Regional - FEDER) and by the Portuguese Foundation for Science and Technology (Fundação para a Ciência e a Tecnologia - FCT) under project “Integrated System for Traffic Monitoring and Maritime Risk Assessment (MoniRisk)”, No. 028746.