I. INTRODUCTION
Since the end of the last century, the area of solid-state lighting has been a tremendous development due to a rapid advance of the technology of phosphors that is used as lighting sources on the foundation of a nitride-based lighting-emitting-diodes (LEDs) chip. Reference George, Denault and Seshadri1,Reference Chen, Liu, Mei, Liu, Fang and Huang2 Currently, LEDs are widely investigated because of their high efficiency, durability, reliability, and environmental friendliness. With more superior optical performance and easier compositions, white-lighting-emitting-diodes (WLEDs) have attracted more attention to improve properties or design novel phosphors excited by near-UV or blue light. Reference Höppe3–Reference Lin and Liu6 WLEDs are considered as the next generation lighting sources to replace the traditional incandescent lamps and fluorescent lamps. Therefore, it is necessary to develop efficient and stable phosphors with high thermal quenching temperature in the visible light region under near-UV or blue excitation. Reference Li, Zhang, Zhang, Cai and Duan7 Simultaneously, the single-composition phosphors can prevent from the drawbacks of the degradation of luminescent intensity due to the reabsorption among the phosphors, which is caused by multi-component phosphors. A controllable emission adjustment will be required to obtain white light by mixing suitable complementary color region. Reference Li, Shi, Zhu, Wu, Li, Wang, Wang and Wang8–Reference Wang, Lin, Xu, Chen and Wang10
Rare earth ions have been widely investigated as activators to doping into host materials due to the peculiar multi-level structure with a variety types of transition. Reference Hong and Wang11,Reference Zhong, Wang, Han, Lv, Wang, Zhang, Ding, Zhang, Wang, He, Zhong, Schneeloch, Gu, Song, Ma and Xue12 Numerous 4f levels are not sensitive to local coordination environment because of shielding effect, which leads to a stable characteristic emission spectrum. Reference De Vries, Smeets and Blasse13–Reference Lü, Guo, Jia, Zhao, Lv, Jiao, Shao and You15 In particular, 5d–4f transition of Eu2+ and Ce3+ are sensitive to local variation of structure, resulting in crystal field splitting to form a broad band emission. Reference Park, Singh, Yoon and Sohn16–Reference Wang, Ye, Zhang and Wang20 By controlling the doping concentration and preferential occupancy of rare earth ions at different crystallographic site with different coordination environment, we can adjust controllably the optical properties of the host materials. Alkaline earth silicates, as a kind of acclaimed hosts of phosphors, have been extensively investigated attributed to their chemical, physical, and thermal stability. Reference Li, Li, Li, Yong, Zou, Zou, Gan and Xu21–Reference Li, Yang, Wang and Wu25
In this work, we have synthesized Sr2MgSi2O7:Ce3+, Sr2MgSi2O7:Tb3+ phosphors via conventional high temperature solid-state method and investigated the influences of sintering temperature and sintering time on the formation of host lattices and luminescent intensity. At the same time, we have investigated the crystal structure, luminescent properties, morphology, the mechanisms of concentration quenching and crystal field effect of Sr2MgSi2O7:Ce3+ phosphors. f–f transition of Sr2MgSi2O7:Tb3+ phosphors are also interpreted. By adjusting the doping concentration of Ce3+ and Tb3+, the emitting region of phosphors can be continuously changed from violet–blue light to blue light of visible light region.
II. EXPERIMENTAL
A. Materials and synthesis
The Sr2−x MgSi2O7:xCe3+, Sr2−y MgSi2O7:yTb3+, and Sr2−x−y MgSi2O7:xCe3+,yTb3+ samples were synthesized by high temperature solid-state method. The initial reagents are SrCO3 (A.R.), MgO (A.R.), SiO2 (A.R.), H3BO3 (A.R.), and BaF2 (A.R.). H3BO3 (A.R.), BaF2 (A.R.), CeO2 (99.99%), and Tb4O7 (99.99%) serve as fluxes. Reagents were weighed out by the stoichiometric ratio and then blended thoroughly by grinding in an agate mortar for 30 min. After then, the powder mixtures were transferred into a corundum crucible to calcine at 1100 °C for 2 h within a CO reducing atmosphere to obtain the final samples.
B. Measurements and characterization
The X-ray diffraction (XRD) patterns are performed on a D8 Advance diffractometer (Bruker Corporation, Karlsruhe, Germany) with Cu Kα radiation (λ = 1.54, 178 Å) at a scanning rate of 0.02° s−1 in the 2θ range from 10° to 70°. The photoluminescence emission (PL) and photoluminescence excitation (PLE) spectra are measured by a Hitachi F-4500 spectrophotometer (Hitachi Corp., Tokyo, Japan) equipped with a 150 W Xe lamp as the excitation source, and the step of excitation and emission spectra is set up to 1.0 nm with the width of the monochromator slits adjusted to be 0.50 nm. The morphology of samples is characterized by a Hitachi SU8010 field emission scanning electron microscope (FESEM; Hitachi Corp.). All measurements are performed at room temperature.
III. RESULTS AND DISCUSSION
A. Crystal chase and crystal structure
For Sr2−x
MgSi2O7:xCe3+, Sr2−y
MgSi2O7:yTb3+, and Sr2−x−y
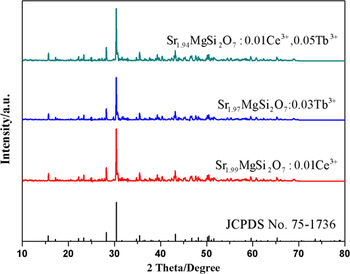
MgSi2O7:xCe3+,yTb3+ samples, we select three representative Sr1.99MgSi2O7:0.01Ce3+, Sr1.97MgSi2O7:0.03 Tb3+, and Sr1.94MgSi2O7:0.01Ce3+,0.05 Tb3+ samples to be detected by XRD. Figure 1 shows the representative XRD patterns of Sr1.99MgSi2O7:0.01Ce3+, Sr1.97MgSi2O7:0.03 Tb3+, and Sr1.94MgSi2O7:0.01Ce3+,0.05 Tb3+ samples calcined at 1100 °C for 2 h. It is apparent that all the diffraction peaks of samples can be matched well with the standard card JCPDS No. 75–1736 of Sr2MgSi2O7. No other phase is observed, indicating that the doping ions can not cause significant change to the crystal structure. The Sr2MgSi2O7 host is a tetrahedral (space group
 $P\bar 421m$
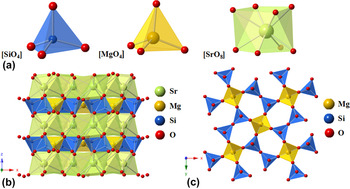
). The unit cell parameters of the host are a = b = 7.9957 Å, c = 5.1521 Å, and V = 329.38 Å respectively. The crystal structure of Sr2MgSi2O7 is exhibited in Fig. 2, according to the previously reported crystallographic data (ICSD 155,330).
Reference Kimata26
As shown in Fig. 2(a), the Si atom is surrounded by four oxygen atoms, forming a four-coordination [SiO4] tetrahedron structure. Two [SiO4] tetrahedrons connect together to form [Si2O7] by sharing a common oxygen atom. The Mg atom, at 2a site, constitutes a [MgO4] tetrahedron with surrounding four oxygen atoms. These two kinds of tetrahedrons connect together in a staggered way to constitute the polyhedral layers, which is shown in Fig. 2(b). The polyhedral layers are composed of [SiO4] and [MgO4]. The advantage of the layers is that it can isolate Sr2+ by acting as a shield and resist the attack of oxygen even at high temperature.
Reference Saradhi, Boudin, Varadaraju and Raveau27
And the Sr atom constructs an eight-coordination [SrO8] decanedron by surrounding oxygen atoms. A number of [SrO8] decanedrons constitute [SrO8]
n
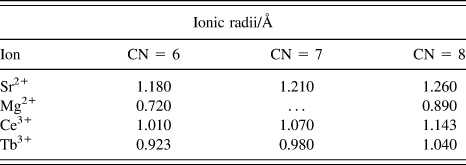
layers between the layers which are composed of [SiO4] and [MgO4]. Table I lists the ionic radii of Sr2+, Mg2+, Ce3+, and Tb3+.
Reference Shannon28
The radii of Ce3+ and Tb3+ are close to the radius of Sr2+. The charges of above ions are similar, two Ce3+ or Tb3+ may substitute three Sr2+ sites to remain the charge balance. On the basis of ionic radii and charge balance, Ce3+ and Tb3+ tend to occupy the Sr2+ sites.
XRD patterns of Sr1.99MgSi2O7:0.01Ce3+, Sr1.97MgSi2O7:0.03 Tb3+ and Sr1.94MgSi2O7:0.01Ce3+,0.05 Tb3+ samples.

(a) The coordination environment of Si2+, Mg2+, Sr2+. (b) Crystal structure of Sr2MgSi2O7 viewed along [010]. (c) Staggered arrangements of [SiO4] and [MgO4] units along [001].

Ionic radii (Å) of different cations for the given coordination number (CN).

B. Photoluminescence properties of Ce3+ doped phosphors
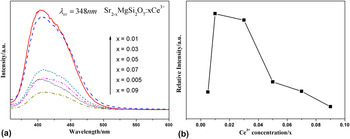
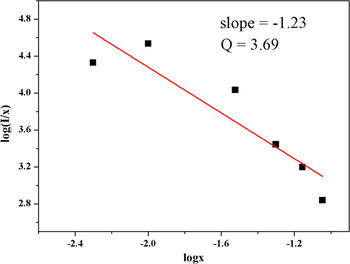
Figure 3(a) and (b) present the PL spectra and relative PL intensity of Sr2−x MgSi2O7:xCe3+ (x = 0.05–0.09), respectively. Figure 3(a) shows a broad violet–blue asymmetric emission band ranging from 370 to 500 nm with excitation at 348 nm. Originally, the PL intensity of Sr2−x MgSi2O7:xCe3+ increase apparently with the augment of Ce3+. While the doping concentration of Ce3+ continuously increases, the intensity gradually descends. Higher doping concentration is not conducive to luminescent intensity. With increasing the concentration of doping ions, the lattice imperfection of as-prepared samples caused by doping ions will increase proportionally. However, a mass of defect will result in declining luminous intensity with energy transfer. As shown in Fig. 3(b), the luminescent intensity is optimized with the doping concentration of Ce3+ to be 0.01. When x is beyond 0.01, the spectra shows a negative correlation between the intensity and the doping concentration of Ce3+. The augment of Ce3+ makes the luminescence intensity decrease called concentration quenching. Reference Pauling29 There are three possible major factors to cause concentration: (i) The solid-solubility of activator in the host. High doping concentration of rare earth ions not only substitute the host-ions or fill the interstice but also may react with the host to form new phase. New phase will cause the decrease of luminescence intensity. As shown in Fig. 1, doping ions don’t cause the host lattice change significantly. Therefore, concentration quenching is not caused by new phase. (ii) The effect of lattice symmetry on luminescent intensity. Reference Tamura and Shibukawa30 Electric-multiple-transition is forbidden to high symmetry sites. Low doping content brings lattice distortion causing lower luminescent intensity, while the distortion may appear the new symmetry to cause concentration quenching with the increase of doping content. (iii) The exchange interaction between rare earth ions. With the increasing doping content of Ce3+, the distance between ions gradually decreases. A certain short distance will induce tunneling effect to cause concentration quenching. Reference Adane, Klein, Leger, Belin and Defourneau31 The effect of electronic multiple transition and exchange interaction can be interpreted by Dexter’s energy resonance theory. Reference Dexter and Schulman32 The concentration quenching is induced by the energy transfer between activators at certain ionic distance. To investigate the concentration quenching mechanisms among Ce3+, the Van Uitert expression is shown as follows Reference Van Uitert33 :
 $${I \over x} = K{\left[ {1 + \beta {{\left( x \right)}^{{Q \mathord{\left/ {\vphantom {Q 3}} \right. \kern-\nulldelimiterspace} 3}}}} \right]^{ - 1}}\quad ,$$
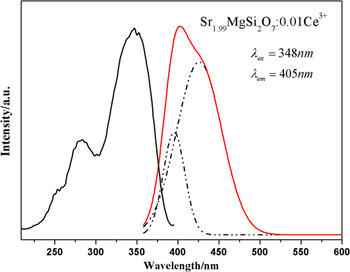
where x is the activator ions concentration, I/x is the emission intensity (I), and K and β are constants at the same excitation condition for the same host. The values of Q are 6, 8, and 10, corresponding to the energy transfer mechanisms of electric dipole–dipole (d–d), dipole–quadrupole (d–q), or quadrupole–quadrupole (q–q) interactions, respectively. For the Sr2MgSi2O7 host, the relationship of log(I/x) and log(x) is shown in Fig. 4. The slope of fitting line is −1.23. Thus, the value of Q is 3.69 which is close to 3. And the value of Q is far less than 6, testifying that the energy transfer of Ce3+ is not belonging to electric dipole–dipole interactions between Ce3+. The result indicates that the process of energy transfer among the nearest neighboring ions is the main mechanism of concentration quenching behavior among Ce3+ in Sr2MgSi2O7 host. Local structural variation among Ce3+ makes the short range exchange interaction improve with the increase of Ce3+ content, the energy will transfer rapidly between neighboring ions to reach the quenching center. Reference Zhang, Huang, Liu, Wang, Jiang, Zhang, Wang, Kong, Xi and Ji34 In addition, the emission peaks show a slight red shift with the increasing concentration of Ce3+, which could be attributed to the effect of the crystal field effect surrounding the Ce3+. In fact, the position of the emitting level of Ce3+ depends on two factors Reference Blasse and Bril17 : (i) the position of the center of gravity of the 5d level, which will be at lower energy if the valence increases, and (ii) the width of the crystal field splitting of the 5d level. For the first factors, the higher charge of Ce3+ makes the reduction of the 5d level position of the center of gravity, shrinking the energy of transition between 5d and 4f, while increasing concentration of Ce3+ intensifies the crystal field effect. For the second factor, it is connected with the crystal field theory. According to the crystal field theory, the crystal field strength is influenced by site symmetry, valence, ligand charge, and bond length. Reference Jang, Im, Lee, Jeon and Kim35 Crystal field splitting (D q) is expressed as follows Reference McClure36 :
 $${D_{\rm{q}}} = {1 \over 6}Z{e^2}{{{r^4}} \over {{R^5}}}\quad ,$$
where D q is a measure of the energy level separation, Z is the charge of the anion, e is the point charge, r is the radius of the wave function of d level, and R is the bond length. When Ce3+ substitute the Sr2+ sites, the distance between Ce3+ and O2− will be shorter because Ce3+ has a smaller ionic radii (1.143 Å for CN = 8). Crystal field splitting is proportional to 1/R 5, the shorter bond length improves the effect of crystal field splitting. Thus, the reduction of the 5d level position and the increase of the width of crystal field cause the red shift. As shown in Fig. 5, the PLE spectrum of Sr1.99MgSi2O7:0.01Ce3+ shows a strong and broad excitation band which consists of three peaks located at 252 nm, 282 nm, 348 nm, respectively. The broad excitation band is attributed to 4f → 5d transition of Ce3+ and matches well with near-UV chips. In addition, the emission band of Sr1.99MgSi2O7:0.01Ce3+ can be fitted by two Gaussian peaks which are located at 394 nm and 426 nm, respectively. It is well known that the emission spectrum of Ce3+ should be composed of double bands in view of the transition from 5d to 2 F 7/2 and 2 F 5/2 states which are separated by crystal field splitting. Reference Zhang, Huang, Yang, Lu, Wang, Xu, Zhang, Wang, Kong, Xi and Ji37 The theoretical energy difference of splitting between 2 F 7/2 and 2 F 5/2 of Ce3+ is about 2000 cm−1. Reference Lin and Su38 And the energy difference between 394 and 426 nm is about 1907 cm−1, which is close to the theoretical value. Thus, we can demonstrate that these two Gaussian peaks derive from the ground splitting of the single Ce3+ emission center.
(a) PL spectra of Sr2−x MgSi2O7:xCe3+ under 348 nm excitation. (b) Dependence of emission intensity on Ce3+ concentration.

The relationship between the log(I/x) and log(x) of Sr2−x MgSi2O7:xCe3+.

PLE and PL spectra of Sr1.99MgSi2O7:0.01Ce3+.

C. The influence of sintering temperature on photoluminescence properties
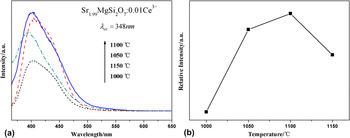
We select the Sr1.99MgSi2O7:0.01Ce3+ samples to investigate the influence of sintering temperature on photoluminescence properties for Sr2MgSi2O7 phosphors. The PL intensity of the samples is superior to other samples in the doping concentration aspect. Figure 6(a) shows the PL spectra of Sr1.99MgSi2O7:0.01Ce3+ calcined at different temperature with excitation at 348 nm. The variation trend is demonstrated clearly in Fig. 6(b). According to the PL spectra, the optimal sintering temperature is obtained which is 1100 °C. Initially, the PL intensity increases with the temperature increasing. When temperature is beyond 1100 °C, the intensity gradually decreases. The augment of temperature contributes to the improvement of crystallinity of phosphors. Reference Metz39 However, higher temperature may induce extra defects of host lattice. The defects, considered as quenching centers, consume transition energy by lattice vibration, resulting in downgrading the luminescent intensity and going against the crystallinity.
(a) PL spectra of Sr1.99MgSi2O7:0.01Ce3+ phosphors at different sintering temperature under 348 nm excitation. (b) Dependence of emission intensity on sintering temperature.

D. The influence of sintering time on photoluminescence properties
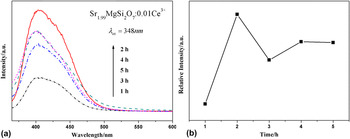
To investigate the influence of sintering time on photoluminescence properties for Sr2MgSi2O7 phosphors, we select the Sr1.99MgSi2O7:0.01Ce3+ samples calcined at 1100 °C to research and analysis. The PL intensity of the samples is superior in doping concentration and sintering temperature. Figure 7(a) displays the PL spectra of Sr1.99MgSi2O7:0.01Ce3+ synthesized at different sintering time monitored at 348 nm. It also shows a broad emission band ranging from 370 to 500 nm with excitation at 348 nm. Initially, increasing the sintering time strengths the emission intensity. When time is beyond 2 h, the intensity gradually decreases and then becomes stable. The variation trend of emission intensity is shown in Fig. 7(b). The trend shows that the optimum condition of sintering time is 2 h for luminescent intensity. Properly extending synthesis time contributes to improve the crystallinity, Reference Kumar, Khan and Chawla40 while long sintering time may lead to Ce3+ producing more lattice vibration or phonons to consume energy, which makes total luminous intensity descend. In addition, long sintering time may increase the defect and distortion of crystal structure. The system will absorb extra energy to counteract the effect brought by the defect and distortion, causing the reduction of the emission intensity.
(a) PL spectra of Sr1.99MgSi2O7:0.01Ce3+ phosphors under different sintering time at 1100 °C under 348 nm excitation. (b) Dependence of emission intensity on sintering time.

E. The morphology of Ce3+ doped phosphors
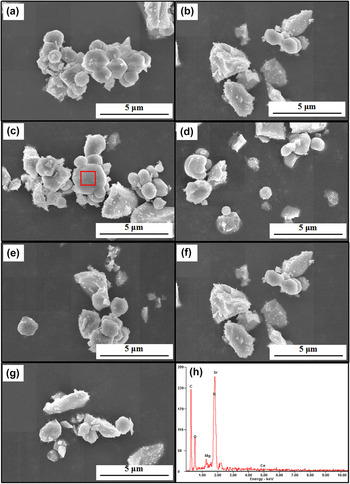
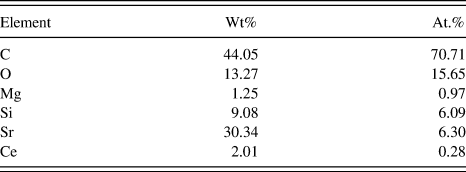
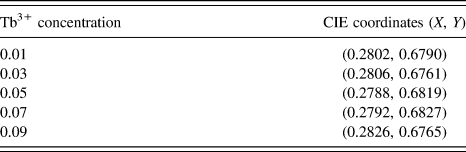
Figure 8 shows the morphology of a series of samples with different doping content of Ce3+ by field emission scanning electron microscopy (FESEM) equipped with energy dispersive spectroscopy (EDS). In general, Ce3+ doping does not have much influence on the micromorphology of Sr2MgSi2O7 phosphor. For pure Sr2MgSi2O7, irregular and dispersive particles can be observed in Fig. 9(a). The size of particles is about 1 μm, exhibiting a proper particle size and promising prospect for the WLEDs application. Reference Guo, Huang, You, Yang, Liu and Zheng41 With the increase of Ce3+, the morphologies do not change significantly. And the EDS spectrum of doped Ce3+ samples reveals that the powders consist of Sr, Mg, Si, O, Ce. The peak corresponding to C is obtained in the spectra because of conductive adhesive. Table II lists the content of each element. It indicates that Ce3+ have been successfully doped into Sr2MgSi2O7 host.
The FESEM images of Sr2−x MgSi2O7:xCe3+ phosphors with different doping concentration and EDS result of Sr1.99MgSi2O7:0.01Ce3+ phosphors. (a) x = 0. (b) x = 0.005. (c) x = 0.01. (d) x = 0.03. (e) x = 0.05. (f) x = 0.07. (g) x = 0.09. (h) EDS result of Sr1.99MgSi2O7:0.01Ce3+ phosphors.

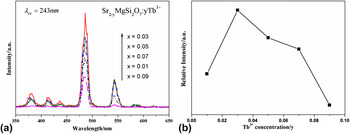
(a) PL spectra of Sr2−y MgSi2O7:yTb3+ (y = 0.01, 0.03, 0.05, 0.07, 0.09) under 243 nm excitation. (b) Dependence of emission intensity on Tb3+ concentration.

Each element content of EDS result.
F. Photoluminescence properties of Tb3+ doped phosphors
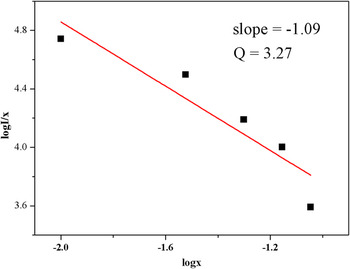
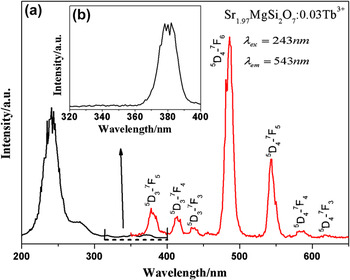
Figure 9 shows the PL spectra and relative PL intensity of Sr2−y MgSi2O7:yTb3+ respectively. Under 243 nm excitation, the PL spectra exhibit sharp and strong characteristic emission of Tb3+ due to the transitions of 5 D 3 → 7 F J in the blue region and 5 D 4 → 7 F J in the green region (J = 6, 5, 4, 3, 2). Originally, the PL intensity of Sr2−y MgSi2O7:yCe3+ increase apparently with the augment of Tb3+. While the doping concentration of Tb3+ continuously increases, the intensity gradually descends. The optimal concentration of Tb3+ is 0.03. When doping content of Tb3+ exceeds 0.03, an apparent concentration quenching appears among Tb3+. The variation tendency is demonstrated clearly in Fig. 9(b). To investigate the concentration quenching mechanism among Tb3+, the quenching mechanisms can also be acquired by Van Uitert expression. Reference Van Uitert33 The values of Q are 6, 8, and 10, corresponding to the energy transfer mechanisms of electric dipole–dipole (d–d), dipole–quadrupole (d–q), or quadrupole–quadrupole (q–q) interactions, respectively. For the Sr2MgSi2O7 host, the relationship of log(I/x) and log(x) is shown in Fig. 10, the slope of fitting line is −1.09. Thus, the value of Q is 3.27, which is close to 3. And the value of Q is far less than 6, testifying that the energy transfer of Tb3+ not belongs to electric dipole–dipole interactions between Tb3+. The result indicates that the process of energy transfer among the nearest neighboring ions is also the main mechanism of concentration quenching behavior among Tb3+ in Sr2MgSi2O7 host. Figure 11(a) shows the PLE and PL spectra of Sr1.97MgSi2O7:0.03 Tb3+ samples. The excitation spectrum (λem = 543 nm) exhibits two broad bands ranging from 220 to 265 nm with strong peak at 243 nm and one weak peak at 275 nm which are attributed to the 4f 8 –4f 75d 1 transitions. The ground state of Tb3+ includes high-spin (HS) 9 D J and the low-spin (LS) 7 D J states. Reference Ning, Mak and Tanner42 The two excitation peaks correspond to two kinds of f–d transitions. One is spin-allowed with high energy, and the other spin-forbidden with low energy. Reference Ten Kate, Zhang, Dorenbos, Hintzen and Van Der Kolk43 Figure 11(b) demonstrates the weak and sharp peak from 360 to 400 nm which is related to the 4f–4f intra-transitions of Tb3+ ions. The obtained emission spectrum consists of the f–f transition lines within the Tb3+ 4f 8 electron configuration, i.e., 5 D 3 → 7 F 5 (378 nm), 5 D 3 → 7 F 4 (414 nm), 5 D 3 → 7 F 3 (436 nm), 5 D 4 → 7 F 6 (486 nm), 5 D 4 → 7 F 5 (543 nm), 5 D 4 → 7 F 4 (579 nm), and 5 D 4 → 7 F 3 (618 nm), respectively. Reference Zhang, Huang, Jin, Sun, Ma, Zhang, Wang, Kong, Xi and Ji44 The sharp emission peaks of Tb3+ also verify that Tb3+ are not sensitive to local crystal structure due to the f–f transition. Thus, the shape of peaks can hold a characteristic emission spectrum. Reference Ye, Xiao, Pan, Ma and Zhang45,Reference Zhang, Zhou, Pang, Shi and Gong46 Comparing two situations of doping, it illustrates that silicate is a kind of host which is appropriate for phosphors with the stable physical and chemical property. Meanwhile, doping two different rare earth ions achieve the thing that we can tune the emission wave length by control doping ions and their concentration to obtain the optimal effect.
The relationship between the log(I/x) and log(x) of Sr2−y MgSi2O7:yTb3+.

(a) PLE and PL spectra of Sr1.97MgSi2O7:0.03 Tb3+. (b) The magnified excitation spectra (λem = 543 nm) of Sr1.97MgSi2O7:0.03 Tb3+ from 320 to 400 nm.

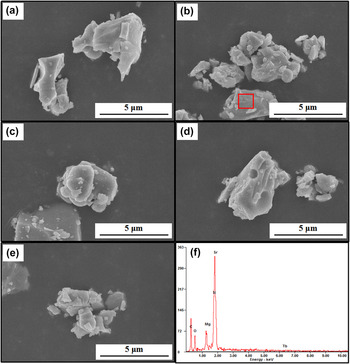
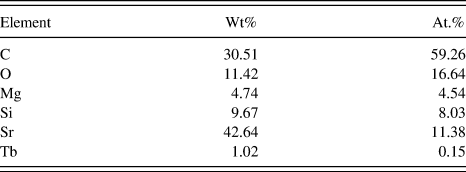
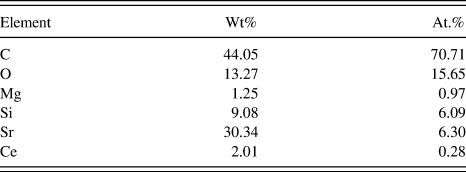
Figure 12 shows the morphologies of as-prepared Sr2−y MgSi2O7:yTb3+ phosphors and the EDS result of Sr1.97MgSi2O7:0.03 Tb3+ phosphors. With the increase of Tb3+, the morphologies do not change significantly as well as the phosphor morphologies of doping Ce3+. And the EDS spectrum of doped Tb3+ samples reveals that the powders consist of Sr, Mg, Si, O, Tb. The peak corresponding to C is also obtained in the spectra because of conductive adhesive. Table III lists the content of each element. It proves that Tb3+ have been successfully doped into Sr2MgSi2O7 host.
The FESEM images of Sr2−y MgSi2O7:yTb3+ phosphors with different doping concentration and EDS result of Sr1.97MgSi2O7:0.03 Tb3+ phosphors. (a) x = 0.01 (b) x = 0.03. (c) x = 0.05. (d) x = 0.07. (e) x = 0.09. (f) EDS result of Sr1.97MgSi2O7:0.03 Tb3+ phosphors.

Each element content of EDS result.
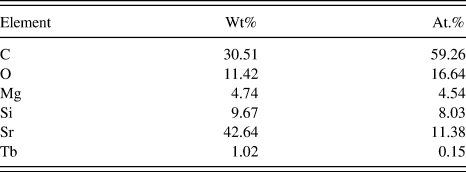
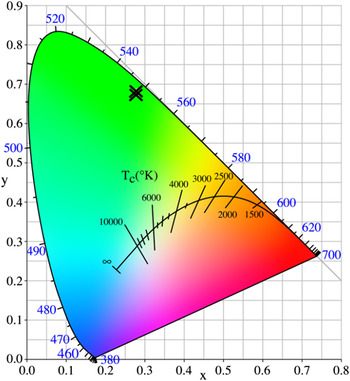
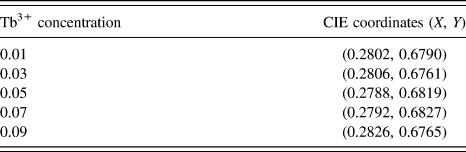
Figure 13 shows the CIE chromaticity coordinates diagram of Sr2−y MgSi2O7:yTb3+ (y = 0.01, 0.03, 0.05, 0.07, 0.09) phosphors. The chromaticity coordinates (X, Y) for Sr2−y MgSi2O7:yTb3+ phosphors are shown in Table IV. They are (0.2802, 0.6790), (0.2806, 0.6761), (0.2788, 0.6819), (0.2792, 0.6827), (0.2826, 0.6765), respectively. With increasing the concentration of Tb3+, the CIE chromaticity coordinate remains a steady position, which indicates doping concentration have little impact on emitting wave length shifts and CIE chromaticity coordinates are relative stable with the identical doping ions.
The CIE chromaticity coordinates diagram for Sr2−y MgSi2O7:yTb3+ (y = 0.01, 0.03, 0.05, 0.07, 0.09) phosphors.

CIE coordinates of Sr2−y MgSi2O7:yTb3+ samples.
IV. CONCLUSION
A series of alkaline-earth silicate Sr2−x MgSi2O7:xCe3+ and Sr2−y MgSi2O7:yTb3+ were prepared by a solid state reaction process. The crystal phase and structure were investigated in detail. The effects of [SiO4] tetrahedron and [MgO4] tetrahedron were analyzed. The polyhedral layers could play a role in shielding from the attack of oxygen. The emission wave length of red shift was also explained when increasing concentration of Ce3+. The augment of Ce3+ content enhanced the crystal field effect surrounding the Ce3+ and made the 5d energy level splitting. In addition, the influences of sintering temperature and sintering time on luminescence properties were discussed as well. The FESEM image of Sr1.99MgSi2O7:0.01Ce3+ indicates that it has a proper particle size for application in WLEDs. When doping Tb3+, the emission exhibited characteristic peaks derived from f–f transition of Tb3+. Finally, the result of Ce3+ and Tb3+ doping samples indicates that reasonable doping concentration is important to maintain the stability of crystal structure preventing from the degradation of luminescence properties. Based on these experimental results, the as-prepared Sr2−x MgSi2O7:xCe3+ and Sr2−yMgSi2O7:yTb3+ phosphors can act as potential wave length tunable phosphors and single-phase white light emitting phosphors for possible applications in WLEDs.
ACKNOWLEDGMENTS
This work was supported by Start high-level talent introduction of scientific research funds in 2016 (009–162301132613).