1 Introduction
The field of Authorship Analysis grew from roots in stylometry, aiming to answer problems of contested authorship in historical works (Mosteller and Wallace Reference Mosteller and Wallace1963; Holmes Reference Holmes1992, Reference Holmes1994). Authorship Analysis aims to extract details about the author of a document, such as attribution or profiling, from features found within the document. Modern machine learning algorithms have enabled a systematic and larger scale capability to process these features (Stamatatos Reference Stamatatos2009), improving the overall accuracy of Authorship Analysis tasks. These improvements have led to increases in the range of accurate authorship analyses, both in the number of studied authors (Luyckx and Daelemans Reference Luyckx and Daelemans2010), required length of documents (Layton, Watters and Dazeley Reference Layton, Watters and Dazeley2010) and difficulty of the domains (Juola Reference Juola2004).
The rise of cybercrime has led to a novel application of Authorship Analysis techniques (Zheng et al. Reference Zheng, Qin, Huang and Chen2003). The Internet has an inherent ability to allow anonymous communication, which has resulted in the prevalence of crimes such as identity theft (Turville, Yearwood and Miller Reference Turville, Yearwood and Miller2010), phishing (Moore and Clayton Reference Moore and Clayton2007) and the proliferation of malware (Alazab, Venkataraman and Watters Reference Alazab, Venkataraman and Watters2010). Level 1 attack attributionFootnote 1 of these attacks is possible in some circumstances. More resourceful attackers utilise techniques such as masking IP addresses, communicating through anonymous proxy gateways and spoofing email-sending addresses. These techniques are designed to make Level 1 attribution difficult, and to hamper investigative efforts (Radvanovsky Reference Radvanovsky2006). Level 2 attribution, in which the start of a causal chain is traced back through identifying communications between systems on the Internet, is also difficult. This has resulted in a need for Level 3 attack attribution, in which ‘causal relationships between observed data . . . and the human actor(s) responsible for that behaviour of activity’ (Cohen and Narayanaswamy Reference Cohen and Narayanaswamy2004, p. 52) are discovered and used to attribute the attack to a person. Authorship Analysis techniques have the ability to provide this level of attack attribution.
Apart from the use of anonymization techniques, another tool used by cybercriminals is automation. The cost to send a spam email is very low, and a positive response rate of less than 0.00001% can still result in a profit for the spammer (Kanich et al. Reference Kanich, Kreibich, Levchenko, Enright, Voelker, Paxson and Savage2008). Cybercriminals are leveraging automation to send these emails in bulk, as well as sending phishing emails, finding security holes in hosting platforms and even in managing money mules to ‘cashout’ once login credentials have been stolen (Aston et al. Reference Aston, McCombie, Reardon and Watters2009) and traded (Watters and McCombie Reference Watters and McCombie2011). This automation, combined with the power of increasingly large botnets, has enabled these crimes across the Internet at an alarming rate of growth. Despite advances in cybercrime automation, many of the countermeasures employed by those investigating and defending against these attacks remain manually driven (McCombie et al. Reference McCombie, Watters, Ng and Watson2008), including forensic investigation and site takedowns. Such manual approaches do not scale to the size and scope of distributed Internet-based attacks, providing another strong motivation for further automation in investigative tools.
A final problem in attack attribution on the Internet is the lack of valid real world datasets with known class labels of criminals responsible for particular attacks. This problem is caused by anonymity on the Internet; without valid provenance, datasets cannot be developed to assist with creating better attribution techniques. This suggests the need for techniques that are able to find patterns in unlabelled data, known as unsupervised learning. Authorship Analysis has a strong history of results in supervised learning, where (at least most) class values are known a priori. Techniques for Unsupervised Authorship Analysis (UAA), often referred to as similarity detection or authorship distinction, exist in the literature, but are often manually driven analysis methods such as visualisation tools (Abbasi and Chen Reference Abbasi and Chen2008). Given the above, we assert that there is an urgent demand for Authorship Analysis techniques that are both unsupervised and automatic. In this paper, we meet this demand by developing an automated and unsupervised methodology for clustering documents such that clusters correlate strongly to the actual authors of the documents and the algorithm is not provided with class values.
1.1 Research question
The Introduction highlighted an urgent need for automated and UAA techniques, driven largely by the issues of attack attribution on the Internet, and a lack of existing labelled data in cybercrime. This is a form of directed clustering where the aim of the cluster analysis is not to explore data or find relationships, as it is in many other applications. Instead, the aim is to use a combination of an adequate distance method and clustering algorithm to produce clusters, which correlate to a pre-existing goal, in this case the authorship of the documents. To achieve this, the choice of features is critical to the results. To address this problem, the research in this paper aims to answer the following research question:
Can an automated and unsupervised cluster analysis method cluster documents by authorship with a high correlation to true authorship?
In answering this research question, this research helps to address the demand for an automated and unsupervised method for Authorship Analysis. Applications of this technique could enable the Levels 3 and 4 attack attribution of cybercrimes on the Internet such as phishing, identify theft and malware.
1.2 Contributions
There are two major contributions made in this paper through answering the posed research question.
(1) The Iterative Positive Silhouette (IPS) method for determining where to cut a dendrogram described in Section 3.3, iteratively increasing the number of clusters until the median silhouette coefficient becomes negative.
(2) The automatic and unsupervised methodology, n-gram Unsupervised Automated Natural Cluster Ensemble (NUANCE), is proposed in Section 3 in which a set of documents is clustered by authorship.
1.3 Overview of paper
The rest of this paper is as follows. Existing literature in the field is outlined in Section 2, including automatic authorship attribution methods and UAA methods, as well as outlining typical cluster analysis methods. Section 3 describes the proposed algorithm using the Evidence Accumulation Clustering (EAC) ensemble method, with the proposed IPS method for dendrogram cutting. The testing methodology is outlined in Section 4, which is used to determine the correlation between the results of the proposed methodology and true authorship. Section 5 contains the results from the application of the testing methodology with Section 6 discussing the significance of these results. Finally, Section 7 provides conclusions on the experiments and results presented in this paper.
2 Related literature
The field of Authorship Analysis has four major sub-fields. The most studied is the sub-field of authorship attribution, which is the supervised task of assigning documents to an author, given a set of documents with known authors (Juola Reference Juola2008). The next sub-field is authorship profiling, which uses attributes of written documents to determine profiling information about the author such as gender, neuroticism and age (Argmamon et al. Reference Argmamon, Koppel, Pennebaker and Schler2009). The third sub-field is authorship verification, which is the single class classification problem of determining if a document was written by a single author (Koppel and Schler Reference Koppel and Schler2004). The final sub-field is authorship distinction,Footnote 2 which is the task of grouping documents by authorship when the author of none of those documents is known. It is this latter sub-field in which the contribution of this paper lies.
In this literature review, summaries of Authorship Analysis and cluster analysis techniques are given. Authorship attribution methods are described first. Local n-gram (LNG) methods are described afterwards, which have historically been used in supervised learning tasks, but are automatable methods for determining the distance between documents. This suggests applicability in solving the proposed research question. Existing methods for performing unsupervised Authorship Analysis are then outlined, but it is shown that these methods are not easily automated and generally not applicable to our task. A brief overview of cluster analysis methods is then given, being automatable and unsupervised methods of determining groupings of arbitrary objects.
2.1 Authorship attribution methods
Authorship attribution is the determination of authorship of a document where there are documents known to be authored by each candidate. This type of analysis can be performed as a classification task in machine learning in which features are derived from input documents and these features are used to determine the distance between the documents. How these features are determined separates much of the work in authorship attribution to date, although there is some crossover in approaches.
Much work in Authorship Analysis uses either statically chosen features or dynamically chosen features (Layton, Watters and Dazeley Reference Layton, Watters and Dazeley2011b). Static features are identified by the investigator, and may be refined using feature selection techniques. Examples include the mean sentence length and frequency of special characters in the text (Zheng et al. Reference Zheng, Li, Chen and Huang2005). Dynamic features are selected from the documents themselves according to a predefined model. Examples include the bag-of-words (BOW model and LNGs (Kešelj et al. Reference Kešelj, Peng, Cercone and Thomas2003). The focus of this research is on automatable methods, and for this reason dynamic features are preferred over static features.
Once features have been determined, a method for calculating distance is needed. In many cases this can be standard distance metrics such as the Euclidean distance, which is usable when the feature values are arranged as a vector. The distance between documents can be used as part of a classification algorithm (Mohtasseb and Ahmed Reference Mohtasseb and Ahmed2009), or using a simple ‘nearest author by distance’ method (Kešelj et al. Reference Kešelj, Peng, Cercone and Thomas2003). Another method for determining distance is a locally based method, where a profile is generated for each author. Those profiles are then used to calculate the distance between the given author and a document of unknown authorship. This type of profile is often performed using dynamically chosen n-gram-based models. These models have an advantage of being automated, with only two input parameters, the size of the n-gram and the number of n-grams to use. These methods are described in the next section.
2.2 Local n-gram methods
The study of character n-grams for Authorship Analysis has a long history (Cavnar Reference Cavnar1994), which has led to improved accuracy over other feature-based models (Kešelj et al. Reference Kešelj, Peng, Cercone and Thomas2003; Layton et al. Reference Layton, Watters and Dazeley2011b). For a sequence S containing tokens {s 1, s 2, . . . s N}, an n-gram is a subsequence {si, s i+1, . . . s i+(n−1)} and usually n ≪ N. For character level n-grams, the sequence is the characters of a document, with an n-gram being a subsequence of characters. For the previous sentence, the five first occurring character n-grams, when n = 3, are [For], [or ], [r c], [ ch] and [cha]. In some studies, formatting characters are removed, while in others they remain. This preprocessing can lead to improvements in some writing tasks, but the structural hints can provide authorship clues of use in classification tasks (Urvoy et al. Reference Urvoy, Chauveau, Filoche and Lavergne2008). The use of n-grams to detect authorship has been successful in many studies.
The LNG methods are a family of n-gram-based methods in which each author is profiled using a specific set of L n-grams that are considered specific to that author. In the Common n-grams (CNG) method, the L, the most frequently occurring n-grams in that author's known writings are used in the profile (Kešelj et al. Reference Kešelj, Peng, Cercone and Thomas2003). The distance between two profiles is then calculated using (1).
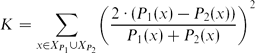 \begin{eqnarray}
K = \displaystyle\sum_{x \in X_{P_1} \cup X_{P_2}} \Biggl(\frac{2\cdot(P_1(x) - P_2(x))}{P_1(x) + P_2(x)}\Biggr)^2
\label{eq_keselj}
\end{eqnarray}
In the same way an author can be profiled using the above technique, and so can be a single document of unknown authorship. The distance between an author and a document pair is then calculated in the same way. CNG can therefore be used as a classification algorithm by first profiling each author using documents in the training set. Each document in the testing set is then assigned to the author profile with the smallest distance (Kešelj et al. Reference Kešelj, Peng, Cercone and Thomas2003).
The Source Code Author Profiling (SCAP) method is a simplification of the CNG algorithm shown to perform better than, or competitively with, CNG (Frantzeskou et al. Reference Frantzeskou, Stamatatos, Gritzalis and Chaski2007). A profile is generated in the same way as CNG, except that the frequencies of the n-grams are not needed. The similarity s(P 1, P 2) between profiles P 1 and P 2 is simply the percentage of n-grams occurring in P 1 that also occur in P 2. The distance between profiles is then simply 1 − s(P 1, P 2). Documents of unknown authorship are assigned to the nearest author profile as with the CNG method.
The Recentred Local Profiles (RLP) method is another variation on this theme; however, instead of the L most frequently occurring n-grams, the L most distinctive n-grams are used (Layton et al. Reference Layton, Watters and Dazeley2011b). To calculate distinctiveness, the mean frequency of each n-gram from the entire corpus is subtracted from the frequency for the n-gram in a particular author's writings. As an example, if the n-gram [th] appears with frequency 0.05 in the entire corpus and with frequency 0.04 in a particular author's writings, then the recentred value is −0.01. Different n-grams are then sorted using their absolute value, with the L n-grams with the highest absolute value used to profile an author (or document). The distance between n-grams is then calculated using (2):
 \begin{eqnarray}
s(P_1, P_2) = \displaystyle\sum_{x \in X_{P_1} \cup X_{P_2}}\frac{(P_1(x) - E(x))\cdot (P_2(x) - E(x))}{\|P_1(x) - E(x)\|\cdot \|P_2(x) - E(x)\|}
\label{eq_rlp}
\end{eqnarray}
Note that each of the above-mentioned methods is supervised when author profiles are used. Author profiles require at least some of the documents to have known authors, which are referred to as the training set. From this training set, author profiles can be created and then used to classify the documents of unknown authorship. Without known classes the methods can still be used to calculate the pairwise distance between documents, allowing their use in an unsupervised environment (Layton, Watters and Dazeley Reference Layton, Watters and Dazeley2011a).
2.3 Unsupervised authorship analysis
Unsupervised methods of clustering documents are not novel; however, methods in unsupervised Authorship Analysis are uncommon in the existing literature. The field of document clustering aims to cluster documents by finding topics inherent within the dataset (Steinbach, Karypis and Kumar Reference Steinbach, Karypis and Kumar2000). This is an unsupervised task which takes a word representation of the text, like the BOW model described earlier but with removed stop words and performed word stemming. It is also a form of exploratory analysis, where the topics are discovered through the analysis. UAA methods aim to produce clusters correlating to the authorship of the documents – not to discover but to model authorship. Methods for this are uncommon in the literature.
One existing method is Writeprints, a technique used for both classification and unsupervised visualisation (Li, Zheng and Chen Reference Li, Zheng and Chen2006). Writeprints uses the Karhunen–Loève (KL) transform from local profiles, related to the LNG methods described earlier. KL transforms are a supervised form of Principal Components Analysis (PCA), in which the vectors containing the most information about a dataset are extracted. This is useful for dimensionality reduction and allows the use of many features to create a Writeprint. Instead of n-gram models, a variety of features are used and the KL transform reduces this to two or three dimensions. This has proven useful for visualisation (Chen, Abbasi and Chen Reference Chen, Abbasi and Chen2010) and manual analysis of a set of documents (Abbasi and Chen Reference Abbasi and Chen2008). Writeprints have been shown to have high accuracy in many classification tasks; however, unsupervised applications to date have remained as a visualisation tool for manual analysis of a corpora.
Another related technique is that of anti-aliasing authors of posts on the web when the same person has posted online under two aliases. The method employed in this area uses the tf-idf algorithm on a model, and the Kullback–Leibler divergence as well as other features determine the similarity of two aliased documents (Novak, Raghavan and Tomkins Reference Novak, Raghavan and Tomkins2004). This method proved to be highly accurate in finding the expected match, when each of 100 authors' works from a single topic message board were split into two aliases. The technique even suggested actual aliases within the dataset which were previously unknown. These suggestions were investigated and evidence strongly indicates that the aliases are from the single author. This method of testing has some limitations: Clusters sizes are known and expected, allowing an algorithm to take the ‘best matching alias’, rather than trying to cluster documents into clusters of an unknown size. The technique was generalised to the clustering problem; however, the stopping criteria is still needed to be defined in order to obtain results, limiting its use in an automated system.
The research most similar to this is the work by Iqbal et al. (Reference Iqbal, Binsalleeh, Fung and Debbabi2010), who used cluster analysis in a corpus of unlabelled emails to guess authorship. This method used character, word, syntactic, structural and domain-specific features. A dataset was created from the values of each feature for each document and that dataset was used as input into any of the k-means algorithm, EM algorithm or bisecting k-means algorithm. Once this clustering was performed, the resulting clusters were then analysed using the Writeprints (Abbasi and Chen Reference Abbasi and Chen2008) technique, used earlier to discover patterns that lead to the creation of the cluster. The clustering algorithms chosen required an estimate of the number of clusters, which were chosen in these experiments as the number of authors in the dataset – the ‘correct’ value of k. This is not practical for a real world application, where the correct value is not (or cannot) be known a priori. The choice of a clustering algorithm that can be automated is an important one in this type of research as – without automation – insight into authorship cannot be inferred if the algorithm is heavily reliant on a known parametrisation. The next section investigates using clustering ensembles to eliminate parameters and allowing automation of the process.
2.4 Clustering ensembles
There exists a large number of clustering algorithms in the literature with various optimisations, generalisations and specialisations. Further to the number of clustering algorithms, there are also a large range of cluster ensembles that can be used to take the results of different clusterings and combine them to use the strengths of each algorithm. A full literature review of these algorithms is outside the scope of this research; readers are referred to Ghaemi et al. (Reference Ghaemi, Sulaiman, Ibrahim and Mustapha2009) and Xu and Wunsch II (Reference Xu and Wunsch2005) for surveys of this field. In order to be used in an automated methodology, a clustering algorithm must not need parameters to function. Further, as there are some parameters for any Authorship Analysis method, an ensemble methodology is needed to enable the ensembling of a wide variety of parameters. One methodology that has both of these attributes is called EAC.
Evidence Accumulation Clustering is a cluster ensembling algorithm which begins by using the k-means algorithm a large number of times on a dataset with a varying number of value for k (Fred and Jain Reference Fred and Jain2002). The resulting clusters are then used to form a co-association matrix C such that Ci, j is the percentage of iterations of the k-means algorithm which clustered instances i and j together. This is the ‘evidence accumulation’ of the algorithm; when items are clustered together more frequently, there is increased evidence that the items should be ultimately grouped together. This co-association matrix is then clustered using a hierarchical clustering algorithm to form a dendrogram Z that can then be ‘cut’ at a specific height to form the final labels. It has been shown that the cluster quality resulting from this method is significantly high (Duarte et al. Reference Duarte, Fred, Lourenço and Duarte2010).
The important factor in EAC is the remapping from the original distance space to a ‘co-association’ space. This technique has also been used in other ensembling methods with success (Parag and Elgammal Reference Parag and Elgammal2009). With the co-association matrix created, the standard EAC algorithm creates a dendrogram, which is then cut using the ‘cluster lifetime’ procedure to form a final flat clustering (Fred and Jain Reference Fred and Jain2002). This step can be replaced with any other clustering method. As an example, other research used a threshold cut-off to determine the final clusters after calculating the co-association matrix in the normal method (Gao, Zhu and Wang Reference Gao, Zhu and Wang2010). The choice of dendrogram cutting method is equivalent to the problem of choosing a method that determines flat clusters where the number of clusters is unknown. This is an unsolved problem in cluster analysis and therefore the choice of a dendrogram cutting method is possibly application-specific.
3 Proposed methodology
The methodology proposed in this paper combines the EAC algorithm from Fred and Jain (Reference Fred and Jain2002) with a new form of dendrogram cutting, i.e. IPS. This provides a methodology for the automatic and unsupervised clustering of documents by authorship. This methodology is named NUANCE for n-gram Unsupervised Automated Natural Cluster Ensemble.
The EAC algorithm was chosen as the basis of the research presented in this paper, as it has several benefits over other related methods. Firstly, it can be applied to datasets with an arbitrary number of actual clusters, both large and small. Randomly chosen values for k between 10 and 30 inclusive are used in the earlier work, but the final number of clusters does not depend on this choice (Fred and Jain Reference Fred and Jain2002). Secondly, with an appropriate dendrogram cutting method, the process can be fully automated, with no need for input parameters that are dependent on manual analysis of the dataset. Many algorithms require such parameters, on which the quality of the final clusters relies heavily. Thirdly, the algorithm is able to find clusters of any shape due to co-association mapping. While the k-means algorithm can only find convex shape clusters, the remapping of the instances from the initial vector, or distance space onto the co-association matrix, allows for arbitrarily shaped clusters (Fred and Jain Reference Fred and Jain2002). Finally, the ensemble nature of the algorithm allows for a mixture of methods to be considered as part of the single algorithm, rather than requiring a more complex cluster ensemble framework. A method for performing the EAC algorithm with multiple methods is given in this section.
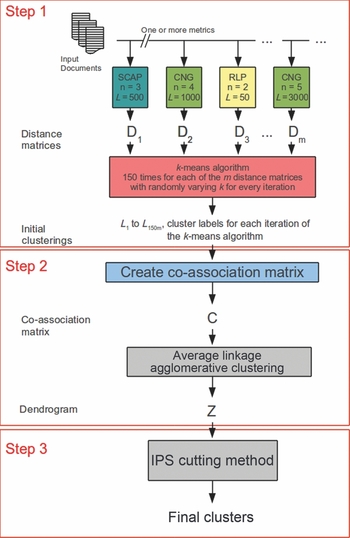
There are three major steps to the proposed methodology with an overview in Figure 1 and are outlined below:
Step 1. A set of documents is clustered using the k-means algorithm a large number of times, with a varying authorship distance methods and k values.
Step 2. The clusters resulting from Step 1 are used to create a co-association matrix C, which is then used to create a dendrogram Z using agglomerative average linkage.
Step 3. This dendrogram is then cut using the IPS method to form a definitive clustering of documents.
This methodology could be performed using the single authorship distance method, such as SCAP with n = 3 and L = 500, or a collection of such methods. The multiple authorship distance methods are used with different parameter values, and each resulting matrix is clustered multiple times using k-means in Step 1. The resulting clusters are then used as input to Step 2, and the methodology proceeds as in the case of a single distance method being used.
Proposed NUANCE methodology with optional ensembling of parameter sets.

3.1 Initial clustering
In Step 1 of the algorithm, a set of documents of unknown authorship is clustered using the k-means method with the procedure outlined by Fred and Jain (Reference Fred and Jain2002). The list of each of the labels from each run of the k-means algorithm forms the output of this step.
Clustering is achieved by calculating the distance between the document profiles created from each document by using the Authorship Analysis distance method. To use each of the three LNG techniques (RLP, SCAP and CNG) in an unsupervised setting, document profiles are created for each document and compared as document profiles (Layton et al. Reference Layton, Watters and Dazeley2011a). These methods are chosen because LNG techniques have been shown to produce high quality results in authorship attribution studies.
In the original EAC work, 150 runs of the k-means algorithm with k values randomly chosen from 10 to 30 inclusive were used (Fred and Jain Reference Fred and Jain2002). Our methodology uses the same value for the number of runs. For the value of k, some of the problems have less than ten (and more have less than thirty). With these bounds, documents will not be properly clustered and would leave each document to its own cluster in every run of k-means. The original work does not propose a solution to this problem and instead we suggest to proportionally separate the dataset into smaller datasets. The minimum possible number of clusters to be used in such an instance would be two, with the upper bound required to be at least one higher than this. This provides the lower bound for the range: [2, 3]. Further to this, a cluster should generally have more than one instance. For this reason, |D|/2 should be an upper limit to the number of clusters when the size of the corpus is low, where |D| is the number of documents. The lower bound needs to be less than this and we propose clusters with approximately double the number of instances per cluster (|D|/4). These subjective decisions led to the adjusted bounds [lower, upper] created by using (3) and (4),
 \begin{eqnarray}
\textit{lower} = maximum [minimum(|D|/4, 10), 2]
\label{eq_lower}
\end{eqnarray}
 \begin{eqnarray}
\textit{upper} = maximum [minimum(|D|/2, 30), \textit{lower} + 1]
\label{eq_upper}
\end{eqnarray}
The labels from each run of the k-means algorithm are used as the input into the next step, creating the co-association matrix C.
3.2 Dendrogram creation
In Step 2 of the proposed methodology, the results from the k-means runs are used to form a co-association matrix C, which is then used to create a dendrogram Z using agglomerative average linkage. The co-association matrix C is formed in the same way as in the previous EAC literature (Fred and Jain Reference Fred and Jain2002). The value of Ci, j is the normalised frequency of the number of times documents i and j were clustered together in all k-means runs. This value is higher if the documents are often clustered together and lower if they are rarely clustered together.
The resulting co-association matrix C is then used to create a dendrogram Z, using agglomerative average linkage. To create this dendrogram, each document is first put into its own cluster. The two nearest clusters are then combined recursively, creating a dendrogram. The distance between two clusters is given as the mean distance between all pairs of documents, with one document from each of the clusters. The choice of average linkage over the single linkage used in the previous work was based on using the cophenetic correlation, which measures the correlation between a distance matrix and the distance within the resulting dendrogram (Sokal and Rohlf Reference Sokal and Rohlf1962). The tested linkage methods were average, complete and weighted. The cophenetic distance was the highest for the average linkage in every single experiment included in this research and was therefore used in this research.
3.3 Dendrogram cutting using IPS
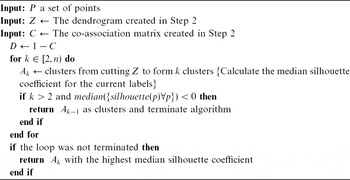
With the dendrogram Z created in Step 2, the dendrogram is cut according to the IPS method described in algorithm 1 to form a definitive flat clustering of documents. The IPS method works by iteratively creating more clusters until the median silhouette coefficient is below zero, indicating overlap in the clusters. Overlap in clusters is a sign of having too many clusters for a dataset. When the silhouette coefficient is found to be less than zero, the labels corresponding to k−1 clusters (the clusters from the previous iteration) are given as the final clusters.
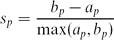
The silhouette coefficient is an unsupervised evaluation metric that measures the extent to which clusters are well-formed and well-separated (Rousseeuw Reference Rousseeuw1987). The silhouette coefficient for an instance p is calculated using the mean intra-cluster distance ap and the mean inter-cluster distance bp using (5):
 \begin{eqnarray}
s_p = \frac{b_p - a_p}{{\max}(a_p, b_p)}
\label{eq_sil}
\end{eqnarray}
The silhouette coefficient ranges between −1, which indicates incorrect clustering, and 1, which indicate well-formed and well-separated clusters (Rousseeuw Reference Rousseeuw1987). Values above zero indicate that clusters are non-overlapping, while values below zero indicate overlapping clusters. The silhouette coefficient has the key benefit of scoring lower for solutions with too many or too few clusters when compared with the ‘natural’ number of clusters. For a set of points, the silhouette coefficient is defined as the mean value of silhouette coefficients of each point in the set. As with any application of the mean as an average (Huber and Ronchetti Reference Huber and Ronchetti1981), outliers can cause problems using the mean silhouette coefficient. To address this issue, the median of the silhouette coefficients of each point is used to calculate the silhouette coefficient of a set of points.
The silhouette coefficient can be arbitrarily maximised when each instance is within its own clusters. However, when increasing the number of clusters by splitting clusters, as the above procedure does, the silhouette tends to start with a high value before decreasing as the number of clusters increases. This occurs because the separation of clusters is less justified as more clusters are increased (if it were more justified then that particular separation would occur earlier). Often, this decrease will see the silhouette coefficient drop below zero, as cluster separations become almost arbitrary and overlapping clusters become prevalent. After a sufficiently high number of clusters are used, the value increases to its maximum value. When the IPS algorithm terminates, clustering of documents returns. These clusters form the output of the proposed methodology with the aim of having the outputted clusters correlate strongly to the true authorship of the documents given as input in Step 1.
3.4 Parameter selection and ensembling
The proposed methodology determines the individual parameter sets that perform better for the testing corpora. However, this may not correlate to a truly automated and unsupervised environment, where V-measure results are unable to be calculated to select parameters. To overcome this, a method that uses related corpora to choose parameters was proposed and tested using the given corpora. The leave-one-out approach was used, where for each authorship problem the best performing parameters (decided by calculating the V-measure, Section 4.2) for the corpora excluding the given problem were calculated. These parameters were then chosen to be ensembled and evaluated on the excluded problem.
The ensembling procedure used the EAC algorithm as given in the previous section; however, each parameter set was clustered using k-means clustering 150 times and then each of these clusters are combined to create a single co-association matrix C. This co-association matrix was then used to create a dendrogram, using the procedure described in Section 2.4. The final dendrogram was then used to form a final clustering using the IPS method described in Algorithm 1.
Iterating Positive Silhouette (IPS) method for cutting a dendrogram

4 Testing methodology
The NUANCE methodology proposed in the previous section was tested to determine the strength of the correlation between the resulting clusters and true authorship. This strength was determined by comparing the results against a set of baseline scores and a probability distribution estimation. The evaluation metric used would be the V-measure, which gives a score based on the correlation between two sets of labels – in this case between clustering and actual author classes (Section 4.2). The baseline scores were taken from the standard methods used in the literature and used to produce distance matrices used for initial clustering in Step 1 of the NUANCE methodology rather than using LNG methods. The probability distribution estimation was performed by the Monte Carlo simulation. Together, these baselines were able to determine the strength of the NUANCE methodology.
The corpora used for testing was a set of nine English language authorship problems. The corpora were created by taking eight English problems from the AAAC corpus (Juola Reference Juola2004), and adding a new ninth corpus of English language books (Section 4.1). A variety of methods were tested on this corpora and evaluated using the V-measure (Section 4.2). The V-measure is a comparative score and is not easily translated across domains. For this reason, baseline scores for the V-measure in this domain were needed. To achieve this, the Monte Carlo simulation was run to provide estimates to the expected distribution of V-measure scores. This procedure has been outlined in Section 4.4 and has provided estimates as to the range of expected values, providing a target score for the tested methods.
Three baseline authorship methods were tested to provide further grounds for placing the V-measure results in context. These include the supervised form of RLP, which is an expected upper bound to the results. As supervised algorithms have access to a superset of information – data and training class values – it is expected that these produce better results than an unsupervised algorithm with access only to the data. Three other baselines methods are used – BOW, bag of n-grams (BOn) and feature subset combinations from Zheng et al. (Reference Zheng, Li, Chen and Huang2005) – to compare NUANCE against other methods in the literature.
With the baseline scores computed, the LNG methods (Section 2.2) were tested with a range of parameters (Section 3.1). These individual approaches were compared to evaluate the one more suited to UAA tasks. A clustering ensemble was then created, where the top performing authorship methods on the corpus using the leave-one-out approach were combined to provide a methodology for automatically clustering documents by authorship. This answers the research question posed in Section 1.2, providing the main outcome of this research.
4.1 Corpora
The corpora used for this research was derived from the AAAC corpus (Juola Reference Juola2004). The AAAC corpus is a corpora of documents taken from a variety of languages and contexts to provide a difficult set of problems for authorship studies. The problems used in this research were the problems in English only (problems A to H). These authorship problems are difficult, particularly problems A and F, which were considered difficult even by the creator of the data set (Juola Reference Juola2008). This suggests that finding authorship patterns in this corpus is unlikely to be due to chance.
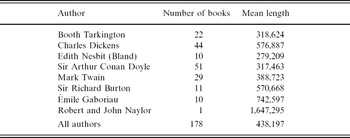
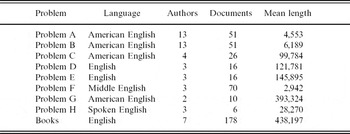
Further to the English problems from the AAAC, an additional problem consisting of a collection of books from the website of Project Gutenberg (Project Gutenberg Organisation 2011) was added to the corpus and is described in Table 1. The books were cleaned to remove Project Gutenberg's header and footer on each of the text versions of each of these books, but were otherwise left untouched. An overview of the corpus is given in Table 2, which shows the variety of the corpora not only in the mean length of the documents but also the size of each corpus ranging from six to 178 documents.
Overview of the books corpus

Description of each problem in the testing corpus. Final column is the mean number of characters per document in the corpus

4.2 Evaluation metric
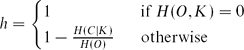
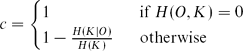
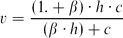
The V-measure score was used to evaluate the results of the experiments in this research. The V-measure is a supervised evaluation metric that evaluates how close a clustering solution is to the actual class values (Rosenberg and Hirschberg Reference Rosenberg and Hirschberg2007), and is related to the F-measure (Rijsbergen Reference Rijsbergen1979). The V-measure's main strength is that it allows for comparisons of scores when the number of clusters may vary (Rosenberg and Hirschberg Reference Rosenberg and Hirschberg2007). For class labels O and cluster labels K, the V-measure score is calculated using the homogeneity (h) and completeness (c) by (6) and (7), respectively. The homogeneity measures the extent to which clusters contain only instances from a single class, while the completeness measures the extent to which all instances of a single class are within a single cluster. Higher V-measure scores indicate a better correlation between the clustering solution and the actual class values. The score ranges from zero, indicating no correlation, to one, indicating an exact match. The V-measure for a given β value is then calculated using (8), where H is the entropy function,
 \begin{eqnarray}
h = \begin{cases}
1 & \text{if} H(O, K) = 0 \\
1 - \frac{H(C|K)}{H(O)} & \text{otherwise}
\end{cases}
\label{eq_homogeniety}
\end{eqnarray}
 \begin{eqnarray}
c =
\begin{cases}
1 & \text{if} H(O, K) = 0 \\
1 - \frac{H(K|O)}{H(K)} & \text{otherwise}
\end{cases}
\label{eq_completeness}
\end{eqnarray}
 \begin{eqnarray}
v = \frac{(1. + \beta)\cdot h \cdot c}{(\beta \cdot h) + c}
\label{eq_vmeasure}
\end{eqnarray}
 $\frac{|K|}{|O|}$ is proposed instead (Vlachos, Korhonen and Ghahramani Reference Vlachos, Korhonen and Ghahramani2009). This value for β was used in this research.
4.3 Baseline authorship techniques
Baseline comparisons techniques were used to determine both upper and lower bounds for the results from the proposed methodology. The upper bound was calculated by taking class predictions from an effective classification algorithm. The lower bounds were calculated by using standard baseline techniques in the authorship attribution literature and using these to calculate the distance between documents. This distance is then used for clustering in the first step of the NUANCE methodology. The clusters resulting from creating the resulting dendrogram and using an optimal cutting algorithm are then evaluated as the baselines. Three methods for performing lower bound estimates were tested, using BOW, BOn and feature subset combinations.
The upper bound estimation was performed by taking class predictions by applying RLP (Layton et al. Reference Layton, Watters and Dazeley2011b) to the corpora. In this application, the RLP author profiles were trained on all training documents in each problem. For the books' problems, there were no predefined training documents, therefore the dataset was split randomly into 90% training and 10% testing. The author profiles were then used to predict the class value of all documents by determining the ‘nearest author’. These predicted class values were then used as pseudo-clusterings and evaluated using the V-measure score. In this baseline, the RLP method was trained using the actual class values, and then used to predict the authorship of all training and testing documents. This over-fitting was expected to lead to much higher results than those obtained using an unsupervised method, and therefore formed the upper bound baseline.
For the lower bound baselines, three techniques used for comparison in the literature were used: BOW, BOn and the feature subsets from Zheng et al. (Reference Zheng, Li, Chen and Huang2005). The distance between documents was calculated by the first two steps of the proposed methodology applying each distance metric. The dendrogram resulting from the second step of the proposed method was then split using a supervised procedure to simulate an ‘optimal cut’. The resulting clusters were then evaluated using the V-measure to provide baseline scores. All three baselines have been shown to perform moderately well for authorship attribution in the previous literature. BOW and BOn are often used as benchmark scores (Raghavan, Kovashka and Mooney Reference Raghavan, Kovashka and Mooney2010). The feature subset scores perform well in classification methods and have been used extensively for authorship attribution (Abbasi and Chen Reference Abbasi and Chen2005; Zheng et al. Reference Zheng, Li, Chen and Huang2005; Iqbal et al. Reference Iqbal, Binsalleeh, Fung and Debbabi2010).
For the feature subsets, we use the first four subsets from Zheng et al. (Reference Zheng, Li, Chen and Huang2005): character, word, syntactic and structural features. Only incrementing subset combinations were used in Zheng et al. (Reference Zheng, Li, Chen and Huang2005)Footnote 3; however, all combinations of these subsets are used and reported. Syntactic and structural features have performed well in the past for classification on the AAAC corpus (Layton et al. Reference Layton, Watters and Dazeley2011b) and are expected to provide a reasonable baseline.
In each of the baselines, a vector is created for each document with values for each feature. For the BOW, the values are the normalised frequency of each word in the top L most frequent words in the dataset. For the BOn, the values are the normalised frequency of each n-gram in the top L most frequent words in the dataset. For the feature subsets, the values are the normalised valueFootnote 4 for each feature. Distance between documents in all baseline techniques was calculated using each of the Euclidean, cosine and correlation metrics. This distance metric was then used in the first step of the proposed method to calculate the distance between documents. After running the k-means algorithm and creating a co-association matrix C, a dendrogram was formed and cut to create clusterings.
One potential area for bias in these lower bound results was that any chosen dendrogram cutting method may not be optimal for that type of model and may not represent the accuracy of the model. For this reason, a near-optimal dendrogram cut was used instead of the proposed IPS cutting. This ensures that there is no bias in the results from the method of cutting the dendrogram. The resulting dendrogram for each metric was cut to create each possible number of clusters (from k = 2 to k = ||D||, the number of documents). The V-measures for all of these cuts were then calculated using the true authors and the highest scoring cut was chosen. This cutting method was supervised, removing the potential for bias in the chosen dendrogram cutting algorithm. Choosing the cut THAT maximises the V-measure also provided a higher baseline score for experiments.
4.4 Monte carlo distribution estimation
The baseline methods described in the previous section provided an expected upper and lower bounds for the resulting V-measure score. The score resulting from NUANCE was reasonably expected to be within those bounds. Despite this, a method for estimating the overall strength of a score within those bounds was needed. To estimate this strength, the Monte Carlo simulation on V-measure scores was performed to estimate the distribution of V-measure scores on the given corpora. That distribution was then used to provide estimated p-values for the results obtained using the proposed methodology.
The tests reported in this paper were evaluated using the V-measure score, which is the supervised metric evaluating the level of correlation between clusters and classes (Section 4.2). While the V-measure score has been reliably shown to be effective for comparing methods in domains, there is no clear way to transfer results from one domain to another. The theoretical limits of the V-measure are 0 to 1 inclusive; however, results such as these in practice are rarely seen. For this reason, the Monte Carlo simulation was used to estimate the distribution of V-measure scores.
To simulate the distribution, a large number of pseudo-clusters were generated and the resulting V-measure score was used to estimate the distribution of possible V-measure scores. The pseudo-clusters were created by first taking the actual classes from each authorship problem and iterating through each class value. For each class value, noise was added with a probability of 50%. If noise was added, the value was changed to a random value up to |O|, the number of classes. This created randomness in the resulting labels while maintaining a similar number of clusters to the actual classes. The V-measure score was then calculated for this iteration and the procedure was repeated 100,000 times. The distribution of V-measure scores over all iterations was used as the distribution estimation. From this distribution estimate, the expected value (mean) was calculated along with probability values for estimating the likelihood that random clustering is as good as a given result. These are given as p-values in the results, although it should be noted that these are estimated values and not actual p-values for the given tests.
4.5 Testing parameters
The proposed methodology was tested using the three LNG methods described in Section 2.2: CNG, SCAP and RLP. For each of these methods, there were two parameters n and L which take varying parameters. The first was n, the size of the n-grams to extract, and the second was L, the number of n-grams to use to profile a document or author. Values for n tested were 2 to 5 inclusive, while values for L were 50, 100, 500, 1,000, 2,000, 3,000, 5,000, 7,500 and 10,000. Each combination of n and L values was tested by itself in our experiments, giving thirty-six combinations for each of the three methods (RLP, CNG and SCAP). These values were chosen from the literature on each of the three algorithms to give a wide range of values.
Further to individual parameter sets, an ensemble was performed using all parameter sets. The parameter selection used was the leave-one-out ensemble (Section 3.4). In the leave-one-out method all but one authorship problem in the corpus was used to select the highest scoring parameter sets, using the V-measure to evaluate. The top five parameter sets were chosen from each of the 108 parameter sets as described above. Those parameter sets were then ensembled, combined together to form the co-association matrix C in the first step of the proposed methodology. This ensemble aimed to combine the results from each parameter set, overcoming noise that may occur through the use of just a single parameter set. It was expected that the ensemble would achieve higher results than any individual parameter set by itself. More importantly, this provides an automated method for choosing parameters without the known class values for a given authorship problem. Using other corpora to choose parameter sets for a new corpus provides a means for automatic and unsupervised clustering of documents by authorship.
5 Results
The methodology described in the previous section was applied and the results are given in this section. The results for the baseline comparison, including the Monte Carlo simulation, are given first. This is followed by the results from each of the individual parameters and the results from the automatic leave-one-out ensemble.
5.1 Baseline results
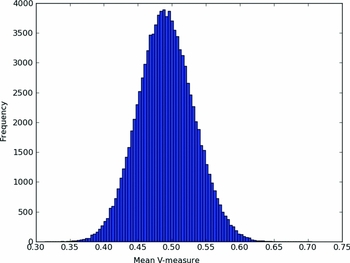
The Monte Carlo simulation was run according to the methodology given in Section 4.4 and the expected value (mean) of the V-measure was 0.4910. The distribution is graphed in Figure 2, showing a bell shape curve and normal distribution. The V-measure scores for p-values of 0.01, 0.02, 0.05 and 0.1 are 0.5884, 0.5770, 0.5597 and 0.5441, respectively.
Monte Carlo simulation for V-measure distribution.

The classification baseline V-measure score was tested using the RLP algorithm for all of the parameter values given in Section 4.3. The highest scoring set of parameters occurred when n = 2 and L = 500, which gave a V-measure score of 0.8016. Values for L above this did not alter the score, and it was shown by Layton et al. (Reference Layton, Watters and Dazeley2011b) that increasing features produces a diminishing effect on the results. This is also evident in these results, where the score changes more slowly as newer features are added.
The BOW baseline was tested using L values of 50, 100 and 500, and found that an L value of 50 gave the highest V-measure score of 0.5502, slightly above the p = 0.1 value. The BOn baseline was tested using the same parameters for n and L as the individual parameter sets described in Section 4.5 for LNG, along with three vector distance metrics: Euclidean, cosine and correlation. The highest score was obtained for n = 3 and L = 3,000, which was 0.5752 using the cosine distance metric. This result was above the p = 0.05 estimation from the Monte Carlo simulation.
The best scoring feature subset combination was the Character and Syntactic subset combination using the cosine distance metric, scoring 0.4422. Another noteworthy result is the score for the combination of all features, which was just 0.1435. This result shows the danger of adding unrelated features in an unsupervised environment, and that features must be chosen carefully to achieve an outcome in directed clustering.
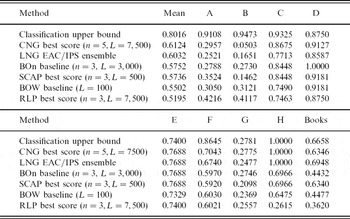
These baseline scores are summarised in Table 5 along with the results of other experiments. These results were obtained using the supervised cutting of dendrogram to maximise V-measure scores and as such the results might not be achievable in a truly unsupervised setting. It does, however, provide a baseline for the results in the next section.
5.2 Individual parameters
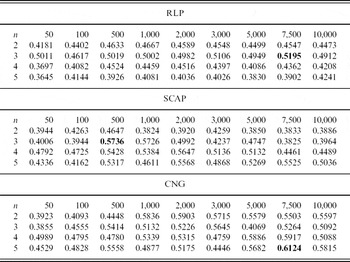
The V-measure scores for each of the parameter combinations (method, n, L) are given in Table 3. These results were obtained using the IPS dendrogram cutting described in Algorithm 1 with EAC. These results were fully automated and unsupervised, compared with optimal cut described in the previous section. However, it can be seen in the table that the results from using the SCAP and CNG methods outperformed BOW, with the CNG method also outperforming BOn. RLP did not perform well in an unsupervised setting, suggesting that methods that work better for classification tasks do not necessarily perform better for clustering tasks.
Individual parameter V-measure scores using the IPS method

The highest scoring combination was using the CNG method with n = 5 and L = 7,500, scoring 0.6124. This value was above the p = 0.01 score approximated using the Monte Carlo distribution and was well above the baseline comparison scores, excluding the classification baseline score. The highest scoring SCAP method scored 0.5736 for n = 3 and L = 500, which was higher than the p = 0.05 approximation.
5.3 Ensemble results
The NUANCE methodology was performed using the leave-one-out training with the IPS method for splitting the dendrogram created using the EAC algorithm. The top five methods were chosen and ensembled using the procedure described in Section 2.4. The results are given in Table 4, as each corpus was withheld from training and used only for testing. The overall mean score for each problem was 0.6032, which was above the p = 0.01 estimation using the Monte Carlo simulation. It was also the second highest V-measure achieved through clustering, with only CNG achieving a higher score (for n = 5, L = 7,500). The ensemble, however, was automated through the section of parameters and would be applicable in other domains. This result gives the significance of correlation between NUANCE and shows the efficacy of the approach.
Details of results using the IPS method and the leave-one-out ensemble. First column is the mean result

6 Discussion
The ensemble results produced scores that were generally (with one exception) higher than any individual parameter set that was obtained. A comparison of noteworthy scores from all experiments was given in Table 5. By ensembling the top five scoring parameter sets on related authorship problems, very high results were achieved in clustering documents by authorship on a new problem. The ensemble score was above the p = 0.01 value estimated by the Monte Carlo simulation (0.5884) and well above the baseline scores. The best scoring BOW score was 0.5502, while the best BOn score was 0.5752, using the supervised V-measure maximising dendrogram cutting method. The score achieved with the ensemble was higher than this rate despite being completely automated and unsupervised.
Comparison of results from different methodologies and baselines ordered from the highest to the lowest scoring method.

For all excluded problems in the ensembling experiment, CNG was chosen for all parameter sets, indicating strongly that this method performs best in an unsupervised setting. CNG was shown to be significantly better than SCAP (improvement of 0.048, p = 0.001) and RLP (improvement 0.07, p < 0.001). SCAP was also shown to be better than RLP, but not significantly so (improvement of 0.022, p = 0.119).Footnote 5 On comparing these results with comparisons in classification tasks on similar problems (Layton et al. Reference Layton, Watters and Dazeley2011b), the classification results were found to be directly opposite. In that work, RLP performed better than SCAP, which in turn performed better than CNG. This result indicates that techniques that are effective for classification may not be necessarily good for clustering.
The top performing methods for each excluded problem were also the same, each using CNG. The order altered between each excluded problem; however, the top five remained consistent. The parameters for CNG in the top five were n = 3, L = 3,000; n = 4, L = 5,000; n = 4, L = 7,500; n = 5, L = 7,500 and n = 5, L = 10,000.
A surprising result in Table 5 is that, for some authorship problems, the unsupervised method did better than the supervised method. There is a chance of parameter dredging being the cause of this result – if enough experiments are performed, then there will be surprising results. However, the result does indicate that it is possible for an unsupervised method to approach and even surpass a supervised method in producing clusters of authorship. Whether this scenario is realistic without such a large number of experiments remain to be tested in future work. Further to this result, only problems A, B and F showed any significant difference in results between unsupervised and supervised methods. The other unsupervised results were comparable to the supervised RLP performance.
7 Conclusions
In this work, a methodology for automatically clustering of documents by authorship was proposed, a directed form of cluster analysis aiming to achieve a stated goal (as opposed to exploratory analysis). The proposed methodology was named NUANCE, which produced clusters with a significant correlation to true authorship. NUANCE used a number of LNG-based methods to cluster documents by authorship. It was found that CNG was selected for every corpus under training in the leave-one-out ensemble. Document profiles were created using the authorship distance methods and were clustered using a modified version of the EAC algorithm. In this algorithm, the documents were clustered for multiple times using the k-means algorithm to form a co-association matrix C. This matrix was then used to create a dendrogram using average linkage. The dendrogram was cut using the proposed IPS dendrogram cutting, which iteratively increased the number of clusters formed by the cut until the silhouette coefficient dropped below zero, indicating that too many clusters were formed. The previous cut was then chosen to form the final clustering of documents.
Using the leave-one-out approach to parameter selection, it was found that CNG outperformed both RLP and SCAP. The best performing distance methods using this approach were used as part of an ensemble to cluster the documents by authorship. This methodology was shown to produce clusters with a high correlation to the actual authorship properties of the problem indicated by the V-measure score. The results obtained were better than the p = 0.01 estimation using the Monte Carlo simulation used in the testing methodology to estimate the distribution of the V-measure score on this problem.
The main contribution of this research is the NUANCE methodology for clustering documents by authorship. This methodology, using EAC for dendrogram creation and IPS for dendrogram cutting, was able to produce clusters with a high correlation to true authorship using a corpus that the creator described as containing ‘difficult problems’. This is the first automated and unsupervised Authorship Analysis technique that produces clusters with a significant correlation to true authorship. With these contributions, the research question posed in Section 1.1 has been answered, with the given methodology being both automated and unsupervised. The Monte Carlo simulation showed that the correlation to true authorship is high through the estimation of p-values. The results are better than the estimated p = 0.01 scores and baseline BOW and BOn scores, suggesting that a strong correlation highly unlikely to have arisen by chance.
NUANCE has applications in cybercrime investigations. An investigator, either a researcher or a law enforcement agency, could use the proposed technique to investigate authorship patterns in a corpus of documents. An example is phishing attacks, which is thought to be operated by relatively large phishing ‘gangs’. By applying Authorship Analysis to a corpus of phishing attacks, the size and scope of these different gangs could be determined. This would allow an investigator to focus on a single group rather than trying to collect evidence from either a single attack or multiple attacks that may be from different sources.
Future research in this field could work on improving the correlation between authorship and clusters. One method for this would be to test different ensembling algorithms to see if some methods are able to find higher quality clusters. Another method could focus on the distance metrics used by profiling the languages to determine metrics or parameter values that improve upon those used in this research. Preprocessing methods could also be used to focus on traits of authorship that may have been lost in editing, translation or other causes of authorship-related noise.
Acknowledgment
This research was conducted at the Internet Commerce Security Laboratory and was funded by the State Government of Victoria, IBM, Westpac, the Australian Federal Police and the University of Ballarat. More information can be found at http://www.icsl.com.au