Introduction and background
Classical electroporation implies the application of controlled pulsed direct current/electric field in the milli-to-micro second (ms–μs) regime to cells and tissues. The applied electric field pulses are known to result in increased plasma membrane permeabilization thus enabling the introduction of small molecules and modulation of cell viability [Reference Sundararajan1–Reference Kotnik, Kramar, Pucihar, Miklavčič and Tarek6]. Using suitable protocols, electroporation has been successfully exploited as a medical ablation technique intraoperatively, laparoscopically, and percutaneously [Reference Sundararajan1–Reference Kotnik, Kramar, Pucihar, Miklavčič and Tarek6].
Nanosecond electroporation (using high-voltage pulses with a width of a few nanoseconds up to a few hundred nanoseconds) is a further development of the classical electroporation. Literature suggests it has additional potentials for cell manipulation and control of cell physiology [3]. Nanosecond-pulse effects include calcium (Ca++) release, ion channels activation, and apoptosis induction [3, Reference Denzi, Merla, Caramazza, De Angelis, Apollonio and Liberti7–Reference Botha, Lopez, Muscat, Lucía, Sarnago, Naval, Burdio, García-Sánchez, Mir and Andre10].
Ablation of cancer tissue using nanosecond-pulsed electric fields has been demonstrated. In some cases, this technique resulted in complete tumor remission [Reference Schoenbach, Nuccitelli and Beebe11–Reference Krishnaswamy, Kuthi, Vernier and Gundersen17]. Furthermore, this treatment strategy stimulates the immune system thus determining an immunogenic cell death. The activation of the immune system prevented tumor regrowth when a second cancer cell injection was conducted in xenograft in vivo models [Reference Nuccitelli, Pliquett, Chen, Ford, James Swanson, Beebe, Kolb and Schoenbach12–Reference Skeate, Da Silva, Chavez-Juan, Anand, Nuccitelli and Kast15].
Nanosecond-pulsed electric field could be additionally interesting for the treatment of cancer stem cells (CSCs) [Reference Davies, Merla, Zambott, Bishop, Palego and Hancock18]. Primary cancers, such as medulloblastoma (MB), are extremely challenging to treat with conventional therapies (i.e. chemotherapy and radiotherapy) and this has been linked to the presence of CSCs [Reference Sundararajan1, 19–21]. Unlike normal cancer cells, CSCs possess stem-cell like properties and the ability to recover from cytotoxicity, leading to tumor initiation, invasion, and relapse [Reference Sundararajan1, 22, 23].
In 2014, approximately 11 000 people were diagnosed with primary brain tumor in the UK with a median survival rate of 15 months and a 5-year survival rate of ~4% [19, 20]. Therefore, there is a crucial need for an alternative therapeutic treatment to eradicate or selectively neutralize CSCs, which may well require the development of a compact low-cost nanosecond-pulsed electric field generator.
Advancement of semiconductor technology, particularly silicon carbide (SiC) has made possible to develop a cost-effective (<£350) compact (99 mm × 254 mm × 244 mm) nanosecond-pulsed electric field generator which utilizes off-the-shelf components to match the performance once achieved by much bulkier and more expensive technologies [24–30]. In this paper, a new generator is presented (“Materials and methods”) and its realization is described together with experimental characterization (“Result and analysis”). In vitro investigation of MB cell line permeabilization and viability were carried out to test the performance of the new generator in operational conditions (“Result and analysis”). Specifically, a D283 MB cell line rich in MB CSCs in a 50 Ω buffer solution [Reference Gong, Valduga, Chateau, Richard, Pellegrini-Moïse, Barberi-Heyob, Chastagner and Boura31] was treated using an electric field amplitude of 1 MV/m, and pulse widths extending from 100 to 300 ns.
Materials and methods
Micro-millisecond pulse generators capable of producing electric field strengths up to 100 kV/mm are available commercially [24–26]. In comparison to micro-millisecond pulse generators, there are significantly fewer high-voltage nanosecond-pulsed electric field generators available commercially [27–30]. In recent years, there have been numerous developments of nanosecond high-voltage pulsed electric field generators within the research field, with over 500 citations since 2017 on Google Scholar [32].
Traditionally, coaxial transmission line-based implementations, such as Blumlein, in correlation with spark-gap, Marx bank, or diode opening switch techniques have been used to generate high-voltage nanosecond pulses [Reference Behrend, Kuthi, Gu, Vernier, Marcu, Craft and Gundersen33–Reference Sanders, Kuthi, Wu, Vernier and Gundersen36]. These techniques can produce pulses with very high amplitude (voltages in excess of 5 kV), short durations (widths varying from 1 to 300 ns), with fast rise time (<2 ns). Yet there is complexity associated with these designs.
In recent years, the use of power modules, such as Metal Oxide Semiconductor Field Effect Transistors (MOSFETs), Insulated-Gate Bipolar Transistors (IGBTs), and Bipolar Junction Transistors (BJTs) has been demonstrated in the literature as a method to produce high-voltage nanosecond pulses in various pulse generator designs. Designs include MOSFET or IGBT stacking (series, parallel, or crowbar design), solid-state Marx bank, capacitor array methodology, etc., or a combination of these methodologies [Reference Behrend, Kuthi, Gu, Vernier, Marcu, Craft and Gundersen33–Reference Reberšek and Miklavčič38]. Table 1 summarizes the advantages and disadvantages of the various technologies in producing nanosecond electric pulses.
Summary of the comparative performance between the various techniques for producing nanosecond electric pulses

The requirement for these developed nanosecond electric pulse generators is to produce pulses with a duration of 100–300 ns with amplitudes in excess of 1 kV, into a 50 Ω load, whilst being cost-effective. From Table 1, it is concluded that utilizing MOSFETs, IGBTs, or BJTs is the practical choice to deliver the nanosecond-pulse generator requirement.
With the latest advancements in semiconductor and SiC material technology, recent power components can deliver voltage pulses in excess of 1.7 kV with pulse widths in the sub-microsecond regime. Comparing commercially available MOSFETs, IGBTs, and BJTs, MOSFET technology is the most suited semiconductor technology for this nanosecond electric pulse generator design. MOSFETs unlike IGBTs and BJTs are cheaper and can produce pulses within the 100–300 ns regime with transition times (rise and fall time) faster than 100 ns, although all three have breakdown voltages (collector–emitter or drain–source voltage) in excess of 1 kV. The comparison between MOSFET, IGBT, and BJT is summarized in Table 2 when comparing a typical commercial component available on the market (uk.rs-online.com).
Comparing MOSFET, IGBT, and BJT typical parameters with existing product

These features, in Table 2, make MOSFETs configured in a push–pull configuration an attractive option for the design of a compact and cost-efficient nanosecond-pulsed electric field generator that meets the design requirement. Implementing the other techniques of producing nanosecond electric pulses, highlighted in Table 1 and 2, would be significantly less cost-effective and efficient with the additional complexity in their design.
In the following work, our modular design is presented along with its numerical and experimental characterization. The biological results obtained using the generator indicate that this compact, cost-efficient approach has a strong potential for clinical application.
Nanosecond-pulse generator modular design
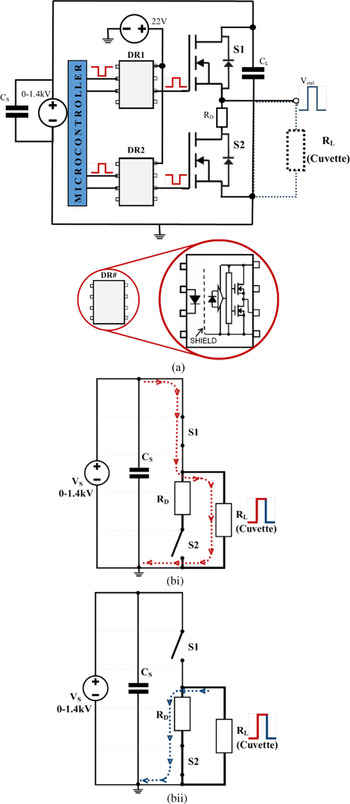
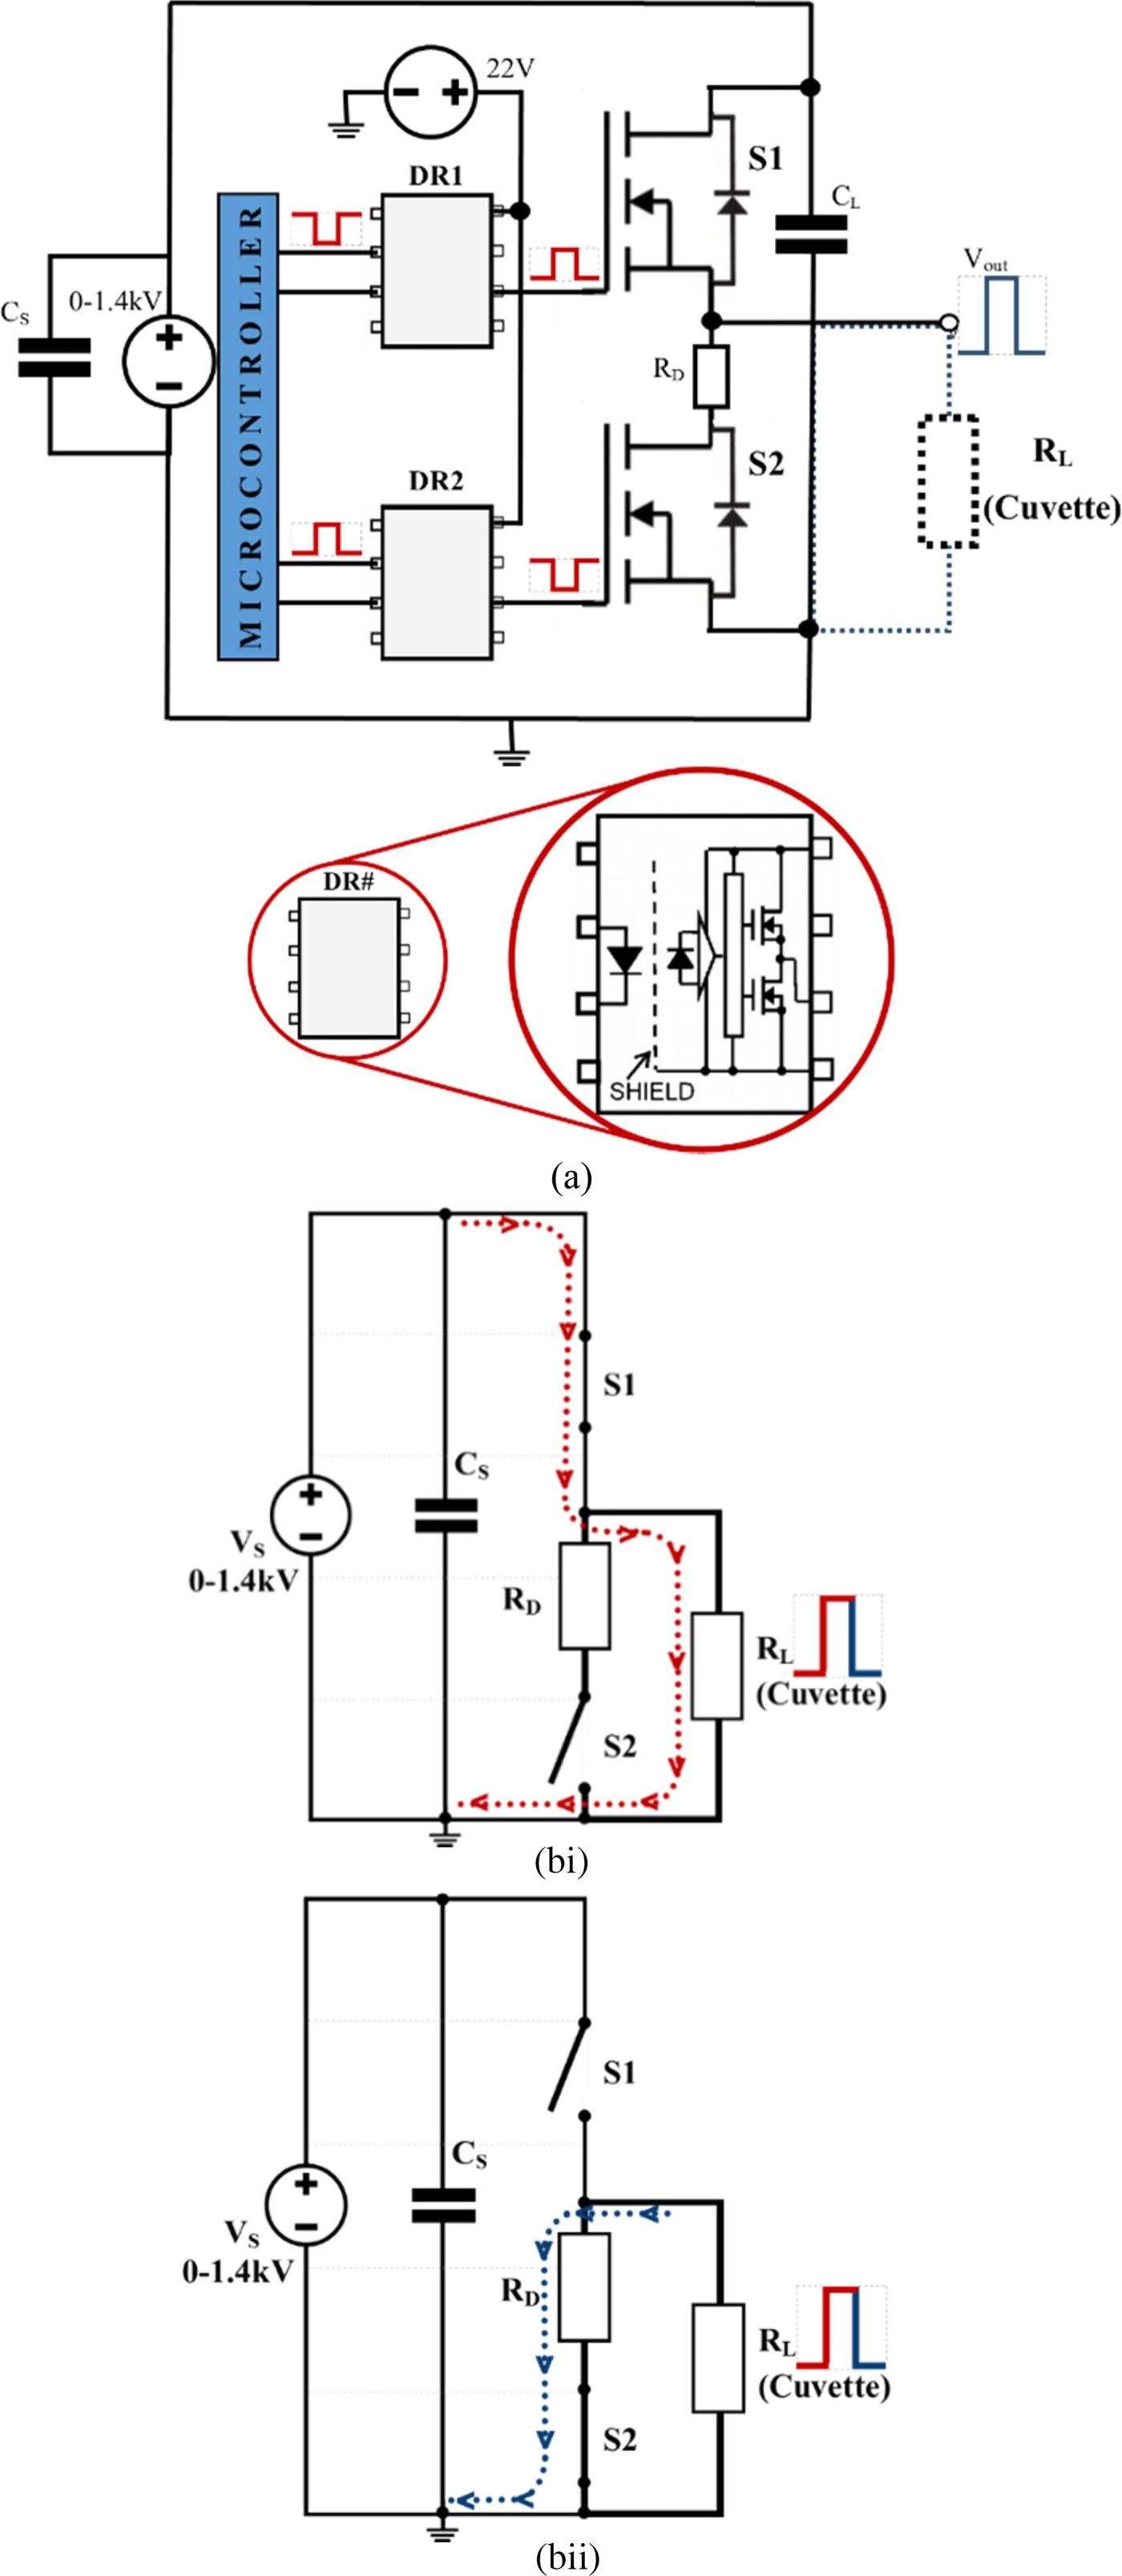
The modular design is based on a push–pull switch configuration of two Wolfspeed's C2M1000170D SiC MOSFET (S1 and S2 in Fig. 1) [39] that are directly driven by Toshiba's TLP352 photocoupler (DR1 and DR2 in Fig. 1(a)) [42]. The ability of the design to generate the required pulses is dependent upon the switching times and maximum drain–source voltage of the MOSFETs. The SiC MOSFETs are voltage-controlled semiconductor devices that efficiently store charge in their minority carrier region resulting in a very rapid turn-on (t r) and turn-off (t f) times.
The basic modular design of the developed nanosecond generator (a) simplified schematic. Note: DR1 and DR2 circuits have been simplified for graphical clarity. (b) Simplified equivalent circuit of the generator showing the current path when: (i) S1 is closed and S2 open; (ii) S1 is open and S2 is closed.
For this application, it was important to choose a power MOSFET with a maximum drain–source voltage >1 kV and total switching times below 100 ns (the actual values are: t r = 10.5 ns and t f = 60 ns [39]) to generate an electrical pulse of 100 ns duration with amplitudes in excess of 1 kV, into a 50 Ω load. An n-channel enhancement-type MOSFET device was used, where a positive gate–source voltage (V gs) opens up the channel to control the drain current (i D). The transconductance characteristic (i D as a function of V gs) was also considered carefully when choosing the most appropriate MOSFET to use.
Selecting a push–pull configuration of MOSFETs over the conventional transmission line-based design or other alternatives for generating nanosecond electric pulses provides numerous advantages (Tables 1 and 2). In addition of being compact and cost-effective, this design provides a more controllable method of delivering various nanosecond electric pulses, such as pulse widths, repetition frequency, number of pulses, and pulse amplitude, in comparison to other techniques mentioned. These aspects of using power MOSFETs are advantageous for the usage of a well-controlled electro-manipulation technique while supporting further nanosecond-pulse-based applications and research in biology, medicine, and/or biotechnology.
An input capacitance (C input) of around 200 pF exists between the gate and the channel [42–Reference Kogure, Kobayashi, Takahashi, Myono, Sato, Kimura, Onaya and Tanaka45]. This capacitance must be charged when the device is turned on and discharged when it is turned off. The charge and discharge times must be as short as possible. A gate driver is therefore necessary to provide enough current to charge this capacitance for the necessary V gs to appear across the gate–source terminals, to enable the required i D flow. The total gate capacitance (C gate) is made up of the gate–source capacitance (C gs) and the gate–drain capacitance (C gd) as the current required to charge up this capacitance (i c) is given:
 $$C_{gate} = C_{input} = \lpar {C_{gs} + C_{gd}\lpar {1 + g_mR_L} \rpar } \rpar ,$$
 $$i_c = C_{gate}\displaystyle{{dV_{gs}} \over {dt}}.$$
where g m is the transconductance  $\left( {\displaystyle{{di_D} \over {dV_{gs}}}} \right)$ of the MOSFET and R L is the load impedance. In this work, R L is 50 Ω, representing the standard commercial impedance of cables and connectors necessary to link the generator to the biological load.
The selected opto-couplers (DR1 and DR2) operate as a gate driver, which provides the necessary current (2.5 A max) to charge and discharge the C gs and C gd [Reference Boylestad, Nashelsky and Li43–Reference Kogure, Kobayashi, Takahashi, Myono, Sato, Kimura, Onaya and Tanaka45].
The power MOSFET was chosen based on the fastest possible switching times, which in turn are determined by the charging and discharging times of C gs and C gd (mentioned above).
If a single MOSFET is used to generate the sub-microsecond high-voltage pulses at a load, then the gate–source capacitance of the MOSFET has to be charged and discharged resulting in unacceptably long switching times. This is particularly true for the discharge of the input capacitance necessary to switch the pulse off. The fall-time of the pulse is dictated by the discharge time constant of the gate–source capacitance of the MOSFET and is dependent on the gate–source capacitance and load resistance (t f = τ = C gs R L).
To overcome this problem, two MOSFETs can be used in a push–pull configuration, as shown in Fig. 1(a). This switching topology means that when the high-side MOSFET (S1) is open (“off”) the low-side MOSFET (S2) is closed (“on”), and vice versa. The relationship between the two-gate driver signals to the MOSFET switches is synchronized and complementary to one another.
The simplified equivalent circuit of the nanosecond generator is illustrated in Fig. 1(bi) and 1(bii). When S1 (the high-side MOSFET) is turned on, a high-voltage is applied to the load. The current flow (red dotted line), for this action, is shown in Fig. 1(bi). In addition, applying high-voltage to the load, S1 determines the pulse duration (width) and rise time at the load.
When S1 is turned off, S2 is turned on. This creates a second path for the current to flow (blue dotted line) (Fig. 1(bii)). The switching of S2 creates a low impedance path, which allows the high-voltage pulse delivered at the load to discharge to ground. Thus, S2 controls the pulse fall time at the load.
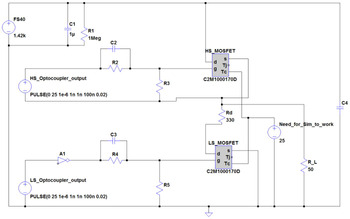
The R D resistor in Figs 1 and 3 protects the circuit from a failure/open control signal, ensuring a pull-down of the gate signal of the high-side MOSFET (S1), turning S1 off, and that the pulse seen at the load is grounded (0 V) and not floating (>0 V). R 3 and R 5, in Fig. 3, provide similar modality to R D, but they ensure pull-down of the gate driving signals to S1 and S2 from there respected photocoupler (DR1 and DR2).
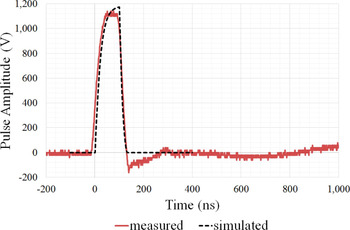
Implementing a push–pull configuration results in a faster fall-time than is possible for a single MOSFET implementation and leads to a square-shaped, symmetrical pulsed electric field at the load (Fig. 2).
A 100 ns pulse obtained by LTSpice simulation (black dashed line) and measured from the developed generator (red solid curve) with a 50 Ω load.

It is imperative that both S1 and S2 are not switched “on” simultaneously. In such an event, no pulse would be measured across the load as the voltage from the power supply would be grounded through a direct low impedance path to ground. This circumstance could result in shorting of the power supply and a potential temperature rise or breakdown of MOSFETs due to the high-voltage swing (1.4 kV) in a low-impedance pattern.
Simulated versus measured performances
Following the development of the nanosecond pulsed electric field generator, an LTSpice model of the modular design was developed as shown in Fig. 3. The simulated design utilized the PSpice model of the C2M1000170D SiC MOSFET obtained from Wolfspeed's website [46].
LTSpice simulation circuit diagram, with spice model of Wolfspeed's MOSFETs [Reference Boylestad, Nashelsky and Li43].

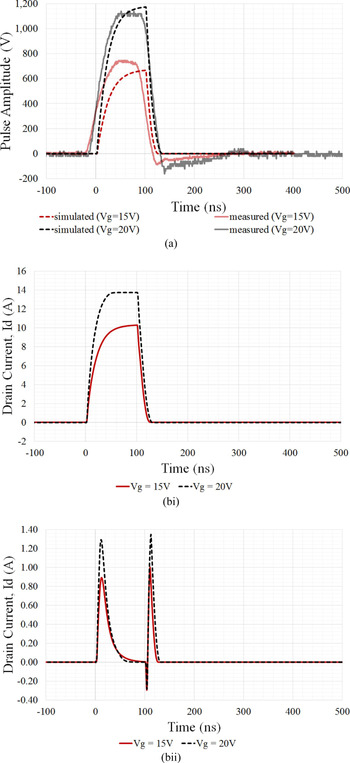
Figure 4(a) demonstrates that the actual generator performance exceeds LTSpice simulation. It can be seen that the measured pulse across a 50 Ω resistive load, in practice, is more symmetrical and has a faster risetime than the simulated pulse. This could be the result of a higher gate current in practice, thus, resulting in faster charging of the internal gate capacitance.
(a) Measured (solid lines) versus LTSpice simulation results (dashed lines) for 100 ns pulse on a 50 Ω load, with various gate voltages (15 V (red) and 20 V (black)). (b) Drain current during switching on the (i) high-side MOSFET and (ii) low-side MOSFET in LTSpice simulation with 15 V (solid red line) and 20 V (black dashed line) gate voltages.

Figure 4(bi) and 4(bii) shows good agreement with (1) and (2) analytical description of the MOSFET switching and driving process.
Table 3 shows the bill of the material for the key components used in the generator. The overall cost for the bill of the material for the generator was <£350. The majority of the cost is the enclosure and the high-voltage supply (FS40).
Bill of material of the generator's critical components (at time of write-up)

The high-voltage supply (FS40) is an essential component and was limited to producing a voltage output of 1.4 kV. The source was capped to 1.4 kV to ensure the voltage supplied to the MOSFET drain pin does not exceed its maximum drain–source breakdown voltage (V DSmax = 1.7 kV). The FS40 is a compact (57.15 mm × 28.5 mm × 12.7 mm) proportional DC to high-voltage DC source which provides isolation from the high-voltage (0–1.4 kV) output from its low-voltage input (0–5 V) [47].
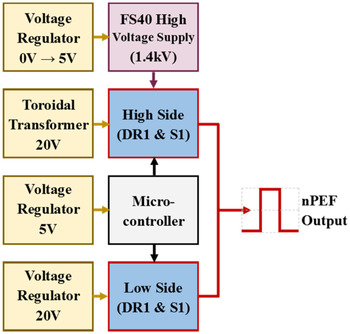
The generator dimension is limited to the enclosure size (99 mm × 254 mm × 244 mm). In future adaptations, the nanosecond electric pulse generator can be smaller in size. Within the current enclosure, there are unoccupied areas. Presently, the circuits are built on Veroboard, with each subsection module of the design occupying a single board, as illustrated in Fig. 5. Integrating the individual Veroboard subsections onto a single printed circuit board would significantly reduce the area occupation of the current enclosure, reducing the generator's size and cost in future implementations.
Design block diagram of Veroboard modules.

Nanosecond pulse verification and validation
A Verification and Validation (V&V) process was undertaken to check if the system meets the electrical specifications outlined and also to evaluate the intended purpose of biological cells nanoporation.
The electrical specifications outlined was to generate pulsed electric fields with a pulse duration from 100 to 300 ns with voltage amplitudes in excess of 1 kV, with a repetition frequency ranging from 1 to 50 Hz, on a 50 Ω load.
An “Arduino Uno” microprocessor with a LCD keypad shield provides a user-friendly user interface in addition to providing precise control and a wide range of pulse profiles to be generated (see Table 4). In further implementations, the Arduino could be replaced by a single microcontroller chip.
Generator characteristics

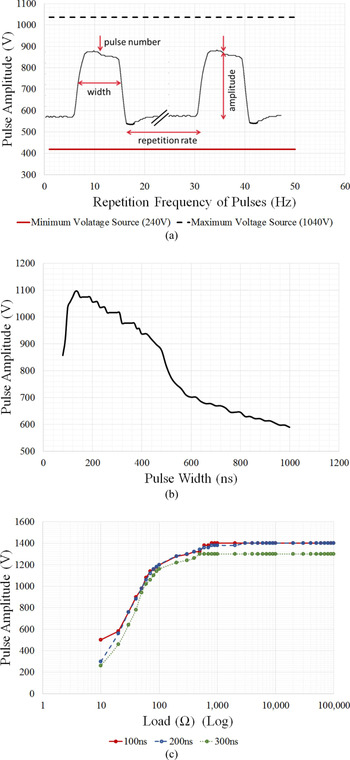
Figure 6(a) indicates that the pulse amplitude is unaffected throughout its operating repetition frequencies of 1–50 Hz (result obtained with a 50 Ω resistor load and a pulse width of 100 ns). Furthermore, Fig. 6(b) also suggests that the generator's performance is optimized to the intended specifications as amplitudes in excess of 1 kV are generated in the pulse width range from 100 to 300 ns (result obtained with a 50 Ω resistor load and 50 Hz repetition frequency).
Measured characteristics of the generator pulse amplitude: (a) as a function of the repetition frequency 1–50 Hz (with pulse widths of 100 ns). (b) As a function of pulse width (at 50 Hz repetition frequency). (c) As a function of load resistance for three different pulse widths (100, 200, and 300 ns).

On the other hand, Fig. 6(c) indicates that the nanosecond pulsed electric field generator is impedance sensitive. With a load below 500 Ω, the pulse amplitude decreases. This decrease appears linear (on a log scale) with a load ≤100 Ω. This effect is due to the voltage source. Like most voltage sources they are mismatched to a low impedance or short-circuited load. Additionally, Fig. 6(c) suggests that the power source used has an internal impedance of ~30 Ω as a load of ~30 Ω experiences half (700 V) of the voltage generated (1400 V), behaving as a voltage divider.
The load curve was obtained by loading the generator with various resistive loads of low inductance (planar resistor) and measuring the pulse amplitude observed with the particular load. Reasoning for a 50 Ω load is explained in the next section “Biological 50Ω load”.
Biological 50 Ω load
Due to the fast rise and fall times of the pulses, it was necessary to consider the transmission line with a characteristic impedance of 50 Ω. Cables and connector were therefore used for the cuvette housing unit that have a characteristic impedance of 50 Ω. Therefore, it was necessary to match the biological load (R L) to 50 Ω. In practice, D283 cell line suspended in a standard culture medium known as Modified Eagle Medium (MEM) has an estimated impedance of ~10 Ω due to the high conductivity of the suspending medium of around 1.5 S/m [Reference Silve, Vezinet and Mir2, Reference Merla, El-Amari, Kenaan, Liberti, Apollonio, Arnaud-Cormos, Couderc and Leveque48]. Impedance mismatch minimization between the generator, cuvette holder, and the load (cuvette filled with cell solution) is imperative to guarantee the generator can deliver nanosecond electric pulses in excess of 1 kV amplitude.
To get 50 Ω impedance matching within the whole in vitro set-up, when the generator is connected to a biological load, the cells were suspended in an artificial buffer solution that is able to mimic a pure resistive 50 Ω load. Additionally, a 50 Ω load is advantageous to minimize the mismatch with other microwaves and electronics, such as components, connections, and devices (e.g. oscilloscopes, voltage and current probes, attenuators, dividers).
One hundred microliters of our artificial buffer solution consists of 20 ml of phosphate buffer saline (PBS), 80 ml of distilled water, and 8.2 g of sucrose to counteract osmotic pressures of the cells because of the distilled water. The artificial 50 Ω buffer solution has a conductivity of 0.3 S/m [Reference Merla, Casciati, Tanori, Tanno and Mancuso49].
In vitro investigation set-up
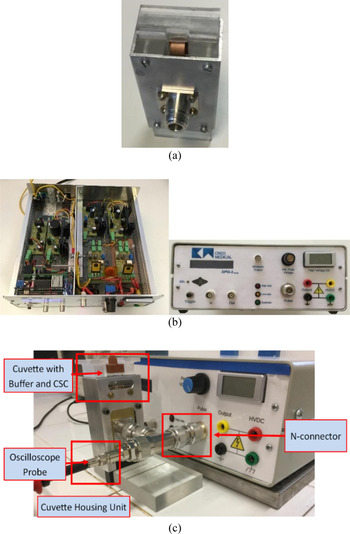
High field exposure of D283 MB cell line to high (100–300 ns) pulses was conducted by a Bio-rads commercially available 0.1 cm gap, 100 µl EP cuvettes (1 mm × 55 mm) [50]. The cuvette housing unit in Fig. 7(a) was designed by ENEA and provides a direct and easy (standard 50 Ω connector) connection between the cuvette and the pulse generator (Figs 7(b) and 7(c)).
The in-vitro investigation set-up (a) ENEA's cuvette housing unit. (b) the nanosecond-pulse electic field generator (c) the global arrangement of the initial bench study to investigate the performance of the nanosecond-pulse generator on D283 MB cell line.

Furthermore, the cuvette housing units allow real-time monitoring of the applied voltage pulse via an oscilloscope to assess the electric field delivered to the cells. The electric field between the cuvette electrodes (that form a capacitance loaded by biological solution) has a very homogenous distribution as already suggested in [Reference Silve, Vezinet and Mir2, Reference Kenaan, Amari, Silve, Merla, Mir, Couderc, Arnaud-Cormos and Leveque51] by numerical simulations, and it can be well estimated as the ratio between the applied voltage over the electrode distance.
The complete setup for preliminary study of the D283 cell line is shown in Fig. 7(c). The results of permeabilization and viability tests are discussed in the next section.
Result and analysis
Nanosecond-pulses delivered to the D283 cell line
The first in vitro experiments aimed at characterizing the generator in terms of the real pulse waveform is delivered to D283 cells, rather than to a 50 Ω resistor (Figs 2, 4 and 5). Experiments were performed using the electroporation cuvettes filled with buffer solution containing cells (D283 cell line is a mixed population of differentiated and stem-like cells as reported in [Reference Merla, Casciati, Tanori, Tanno and Mancuso49]). The voltage pulse/pulsed waveforms were captured in real time via a Tektronix TDS5054B-NV Oscilloscope [52] and a high-voltage probe (LeCory PPE 5 kV [53]).
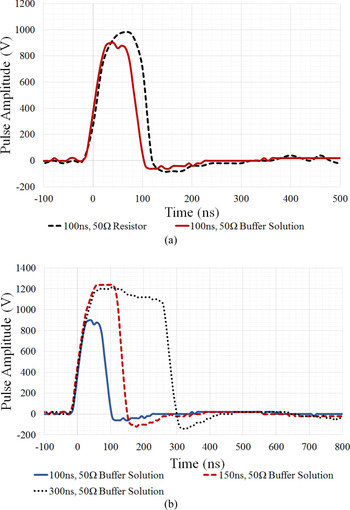
Figure 8(a) suggests that the buffer load is 50 Ω, because the measured waveform of the applied 100 ns pulsed electric field with the artificial buffer solution (red solid line) is comparable to the waveform measured with a 50 Ω resistor (black dashed line) as a load. It can be seen that the presence of the D283 cells did not affect the electrical properties of the buffer solution medium since cells represent an extremely small fraction of the global solution volume contained within the cuvette. Therefore, the artificial 50 Ω buffer solution can effectively represent a 50 Ω load from an electrical point of view.
Measured nanosecond pulsed electric fields applied to various loads. (a) comparison of a single 100 ns, 50 Hz, 20 pulses with a 50 Ω resistor load (black dashed line) and 50 Ω buffer solution with D283 cell line load (solid red line). (b) comparison of a single 100 ns, 50 Hz, 20 pulses of various widths: 100 ns (blue solid line), 150 ns (red dashed line) and 300 ns (black dotted line) pulse, with a 50 Ω buffer solution with D283 cell line load.

Figure 8(b) depicts the 100 ns (blue solid line), 150 ns (red dashed line), and 300 ns (black dotted line) voltage pulse waveforms measured across the electroporation cuvette containing D283 MB cell line suspended with the 50 Ω, 0.3 S/m buffer solution. These waveforms illustrate the electrical signal delivered to the cells during the biological investigations (permeabilization and viability tests). The cells were exposed to a symmetrical voltage pulse with a maximum amplitude of ~1.2 MV/m, which are similar to the results obtained in simulations, as shown in Fig. 4(a).
The waveforms in Fig. 8(b) demonstrate that the 100, 150, and 300 ns pulses applied to the D283 MB cell line are square and symmetrical, with minimal overshoot and ringing.
Permeabilization tests
For the permeabilization tests, D283 cells were grown in a humidified atmosphere at 3°C and 5% CO2 in MEM supplemented with 10% fetal bovine serum and 1% of penicillin streptomycin. Cells were scraped, centrifuged, and suspended in the artificial 50 Ω buffer, and then YO-PRO-1 (3 µM) was added 5 min before the electric pulses delivery.
To test cell permeabilization, pulses were delivered according to the protocol as reported in Table 5. A non-pulsed sample was also included in the analysis.
Cell population permeabilization rate following electric field exposure

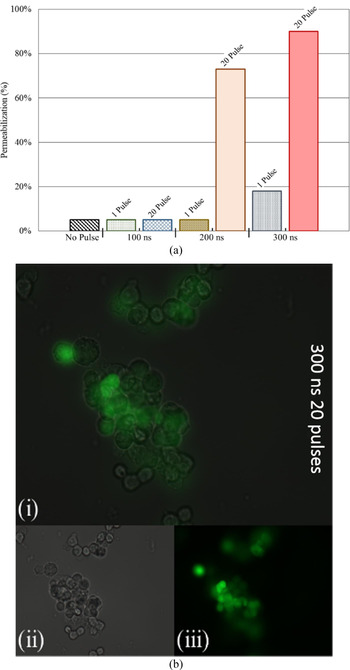
Figure 9(a) illustrates various permeabilization rates of the D283 cells exposed with different pulse protocols in terms of pulse width, and number of pulses. The same figure indicates that exposing D283 cells to 200 and 300 ns signals with 20 consecutive pulses resulted in more than 70 and 90% of permeabilized cells, respectively. This is further confirmed by observing Fig. 9(b) where images of permeabilized D283 are shown. For the same sample, the bright field image is also presented (Fig. 9(bii)) to demonstrate the presence of D283 cells in the reviewed sample.
(a) D283 permeabilization rate following exposure to electric pulses with various pulse parameters. (b) YO-PRO-1 uptake after exposure to 20 pulses of 300 ns at 1.2 MV/m: i. bright field superimposed to fluorescence microscope image. ii. bright field images. iii. fluorescence microscope image.

Electropermeabilized cells were observed under fluorescence microscopy (YO-PRO-1 wavelength emission = 510 nm), and the percent of permeabilization is computed as the ratio of fluorescent cells over the total imaged D283 cells, in three different observation areas.
Viability test
To assess cell viability, the well-established trypan blue exclusion test was performed. D283 cells were scraped and suspended in the artificial 50 Ω buffer. Then the cells were electropermeabilized using the pulses protocol in Table 5.
Viability was evaluated immediately after the pulse delivery and at 24 and 48 h after the electric treatment. Specifically, 10 µl of trypan blue was added to the 10 µl of cell solution. Live cells were automatically counted using a commercial system (Luna II by Logos) in disposable counting chambers.
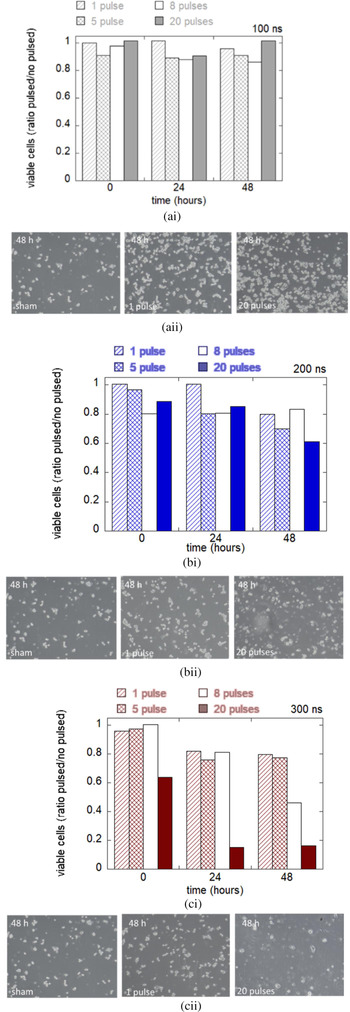
In Fig. 10 viability is expressed as the percentage ratio of the pulsed sample over the control (non-pulsed sample). These data show a high cell viability when 100 and 200 ns are applied. When 300 ns pulses are delivered to cells, viability of cells is reduced especially when 20 consecutive pulses of 300 ns are applied (see viability after 24 and 48 h from exposure).
(i) Result of viability test in panel (ii) bright field images after 48 h from the electric field exposure of width: (a) 100 ns (b) 200 ns (c) 300 ns.

Bright field images after 48 h from the exposure are reported in Fig. 10. These images confirm that D283 cells exposed to 100 and 200 ns are slightly affected by electric pulses compared to the non-pulsed (sham) sample. Cell viability and morphology seemed much more degraded when 20 pulses of 300 ns durations are delivered.
These observations lead to the hypothesis that D283 start to be irreversibly permeabilized when multiple pulses (20) of 300 ns are applied. Fewer pulses (<20) seem to act on D283 cell line in a reversible manner.
Non-thermal effect
The short duration (nanoseconds) and low repetition frequency (1 Hz) of the electric pulses ensure that the energy delivered into the biological system should be non-thermal [Reference Moreau, Lefort, Burke, Leveque and O'Connor54, Reference Kohler, O'Connor, Vu, Leveque and Arnaud-Cormos55]. A non-thermal approach of neutralizing CSCs is an appealing treatment approach since it could allow for a targeted neutralization of a tumor without heating the cells above body temperature. This would result in predominantly sparing healthy cells, extracellular matrix, nearby vessels, and structures while allowing tissue regrowth and preventing unwanted damage to patient brain tissue [Reference Sundararajan1, Reference Moreau, Lefort, Burke, Leveque and O'Connor54, Reference Kohler, O'Connor, Vu, Leveque and Arnaud-Cormos55].
To verify that the delivered electric protocols resulted in a non-thermal effect, as literature suggests [Reference Sundararajan1, 50, Reference Kenaan, Amari, Silve, Merla, Mir, Couderc, Arnaud-Cormos and Leveque51], a cuvette heating analysis using specific heat capacity equation has been conducted.
The estimated temperature rise per pulse, ΔT in equation (3), and the maximum mean rate of temperature rise, ΔT max in equation (4), were calculated using the applied nanosecond pulsed electric field parameters (pulse width, pulse amplitude, number of pulses) and biological load parameters.
 $$\Delta T = \displaystyle{E \over {c\; m}} = \displaystyle{{\left( {\displaystyle{{V^2} \over Z}\; P_w} \right)} \over {c\; \lpar {\rho \; vol} \rpar }},$$
 $$\Delta {\rm T}_{max}{\rm \;\;} = \displaystyle{E \over {c\; m}}N = \displaystyle{{\left( {\displaystyle{{V^2} \over Z}\; P_w} \right)} \over {c\; \lpar {\rho \; vol} \rpar }}\; N.$$
In equations (3) and (4), E is the heated energy (Joules, J) due to the applied nanosecond pulsed electric field parameters. E depends on V, the applied pulse amplitude (Volts), Z is the impedance of the biological load (Ω), P w is the pulse width/duration of the applied electric pulse (seconds, s). c is the specific heat capacity (J/Kg °C) and m is the mass (Kg) of the biological load. m is determined by the density, ρ (kg/m3), and the total volume, vol (m3), of the biological load. In equation (4), N is the number of pulses delivered to the buffer solution.
The biological load consists of an impedance of 50 Ω (as shown) and a specific heat capacity of 4.18 J/g/°C, the same heat coefficient value as water, because the buffer solution consists mainly of water. In addition to having the same specific heat capacity as water, the buffer solution also has the same density as water (~1000 kg/m3). The total volume of liquid (buffer solution/biological load) the cuvette can occupy is 55 × 10−9 m3 (as the dimension of the cuvette is 1 mm × 5 mm × 11 mm).
As the D283 cell line consists of a small fraction of the global solution volume, it can be assumed that the heating effect on the cell solution is the same as the heating effect on the simple buffer solution.
Table 6 shows the estimated temperature rise per pulse and the maximum mean rate of temperature rise the 50 Ω buffer solution experienced with various pulse parameters (amplitude, pulse width, and frequency).
Heating effect of applied nanosecond pulsed electric field on the buffer solution

This theoretical thermal investigation clearly indicates that the change in the temperature of the biological load is dependent on the pulse properties; properties such as pulse width, pulse amplitude, and repetition frequency (maximum mean rate of temperature rise). Our computation highlights that the short duration and low repetition frequency of electric field pulses deliver non-thermal energy into the buffer solution and therefore the D283 cells [Reference Sundararajan1, Reference Moreau, Lefort, Burke, Leveque and O'Connor54–Reference Kohler, O'Connor, Vu, Leveque and Arnaud-Cormos55]. Table 6 indicates that the maximum temperature rise the cells experience within the cuvette is 37.53 mK or m°C, with a potential of rising by 1.876 mK or m°C in a second, assuming that no heat is dissipated away from the surrounding environment (air, material, equipment, etc.).
The cuvette is designed to have an impedance of 50 Ω in order to absorb all of the incident power. The voltage across the load is 900 V peak for a duration of 100 ns. This has a peak power of 16.2 kW, which only depends on the voltage and the impedance. If 16.2 kW is delivered to the cuvette for 100 ns then this is equivalent to 2 mJ of energy. The volume of fluid in the cuvette is 55 ml. The 1.6 mJ energy delivery will increase the temperature of 55 ml of water by 7.0 mK.
Assuming that the pulse heats only the fluid, and not the walls of the cuvette, the heat will escape from the fluid in the cuvette through the walls. The surface area of the walls is 142 mm2. Perspex has a thermal conductivity of 0.21 W/m/K. A temperature gradient of 0.07 K/mm would carry away all the heat from one pulse through the walls in a second. If the thickness of the walls is 5 mm then there would be about a third of a degree Kelvin across the walls.
None of the fluid in the cuvette is more than 0.5 mm from a wall, so heat transfer from the center of the fluid to the walls should be at least as quick as through the cuvette walls and should not result in a large temperature rise.
The temperature in the center of the fluid in the cuvette is unlikely to rise more than one degree Kelvin, and this depends to a large extent on the heat transfer from the cuvette to its surroundings, which is affected by such things as the material of the holding brackets, the contact area and pressure, and the amount of movement in the surrounding air.
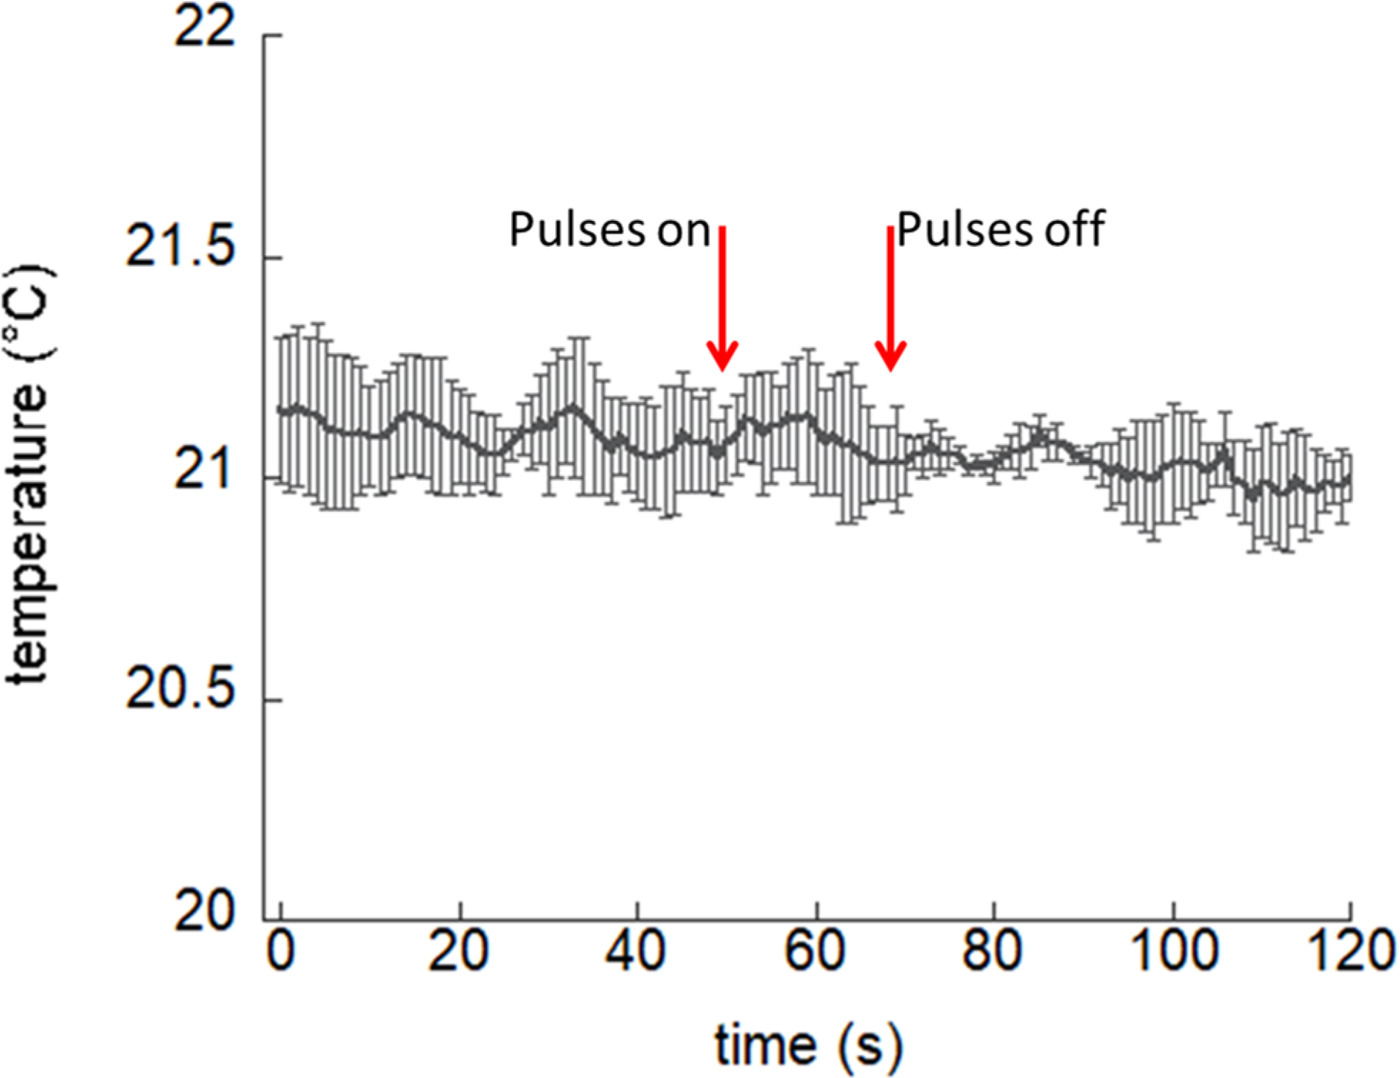
To further demonstrate the absence of thermal effects, the temperature of the buffer contained in the electroporation cuvette was measured using a fiber optic probe (LumaSense OEM Modules, optic fiber dimensions 0.3 mm) directly placed between the electrodes before (1 min), during, and after (1 min) the exposure. The strongest exposure condition employed in bio-experiments (300 ns, 20 pulses at 1 Hz) was considered for this test. No macroscopic temperature increase is observed, as shown in Fig. 11. Therefore, due to the very small temperature rise computed numerically, which is even macroscopically not detectable at experimental level, multiphysics numerical simulations to accurately determine the temperature rise of the fluid in the cuvette were forfeited.
Temperature trend within the electroporation cuvette electrodes before and after the electric pulses delivery. Bars represent standard deviation of the measurements over three independent acquisitions.
Conclusion
A nanosecond electric field pulse generator has been designed and fully characterized from a pulse amplitude, pulse duration, and repetition rate into a range of load impedances. It has also been characterized in terms of its biological efficacy.
The designed generator has proven to be a very useful instrument for the biologist to carry out a range of experiments on cells. The ability to vary the pulse width, repetition frequency, number of pulses, and amplitude is a key feature for such an application. This versatile generator is attractive to the biologists, since it supports a wide range of pulse protocols to define the optimal electric parameters for cell neutralization. Additionally, due to the use of conventional and non-specialist components, this generator is a very cost-effective solution in comparison to pulsed electric field generators that are currently commercially available.
The generator is well matched to the applicators (cuvette with 50 Ω buffer solution and cuvette holder); delivering square (flat-top) electric field pulses with minimal ringing and overshoot.
The overall system including the generator, the cuvette housing unit, and buffer solution resulted in successful permeabilization of D283 cells. More than 70% of the cell population were deemed to be permeabilized when multiple pulses (20) of 200 ns or longer pulse width were delivered. A viability study, following permeabilization tests, seems to indicate that D283 starts to be irreversibly permeabilized when multiple pulses (20) of 300 ns are delivered. The achieved cell permeabilization is non-thermal even for the stronger exposure condition.
Further perspectives of our work imply technological improvements, as the possibility to deliver different shaped pulse waveforms (e.g. bipolar), as well as introducing an impedance matching network to improve matching strategy between the generator output and the load (cell line, tissue, etc.). A matching strategy is imperative in future work for a more efficient electric-field distribution of ~1.4 MV/m at all load impedances. In reality, this aspect is significant for in vivo and clinical application as biological matter, such as cell line and tissue, etc., is naturally of low impedances, ~10 Ω.
The use of smaller dyes, with respect to YO-PRO-1, for detection of cell electropermeabilization is a consideration for future work. Indeed, one interesting possibility is the transport of small ions as Ca, through the uptake of specific markers as Fluo4 [Reference García-Sánchez, Merla, Fontaine, Muscat and Mir56]. A recent study suggested verification of eventual microthermal heating at the cell level, looking at the fluorescence of the Rhodamine B dye [Reference Moreau, Lefort, Burke, Leveque and O'Connor54].
The vision is for the designed nanosecond pulsed electric field generator to achieve targeted non-thermal neutralization of MB CSCs supporting both in vitro and in vivo test, while supporting further nanosecond-pulse-based applications in biology, medicine, and/or biotechnology in a cost-effective manner.
Acknowledgement
The authors thank the European Union's Horizon 2020 research and innovation program under grant agreement No.737164, SUMCASTEC, for the received funding. The authors would like to thank the partners of the SUMCASTEC project for the successful collaboration. The authors acknowledge B. Tanno from ENEA for the support in cell culturing and microscopy.
 I. W. Davies was born in Bodelwyddan, North Wales, UK in 1995. He received a M.Eng. degree in Electronic Engineering from Bangor University, Bangor, UK, in 2017. Since 2017, he has been with Creo Medical Limited, Chepstow, UK, where he is involved in Research and Development within the Company. His current research includes the development of a nanosecond-duration pulse generator of the SUMCSTEC project and he is currently studying for a Ph.D. degree in Electronic Engineering from Bangor University.
 C. Merla (S'06–M'09) received the M.S. and Ph.D. degrees in Electronic Engineering from the Sapienza University of Rome, Rome, Italy, in 2004 and 2008, respectively. From 2008 to 2012, she was a Post-Doctoral Fellow with XLIM, CNRS University of Limoges, Limoges, France, and with the Italian Inter University Center of Electromagnetic Fields and Biosystems, Rome. In 2012, she joined Lehigh University, Bethlehem, PA, USA, as a Research Scientist. She is with the Italian National Agency for New Technologies, Energy, and Sustainable Economic Development, Rome. She was also a Research Scientist with the Vectorology and Anticancer Therapy Laboratory, CNRS UMR 8203, Gustave Roussy, University of Paris-Sud, Université Paris-Saclay, Villejuif, France, where she develops wideband exposure systems for electropulsation in vitro, their integration with non-linear optical imaging techniques, and electromagnetic modeling of biological cells. She is now working on ultrashort electric pulse effects on cancer stem cells for innovative medical therapies.
 A. Casciati has graduated with honors in Biological Sciences in 1998 at the University “La Sapienza”, Rome, and obtained the Ph.D. degree in Neurosciences in novel experimental approaches on amyotrophic lateral sclerosis in 2004 at the “Università degli studi di Roma Tor Vergata”, Rome. After several post-doctoral fellowships (at “Fondazione Santa Lucia”, IRCCS, and EMBL), she has a strong experience in molecular and cellular biology using genetically modified cells and mice modeling human diseases. In particular, her main research interests are related to neurobiology field, focusing on molecular and cellular mechanisms of cancer and non-cancer diseases. She has currently a permanent position as a researcher at ENEA Casaccia in Rome, Italy, Division of Technologies and Methods for Health Protection. She is now involved in different European projects. Her main activities include (1) effects of low-dose ionizing radiation on neurogenesis and microenvironment modifications on the brain hippocampus in in vivo models; (2) neuroinflammation and DNA repair in transgenic mice models; (3) study of oncogenes expression in cancer and neuronal cell models; (4) study on ultrashort electric pulse effects on cancer stem cells for new therapeutic approaches.
 M. Tanori Ph.D. is a researcher at ENEA (Italian National Agency for New Technologies, Energy, and Sustainable Economic Development) since 2009. She has a broad expertise in radiation-induced cancer and non-cancer effects in mouse models. In particular, her research was focused on cellular and molecular events to study the effects of radiation during the brain development with particular attention in cerebellum and hippocampus. More recently, her interest is pointing toward the development of novel therapeutic strategy to radiosensitize medulloblastoma, the most common malignant pediatric brain tumor. She has participated in several EU research projects and now she is collaborating on ultrashort electric pulses targeting the medulloblastoma stem cells for innovative medical therapies.
 A. Zambotti received high school leaving qualification on Industrial Electronics in 1982. From 1985 to 1993, he worked as a Technician of electro-optical infrared systems with Selenia-Alenia Company. In 1993, he joined the Italian National Agency for New Technologies, Energy and Sustainable Economic Development (ENEA) as a Technician, participating in the realization and setup of the Metrological Centre in ENEA's Trisaia Research Centre. Since 2000, he joined the Electromagnetic Compatibility Laboratory in ENEA's Casaccia Research Centre, where he serves as a Laboratory Technician for electromagnetic compatibility and interference measurements and tests according to military and European standards. He also collaborates in research activities on dielectric spectroscopy measurements and antenna and radar-cross-section measurements.
 M. Mancuso is a senior scientist at ENEA since 2001. She has a strong background in radiobiology, molecular carcinogenesis, and toxicology as well as deep knowledge of experimental animal models for chemical- and radiation-induced tumorigenesis, together with a strong experience in histology, electron microscopy, pathology, molecular pathology, and molecular biology. She is involved as a coordinator or team member in four ongoing EU projects and in several different national projects. Dr. Mancuso is the author of about 60 peer-reviewed articles and of more than 100 conference proceedings in peer-reviewed international meetings, where she was often invited, as an expert in radiation biology/oncology.
 J. Bishop received the Ph.D. degree in Electronic Engineering from Bangor University, Bangor, UK, in 1997. He is currently the Director of Concept Energy Systems at Creo Medical Limited and originally developed microwave treatment and measurement systems at MicroOncology Ltd. He has worked as a Senior Systems and DSP Engineer in diverse radio technologies; in 2G–5G communications, RFPA linearization, radio-tracking, and medical microwave treatment. He has previously worked for Intel, PicoChip, Andrew Corp., and Securicor Information Systems.
 M. White received an Honours degree in Physics from Exeter University, Exeter, UK, in 1977. From 1977 to 1983, he was with the Microwave Tube Division, MO Valve Company [part of GEC (UK)], where he developed miniature magnetrons with small magnetic circuits. From 1983 to 2012, he was with the Radar Cross Section (RCS) Department, Thales UK, as a Microwave Engineer, Trials Engineer, and Mathematical Engineer involved with most aspects of RCS measurement, prediction, analysis, and software design (FACETS RCS prediction software), as well as radar, antenna, filter, and signal processing design. For several years, he was the Co-Presenter of The RCS Course and The FACETS Training Course to delegates from industry and government agencies. Since 2012, he has been with CreoMedical Limited, Chepstow, UK, where he has been involved in the design and development of novel medical tools using microwaves. Mr. White is a Chartered Physicist. He is a member of the Institute of Physics and the Institution of Engineering and Technology (IET).
 C. Palego (S'03–M'07–SM'10) received the M.S. degree in Electrical Engineering from the University of Perugia, Perugia, Italy, in 2003, and the Ph.D. degree in Microwave Engineering and Optoelectronics from the University of Limoges, Limoges, France, in 2007. Since 2007, he has been a Postdoctoral Research Associate (2007–2010) and Research Scientist at Lehigh. He is currently a Senior Lecturer in smart sensors and instrumentation at Bangor University, Bangor, UK, and a Visiting Research Scientist at Lehigh University, Bethlehem, PA, USA. His interests include electromagnetic theory, micro/nanotechnology and biomedical research, as well as RF-MEMS for reconfigurable frontends, antenna arrays, and high-power applications.
 C. P. Hancock (SM'07) received the Ph.D. degree in Electronic Engineering from Bangor University, Bangor, UK, in 1996. From 1997 to 2002, he was a Senior Microwave Engineer with Gyrus Medical Ltd. In 2003, he found MicroOnclogy Ltd. (now Creo Medical Limited), Chepstow, UK, to develop his ideas based on dynamic impedance-matching techniques and integrated RADAR measurement techniques using Ku-band energy for the treatment of breast tumors. In 2009, he was given a personal Chair with the Medical Microwave Systems Research Group, Bangor University. He is also the Chief Technical Officer (CTO) and founder of Creo Medical Limited.