


Introduction
During a surge, ice flow in a glacier can increase by more than two orders of magnitude for a relatively short period (1 year to the order of a decade). This fast ice flow is believed to result from an increase in basal sliding associated with high water pressures and decoupling from the glacier bed (e.g. Reference ClarkeClarke, 1987). During some glacier surges, a steep ramp of ice which separates fast-moving surging ice upstream from stagnant ice downstream (the ‘surge front’) propagates progressively down the glacier. The surge front propagates downstream as a wave more rapidly than actual ice velocities (Reference Raymond, Jóhannesson, Pfeffer and SharpRaymond and others, 1987). Propagation of the front occurs by a combination of ductile (compression and extension) and brittle (thrusting and faulting) mechanisms. These processes are evidenced by observations of emergent and submergent vertical velocities at the glacier surface as the surge front passes (e.g. Reference Raymond, Jóhannesson, Pfeffer and SharpRaymond and others, 1987; Reference Murray, Dowdeswell, Drewry and FrearsonMurray and others, 1998) and through the resulting ice structures imaged post-surge using geophysical techniques (e.g. Reference Murray, Gooch and StuartMurray and others, 1997) or inferred from surface mapping (e.g. Reference Hambrey, Dowdeswell, Murray and PorterHambrey and others, 1996). The propagation of the surge front must be controlled by these deformation mechanisms, which must allow downstream propagation of the switch between stagnant basal conditions and those facilitating fast flow. This switch must take place downstream of the surge front, and indeed emergent vertical velocities have been recorded some hundreds of metres downstream of the surge front (Reference Murray, Dowdeswell, Drewry and FrearsonMurray and others, 1998), but little is known of the basal processes that allow this switch to occur. In this paper, we study the seismic emissions recorded at the active surge front of Bakaninbreen, Svalbard, at a time when the surge front was propagating downstream at a rate of 2.5–3.0 md–1 , to further our understanding of plastic and brittle fracture in the propagation of the surge front.
Various workers have attributed seismic emissions on glaciers to basal sliding over ‘sticky’ spots (e.g. Reference Anandakrishnan and AlleyAnandakrishnam and Alley, 1994), surface crevassing (e.g. Reference Neave and SavageNeave and Savage, 1970), along-glacier shear zones (e.g. Reference GórskiGórski, 1997), fluid-driven cracks (e.g. Reference Métaxian, Araujo, Mora and LesageMétaxian and others, 2003) and calving at the glacier front (e.g. Reference Wolf and DaviesWolf and Davies, 1986). Build-up of stress in discrete areas of the ice, close to either the surface or the base, can result in discrete icequake events with similar characteristics to tectonic earthquakes, indicative of brittle fracture rather than plastic flow. For example, Reference Deichmann, Ansorge, Scherbaum, Aschwanden, Bernardi and GudmundssonDeichmann and others (2000), studying icequakes from Unteraargletcher, Swiss Alps, found icequakes associated with brittle fracture at the base of the glacier, although the majority of the energy release was interpreted to come from surface crevasses. Few events were located within the body of the glacier. Stick-slip motion has been calculated to produce energies of 105-109J, and emissions increase with glacier flow in the summer months (e.g. Reference Weaver and MaloneWeaver and Malone, 1979) or on a diurnal basis (e.g. Reference Métaxian, Araujo, Mora and LesageMétaxian and others, 2003) as a result of changes in basal lubrication.
Bakaninbreen
Bakaninbreen (Fig. 1) is a 17 km long polythermal glacier in southern Svalbard which last started surging in 1985 and continued until 1995 (Reference Murray, Dowdeswell, Drewry and FrearsonMurray and others, 1998). The glacier flows from an elevation of ∼500m, and at about 10.5 km from the ice divide becomes confluent with Paulabreen, turning sharply through 90° before continuing an additional ∼6km to its terminus at the head of Van Mijenfjorden. An extensive programme of hot-water drilling and borehole instrumentation has shown that the glacier overlies 1-3 m of soft and deforming sediments (Reference Murray and PorterMurray and Porter, 2001), beneath which lie sandstones and friable mudstones (Salvigsen and Winsnes, 1987).
(a) Map of location of surge front, 1985–95. The dashed rectangle marks the position of Figure 2. Dark-grey areas are moraine, light-grey areas are bedrock and the fjord is horizontally shaded. Insert shows the location of Bakaninbreen in Svalbard. (b) Graph of annual rate of surge front propagation (after Reference Murray, Dowdeswell, Drewry and FrearsonMurray and others, 1998). (c) Surge front in 1987 looking upstream (approximately northeast). (d) Close-up of surge front (note arrowed snow scooter for scale).
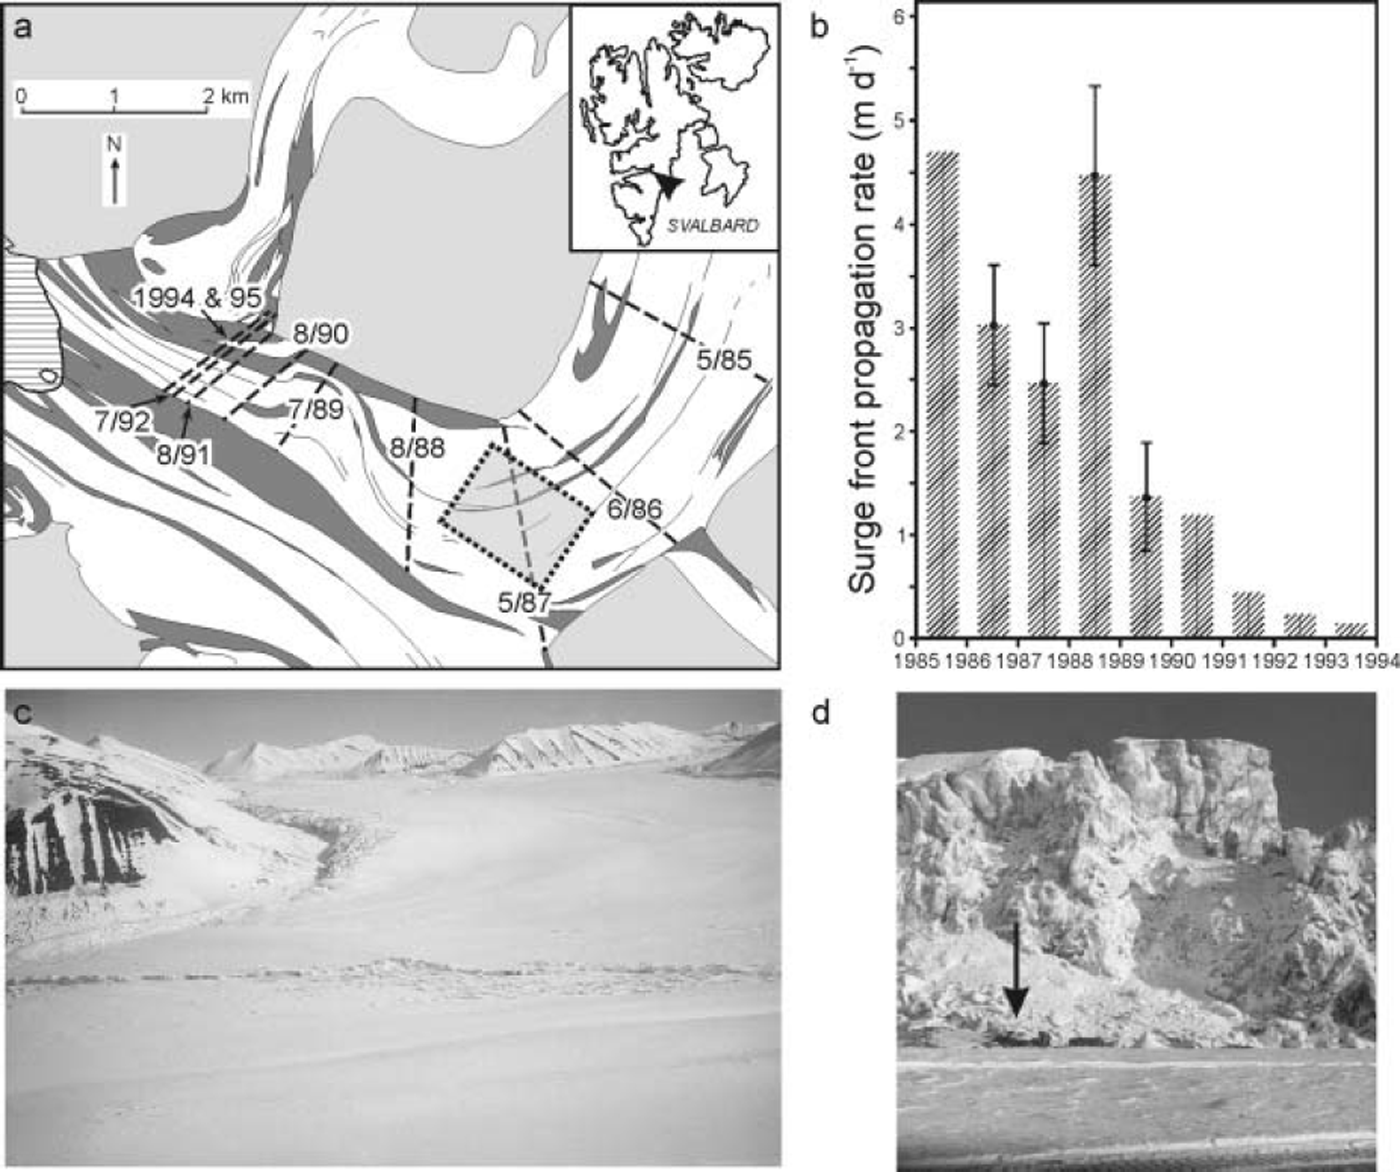
During its surge the glacier developed a steep front where fast-moving ice impinged on stagnant non-surging ice downstream. In 1985, the surge front was ∼20-25m high, and between 1985 and 1989 it reached velocities of up to ∼4.7md–1. In May 1987, the period of the measurements reported in this study, the surge front was located approximately at the corner (Fig. 1) in a region where the ice was ∼100-150 m thick. Throughout the surge, thermal conditions beneath the fast-flowing region of the glacier were warm, whereas in the thinner ice downstream of the surge front the glacier was inferred from radar and thermistor measurements to be frozen to its bed (Reference MurrayMurray and others, 2000). The surge front was a strongly longitudinally compressive region associated with emergent vertical strain rates. Detailed structural investigations from the glacier surface (Reference Hambrey, Dowdeswell, Murray and PorterHambrey and others, 1996), together with geophysical techniques (Reference Murray, Gooch and StuartMurray and others, 1997, Reference Murray2000), have shown the occurrence of sediment-filled faults located both upstream and downstream of the surge front. At the surge front itself, some of these shear zones clearly drained high-pressure water to the glacier surface, which in some locations formed mounds of ice with cracked surfaces similar to small pingos. Downstream of the front, horizontal velocities were low, but emergent vertical velocities showed a premonition of the front’s arrival that caused thickening of the glacier into a ‘fore-bulge’ which caused uplift of ice >750m downstream of the front itself. Arrival of the surge front at a location resulted in the switch from slow to fast flow, thought to be the result of a switch from cold to warm basal conditions allowing increased basal lubrication (Reference MurrayMurray and others, 2000). The region of the surge front itself remained longitudinally compressive, and extension began ∼500m upstream of it. The detailed studies at this glacier have allowed the development of a model of thermally regulated surging over a soft bed thought to be applicable to Svalbard glaciers (Reference Fowler, Murray and NgFowler and others, 2001).
Data
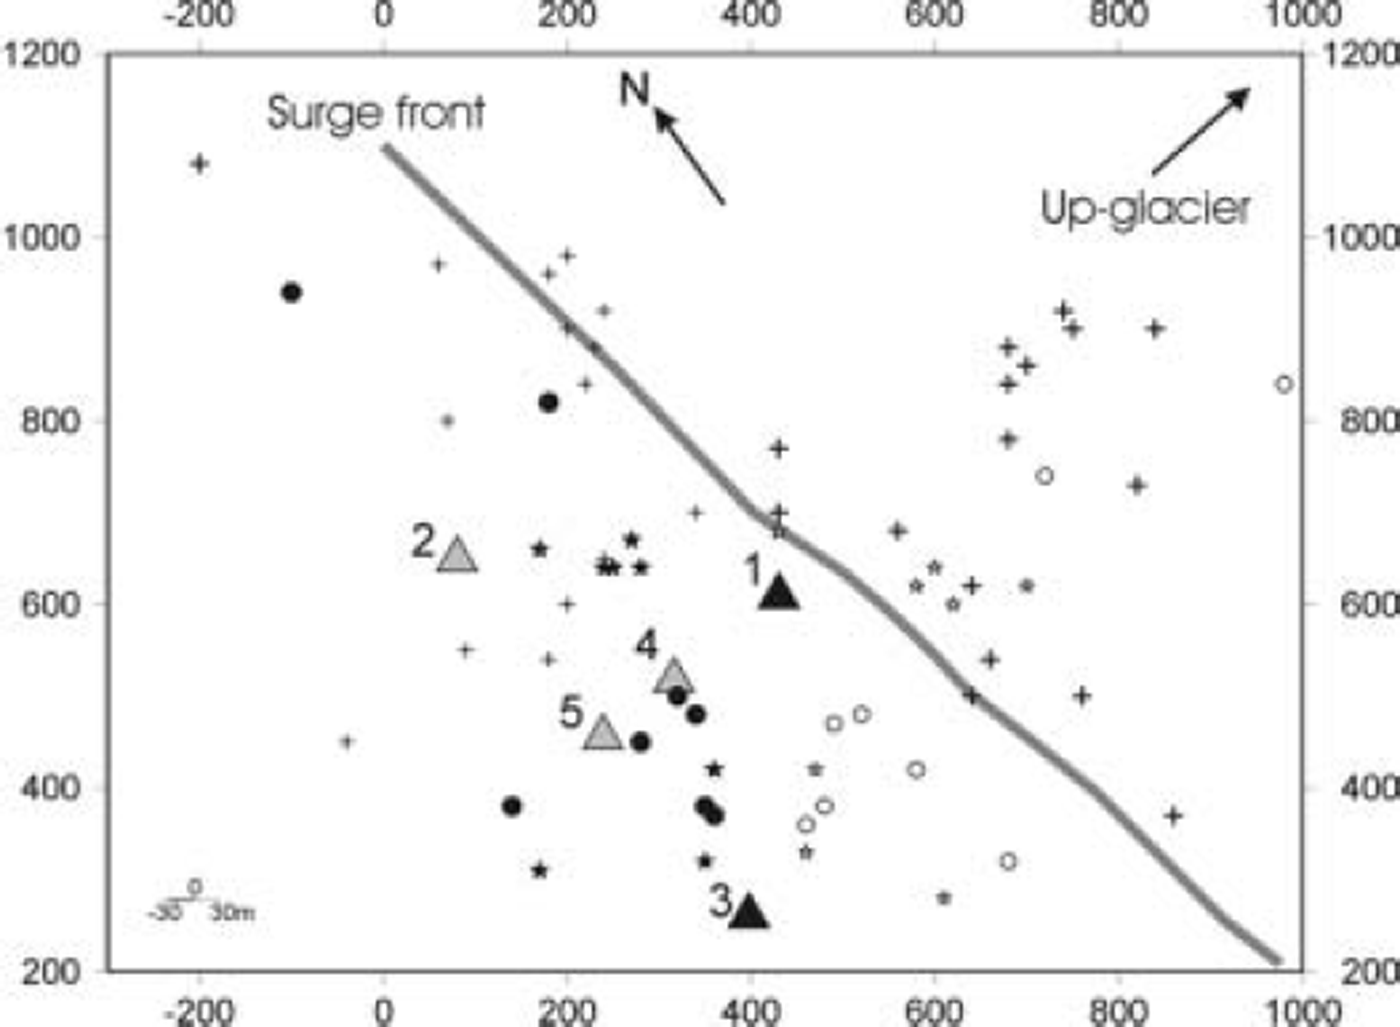
The seismic emission recordings were collected over a period of 9 days between 24 March and 5 April 1987, when the surge front was travelling at 2.5–3.0m d–1 (Fig. 1). Three single component vertical geophones and two accelerometers were deployed in a T-shaped array downstream from the surge front on Bakaninbreen (Fig. 2). The nearest sensor was located about 50m downstream of the surge front, and the array had dimensions of about 250 m perpendicular to the surge front and 500m parallel to it. To improve coupling, the sensors were placed in 1 m deep holes and frozen in . The original analogue data, recorded on a Racal Store 14 tape recorder at 15/16 in s–1, were digitized at 2000 samples s–1. Due to instrument malfunction (geophone 2), reduced gain (accelerometers 4 and 5) and physical decay of some of the analogue tapes with time, making them unusable, most of the digitized waveform data for this study come from 6 hours of recording on 31 March and 3 April 1987. We also have access to the previous analogue play-outs of events for the whole period, which indicate that the waveforms analyzed here are representative of the full dataset.
Map of location of sensors and icequakes. The metre grid has an arbitrary origin. The base of the surge front is marked by a line. The black triangles represent the geophones from which we obtained recordings. The grey triangles mark the locations of the accelerometers (sensors 4 and 5) and the broken geophone (sensor 2). Type A events are marked by crosses at their two surface locations, the most easterly of which are in bold. Type B events are marked by stars at their locations at 100 m depth (approximately the glacier thickness), the most westerly of which are depicted in black. Type C harmonic events are marked by circles at their location at 100 m depth, the most westerly of which are depicted in black. The event location picking error of ±30 m is indicated.
Methodology
The digitized recordings for geophones 1 and 3 were processed through an automatic event detector (short-term average amplitude/long-term average amplitude with a value of 10). After scanning of all the waveforms, the events were characterized by waveform type into three categories (Fig. 3).
Type A waveforms show a small-amplitude first arrival, interpreted to be a P-wave, followed by a low frequency (10-80 Hz) multi-peaked complex wave train. In some cases, the complexity of the waveform made it difficult to identify the P-wave. These wave trains are interpreted as being due to multiple interfering sources.
Type B waveforms show a small-amplitude first arrival, interpreted to be a P-wave, followed by a simple higher-amplitude high-frequency (∼50-60 Hz) pulse, interpreted to be the S-wave (shear).
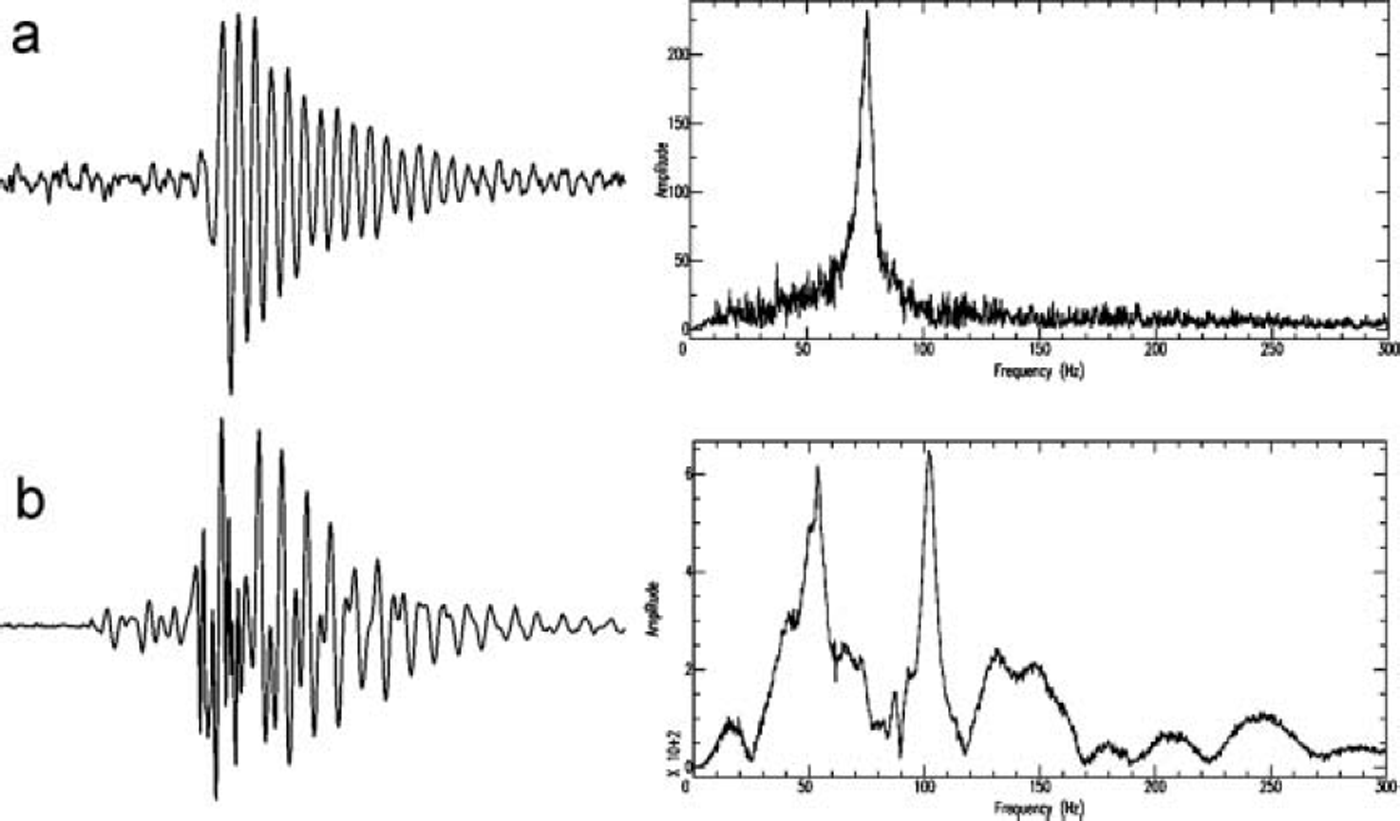
Type C waveforms are harmonic in character and have the form of decaying sine waves. The dominant frequency of these waveforms ranges between 75 and 90 Hz.
Typical waveforms from the different categories of events identified: types A, B and C. P is P-wave first arrival, S is S-wave arrival, and LR is Rayleigh surface wave.
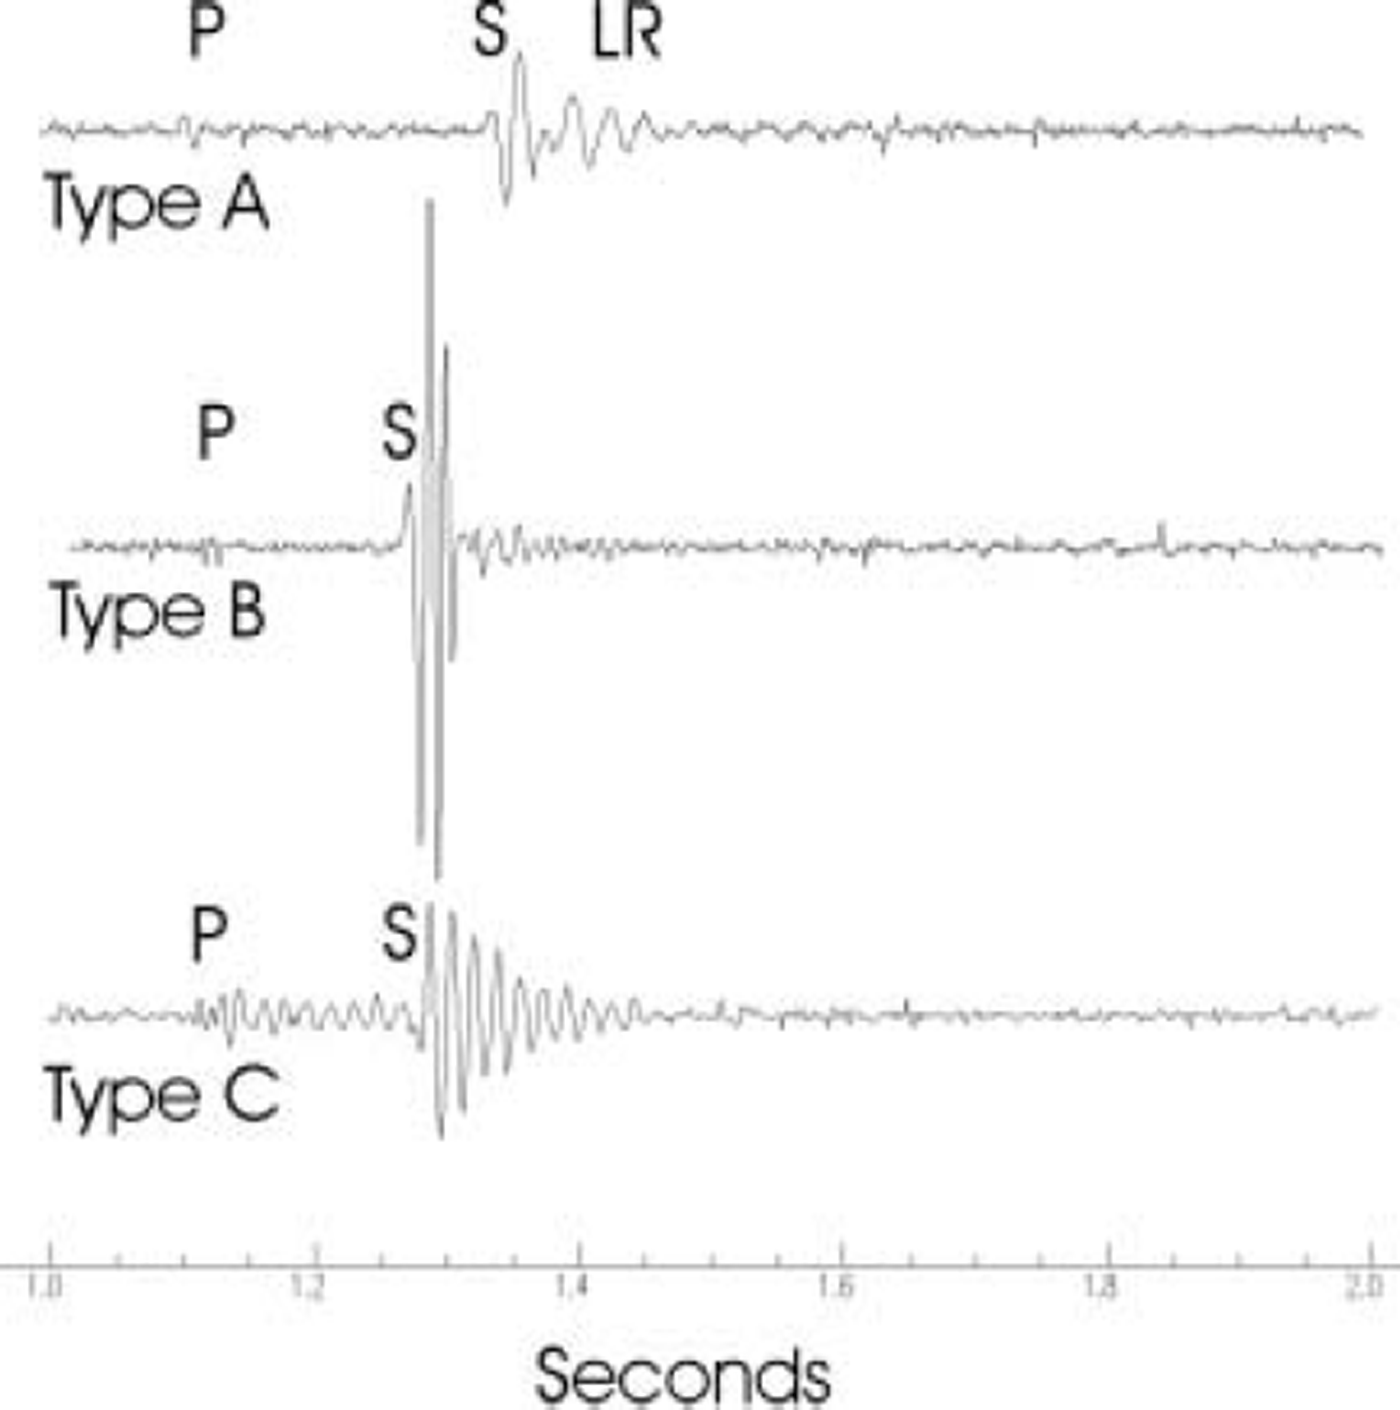
During the period of recording, approximately 86% of the waveforms were of type A, with 8% of type B and 6% of type C.
As only two sensors were operational, the location of the events is non-unique. We use standard earthquake procedures to find the loci of points in map and depth coordinates (x, y, z) that fit the distances from the sensors determined from relative P-wave and S-wave travel times. For simplicity, we assume the waves have travelled in a uniform ice half-space, for which we need to estimate the P-wave (V p) and S-wave (V s) velocity and take into account the elevation of the sensors. We use the average velocity to the glacier bed (V p = 3620 ms–1, V s = 1830ms–1) determined from the top 100 m of a velocity model produced during a controlled-source seismic field programme carried out upstream of the surge front in March and April 1998 to investigate basal conditions from reflections off the bed (Reference Smith, Murray, Davison, Clough, Woodward and JiskootSmith and others, 2002). The shear wave velocity was calculated from the P-wave velocity under the assumption of a Poisson’s ratio of 0.3, i.e. Vp/Vs = 1.98 (Rothlisberger, 1972). The higher velocities of the colder ice are assumed to continue to the bed downstream from the surge front (Reference MurrayMurray and others, 2000). In reality, this has little effect (<2%) on the average velocity, as the glacier is approximately 100 m thick downstream as compared to 150 m thick upstream of the surge front (Reference Murray, Dowdeswell, Drewry and FrearsonMurray and others, 1998). The locations are insensitive to small variations in the velocity model. For example, if we assume cold-ice velocity throughout (V p = 3770 ms–1) and a Poisson’s ratio of 0.34 (Vp/Vs = 2.03; Reference Deichmann, Ansorge, Scherbaum, Aschwanden, Bernardi and GudmundssonDeichmann and others, 2000), we reduce the estimated distance to an event originally at the average observed distance of ∼300m away by 9 m, which is insignificant to our conclusions. We plot the two points where the loci of potential event locations reach either the surface (type A) or 100 m depth (types B and C) (Fig. 2), and determine error bars on the locations with our estimated picking error of ± 2 ms. Why these depths were chosen is discussed below. These assumptions give a worst-case scenario for the closest events, approximately 120 m away from the sensors, of ±17m, which is again insignificant to our conclusions.
We constrain the depth of our events using an argument based on the waveform characteristics. Type A events are interpreted as occurring at depths much shallower than the bed because surface waves are generated, and type B and C events as deeper events associated with the glacier bed because no surface waves are apparent. It is well known in earthquake seismology that deep earthquakes do not generate surface waves, while shallow earthquakes do (Reference Lay and WallaceLay and Wallace, 1995). The surface waves recorded on vertical sensors such as those described here are known as Rayleigh waves. Rayleigh waves are best generated by events occurring at depths of less than one wavelength (Reference Deichmann, Ansorge, Scherbaum, Aschwanden, Bernardi and GudmundssonDeichmann and others, 2000). The waveforms we interpret as Rayleigh waves have frequencies of 30–70 Hz, i.e. wavelengths of 60–25 m. Events at these depths or shallower should generate surface waves, while those deeper down, i.e. at the glacier bed, should not. Reference Deichmann, Ansorge, Scherbaum, Aschwanden, Bernardi and GudmundssonDeichmann and others (2000) found that icequakes occurring at depths greater than about 40m on Unteraargletscher produced little Rayleigh wave energy. They differentiated between Rayleigh waves and S-waves using particle motion on three component sensors, which due to the limitations of the instrumentation we cannot do in this study. However, their results are analogous to our observations.
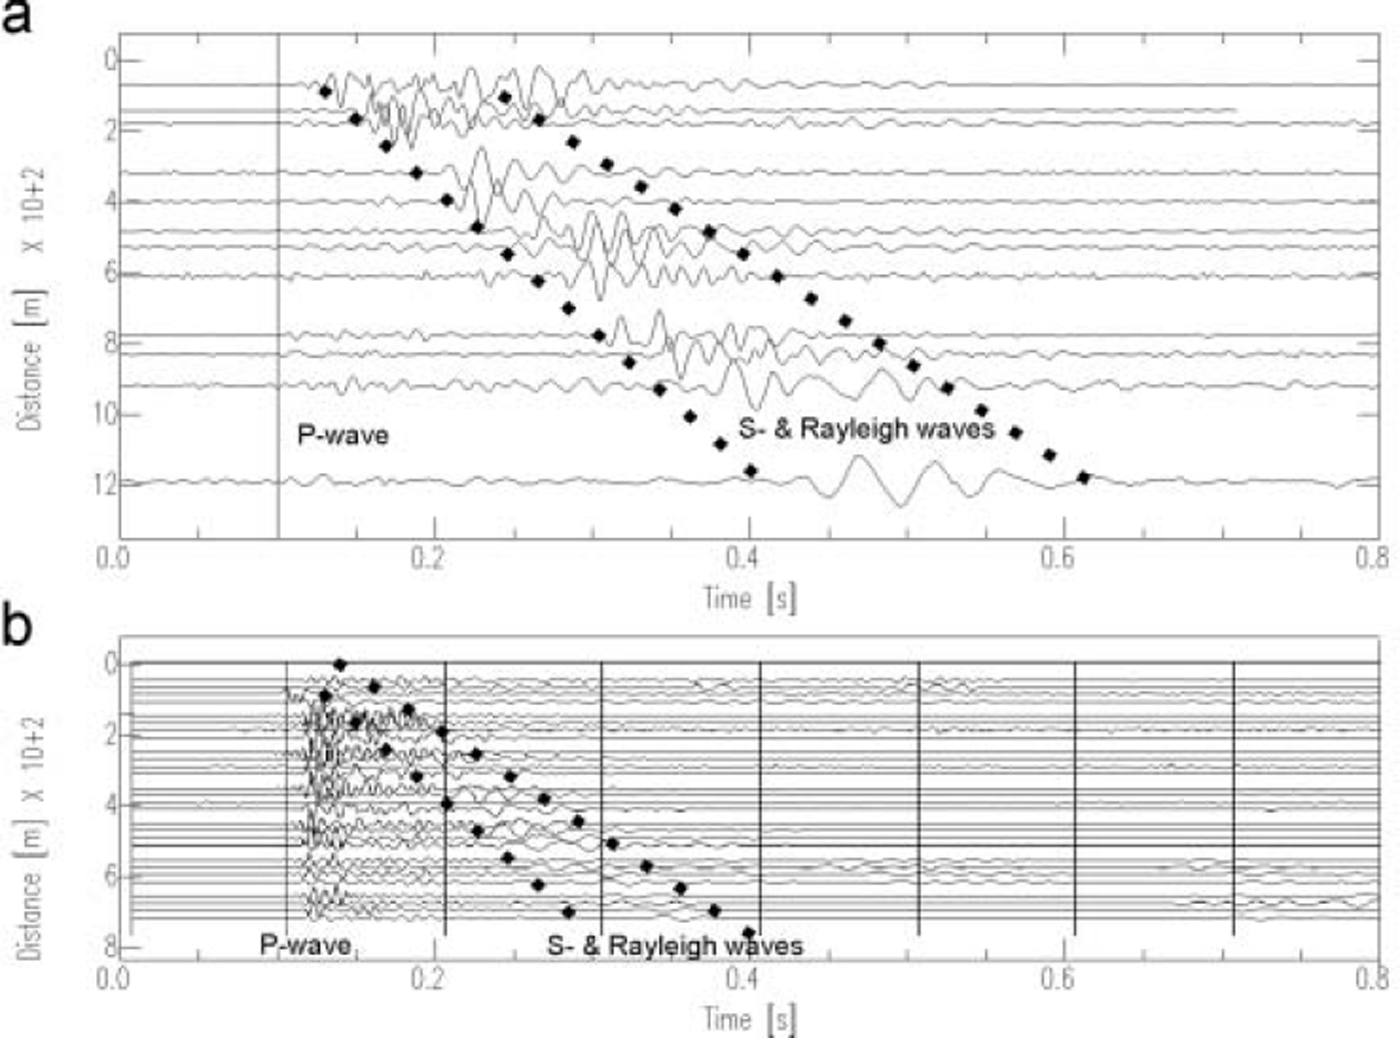
Figure 4a shows a record section of some of the waveforms of type A events against distance, with their P-wave first arrivals set to the same time. The simplicity of the P-waveform indicates simple impulsive sources. We interpret the initial energy of the subsequent higher-amplitude arrivals as the S-wave (see Fig. 3), and the following complex multi-peaked lower-frequency arrivals as Rayleigh surface waves. Rayleigh waves are dispersed (their arrival time is dependent on their frequency) in media where velocity changes with depth as observed in Bakaninbreen (Reference Smith, Murray, Davison, Clough, Woodward and JiskootSmith and others, 2002). This causes their waveform to be extended and multi-peaked. Lateral changes in topography, such as propagation through the surge front, attenuate the shorter wavelengths (higher frequencies) as seen in Figure 4. Further confirmation that these are Rayleigh waves comes from the controlled-source experiment in 1998. In that experiment the seismic source was 90 g of Pentolite explosive placed in a 20m deep shot hole (Reference Smith, Murray, Davison, Clough, Woodward and JiskootSmith and others, 2002), i.e. equivalent to a source at less than one wavelength in depth. Figure 4b shows a vertical-component shot record which clearly displays similar waveform characteristics to the events which we interpret as resulting from shallow sources, including Rayleigh surface waves. In summary, type A events generate Rayleigh surface waves and as such must be at depths shallower than their wavelength, i.e. <60 m, and not icequakes from the base of the glacier. On the other hand, type B and C waveforms show little evidence for the presence of dispersed surface waves and must originate at depths greater than a wavelength; the ice–bed interface is therefore the most likely location.
(a) Waveforms from type A events from sensor 1 plotted as a record section vs distance over 100–1200 m. P-wave first arrivals are all set to a constant time of 0.1 s. Note that the propagation paths of these waveforms will be different and probably traverse the surge front. (b) Record section of waveforms from 90g of explosive placed in a 20 m deep shot hole on a set of vertical sensors plotted over 100–700 m only. Note the Rayleigh surface waves from this shallow shot are similar to those observed from the type A events. P-wave first arrivals are all set to a constant time of 0.1 s.
Results
Seismic events seen on the old analogue play-outs imply that there was a fairly constant emission rate of about 60 events per hour over the 9 days. This rate does not show any diurnal signal or ‘stick–slip’ clustering of emissions. Elsewhere, a correlation between measured glacier movement velocity and seismic emissions has been observed (e.g. Reference Raymond and MaloneRaymond and Malone (1986) on Variegated Glacier, Alaska; Reference GórskiGόrski (1997) on Hansbreen, Svalbard). The implication of our observed emission rate is that there were no major changes in surge velocity over the recording period, which is consistent with results showing progressive velocity changes rather than slip–stick motion during Svalbard surges from remotely sensed data (Reference Murray, Strozzi, Luckman, Jiskoot and ChristakosMurray and others, 2003).
A large variety of waveforms were recorded, ranging from simple to complex, indicative of different physical mechanisms but also distance and depth. Type A icequakes occur either as simple events or as complex multiple interfering waveforms. As described, we interpret these as shallow events from the presence of surface waves. Figure 2 shows our locations of a representative sample of these events. We associate these events with either fracturing of the surge front (see Fig. 1c and d) or the extending crevassed area upstream from this region. We believe that shallow activity on shear zones immediately downstream of the surge front is possible, but less likely. We use a two-fold argument to support this deduction. First, we note that for the majority of these events both locations are either associated with the surge front or upstream from it. Secondly, we note that the waveforms are dominated by low-frequency energy, the frequency content of which reduces with distance. We believe this is due to the complex high-attenuation propagation paths through the fractured and topographically high surge front. The frequency content is in direct contrast to the higher-frequency simple waveforms of type B and C events, which we believe have not traversed the surge front.
The simplicity of type B waveforms and their high-frequency nature is indicative of impulsive sources with homogeneous low-attenuation propagation paths. We interpret the lack of a multi-peaked Rayleigh wave train, and the presence of an impulsive high-amplitude S-wave as implying a deep brittle-fracture source. As such, the two locations for each event in Figure 2 are plotted as if they came from the glacial base at 100 m depth. In reality, plotting them at the surface or at this depth does not significantly change the overall location plot; the locations move together by 50 m on average. Type B events are located either under, or up to 250 m downstream of, the surge front (Fig. 2). In contrast to type A events, none are located upstream of the surge front.
Figure 5 shows two further representative examples of the waveforms of the type C harmonic events, along with their amplitude-frequency spectra. The waveforms represent decaying high-frequency (∼80 Hz) monochromatic sine waves very reminiscent of those caused by resonating magma in fractures associated with volcanoes (e.g. Reference Kumagai and ChouetKumagai and Chouet, 1999). The majority of these events are located downstream of the surge front.
Two different types of harmonic (type C) waveforms together with their spectra: (a) single decaying sinusoid waveform (dominant frequency 80 Hz); (b) double interfering sinusoid (dominant frequencies 50 and 100 Hz);
Discussion
Type A events are shallow. This category provides the majority (80–90%) of the seismic emissions. Similar proportions of shallow to deep sources have been found by workers on other glaciers (e.g. Reference Deichmann, Ansorge, Scherbaum, Aschwanden, Bernardi and GudmundssonDeichmann and others, 2000; Reference Métaxian, Araujo, Mora and LesageMétaxian and others, 2003). Figure 1c and d show the surge front to be highly fractured at this time. The model of Reference MurrayMurray and others (2000) implies that upstream from the surge front there is cold ice (brittle) overlying ductile warm ice and a well-lubricated bed. The 1985 and 1986 radar images imply around 100 m of cold ice overlying 50 m of warm ice (Reference Murray, Dowdeswell, Drewry and FrearsonMurray and others, 1998). Both the locations and the implied shallow depth of the type A icequakes fit with this model; the ductile nature of the warm ice and properties of the bed suggest little seismic energy should be produced from deep within the glacier. A preliminary analysis of some type A waveforms by Reference TailbyTailby (1991) estimated failure lengths of 35–69m by analyzing their spectra and applying the Reference BruneBrune (1970) model for earthquake sources.
The simplicity of the waveforms of type B events is reminiscent of classic deep tectonic earthquake signatures from double couple events. There is a large amount of S-wave energy generated from the icequake radiation pattern. Their high frequency suggests a small amount of attenuation. The majority of the event locations are downstream or within the surge front (Fig. 2). We interpret these as brittle-fracture events at the base of the glacier ahead of the cold-ice–warm-ice interface at the base of the surge front. These locations are consistent with post-surge radar images which show englacial inclined features within and downstream from the surge front. By analogy with anticlinal folds overlying blind thrust faults in rocks there could be a relationship between the location of the fore-bulge and these active features (Reference MitraMitra, 2002).
Type C harmonic events (Fig. 5) appear to occur downstream of or in association with the surge front (Fig. 2). They have monochromatic spectra often indicative of resonance. Reference St. Lawrence and QamarSt. Lawrence and Qamar (1979) attributed low-frequency waveforms to hydraulic transients (essentially acoustic resonance) generated in subglacial conduits. We do not believe that this is an appropriate model for the water system downstream of the surge front where the bed is believed to be cold. Rather, we believe that a fluid-filled crack is a suitable model for generation of these oscillations. The resonant period in a fluid-filled crack is much longer than expected from acoustic resonance due to the presence of slow ‘crack waves’ (Reference ChouetChouet, 1986). Métaxian and others (2000) apply this theory to low-frequency waveforms from the glacier of Cotopaxi volcano, Ecuador. We follow their method to estimate the crack thickness applicable to type C waveforms of 80 Hz dominant frequency. The crack stiffness is defined by C = bL//μd (Reference Chouet, Page, Stephens, Lahr and PowerChouet and others, 1994), where L is the crack length, d the crack thickness and b/ μ is a dimensionless ratio of the bulk modulus of the fluid, taken as water, (2.2 × 10³MPa) over the rigidity of the ice (3.8 × 10³MPa). The value of C depends on the ratio of crack length to crack thickness. If we assume that C is between 100 and 500, following Métaxian and others (2000), we obtain crack thicknesses of 0.08-1 cm by estimating the crack parameters using the crack wave dispersion curves of Reference Chouet, Page, Stephens, Lahr and PowerChouet and others (1994). Alternatively, if we assume a crack thickness between 0.1 and 1 cm, a simple calculation gives a crack length of 10-500cm. Although non-unique, these are reasonable values.
It is accepted that glacier surging requires basal motion, by either sliding or the deformation of basal sediments, over a warm bed (Reference ClarkeClarke, 1987). The propagation of a surge front downstream implies a switch between those basal conditions preventing fast flow and those facilitating it, approximately corresponding spatially with the jump in surface ice velocities at the front. In some models of surging (e.g. thermally regulated models), this is the switch between cold and warm bed; in other models (e.g. hydrologically regulated models such as Reference KambKamb’s (1987) linked-cavity model) this is a switch between different basal hydrological systems. Missing from our previous understanding of the downstream propagation of a surge front is the mechanism by which this switch occurs.
At Bakaninbreen we believe that the bed of the glacier is warm and wet upstream of the surge front and cold downstream of it, and that it is this cold bed that prevents fast flow. However, the major source of extra heat at the bed will be that generated by frictional heating, which is proportional to the product of the basal velocity and the basal shear stress (Reference PatersonPaterson, 1994). The obvious question is then how the cold bed downstream of the surge front can start to slide and therefore this heat can be generated. From the harmonic deep events, detected downstream of the surge front and associated with water (or possibly with wet sediments), it appears that deep fracture processes allow water to be injected 100–250m in advance of the surface expression of the front, providing potentially both lubrication and heat to the region of cold bed. These events appear also to be intimately associated with simple impulsive deep faulting events downstream of the front. Radar images show thrust-like features upstream and downstream of the surge front with identifiable displacement in some cases (Reference MurrayMurray and others, 2000). It is likely that the acoustic emissions detected are associated with the activity of these faults (Fig. 6).
Summary cartoon of results modified from Reference MurrayMurray and others (2000). Type A events are interpreted as shallow events from upstream of the surge front associated with shallow faulting and crevassing; type B and C events originate from downstream of the surge front. Type B events are simple impulsive events, and type C events are associated with resonance within fluid-filled cracks.
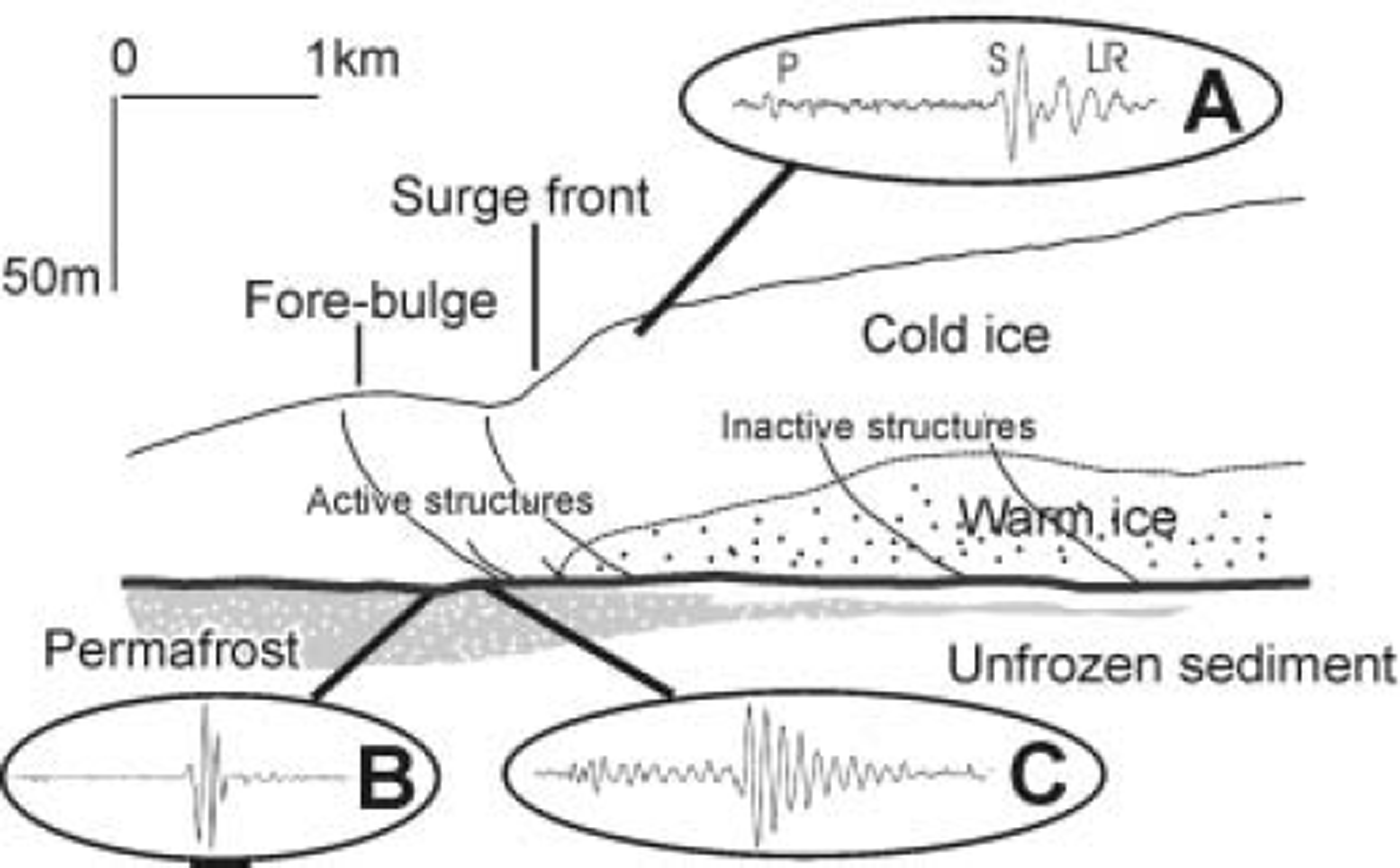
In contrast to the emissions from downstream of the surge front, little demonstrable acoustic energy comes from the base of the glacier upstream of it despite the high rates of flow. This result implies a high degree of decoupling of ice from the bed during surging. It is similar to results from Whillans and Kamb Ice Streams (former Ice Streams B and C), West Antarctica, where few events are detected from beneath the fast-flowing Whillans Ice Stream, whereas the slow-moving Kamb Ice Stream generates many events (Reference Anandakrishnan and BentleyAnandakrishnan and Bentley, 1993). At Bakaninbreen the lack of deep events suggests that the thrust-like faults observed on radar images are inactive (or well lubricated) upstream of the surge front (Fig. 6). In this way, the geometry of the glacier strongly resembles that of a classic geologic thrust belt.
Conclusions
We describe the seismic emissions recorded immediately downstream of the surge front of Bakaninbreen during an active surge stage in April 1987. The waveforms are divided into three main categories:
1. those from shallow icequakes, thought to be related to faulting at or close to the glacier surface (<60m) resulting from surface fracture or faults on the surge front itself, the waveforms of which have P-waves and S-waves with low-frequency surface waves;
2. those from events thought to come from the glacier bed with well-developed simple high-frequency S-waves; and
3. harmonic events thought to be due to resonance in water-filled cracks close to the glacier base.
Despite only two sensors working, making the location of the sources non-unique, the events are consistently located according to their waveform categories. Most of the energy is associated with type A events, which locate either along or upstream from the surge front. We argue that these events are shallow events. The low proportion of seismic energy interpreted to originate at the glacier base upstream of the surge front suggests that basal decoupling is so efficient that fast flow does not involve a significant amount of elastic energy release. The simple deep and harmonic events locate 100–200 m downstream of the surge front and are associated with brittle deformation of cold ice and with resonance in water-filled cracks respectively. We believe the basal events are related to the activation of stagnant ice downstream of the surge front, which allows water to access the bed and provides the mechanism for its downstream propagation.
Acknowledgements
BP originally sponsored the collection of the data which were collected by I. Bishop (Reference BishopBishop, 1993) and N. Riley of BP; both are thanked for their enthusiasm in helping to resurrect these data. The field data presented in Figure 4b were collected for a UK Natural Environment Research Council-funded project ROPA GR3/R9757, awarded to Leeds University and the British Antarctic Survey. A. Smith and B. Benjumea are thanked for improving the paper with their reviews.



