1. Introduction
Stable isotopes in pedogenic carbonates have been applied to reconstruct paleoclimates due to their high sensitivity to the formation conditions of pedogenic carbonates, such as nodules, is related to climatic conditions (Luo et al. Reference Luo, Liu and An2024). The main source of stable carbon isotopes in pedogenic carbonates is the carbonate ions from soil CO2 (Cerling Reference Cerling1984). The relative abundance of C3 and C4 plants in the local vegetation controls the δ13C value of pedogenic carbonates. C3 plants consist of trees, shrubs, and cool-season grasses growing in various environmental conditions. C4 plants mainly exist in the tropical warm season, including grasses and shrubs (Cerling Reference Cerling, Sage and Monson1999). The difference in the photosynthetic pathways between C3 and C4 plants causes the variation in the isotopic composition of carbon, and 13C fractionation occurs by rhizorespiration. The isotopic fractionation of carbon occurred due to molecular diffusion and carbonate equilibria, resulting in the carbon isotope composition of pedogenic carbonate contributed by pure C3 plants and pure C4 plants to be –13‰ and +1‰, respectively (Boutton Reference Boutton, Coleman and Fry1991). Stable oxygen isotopes in pedogenic carbonates are mainly controlled by soil water and temperature, and the δ18O value in pedogenic carbonate is well correlated with the isotopic composition of local meteoric water; thus, it can reflect air temperature (Cerling Reference Cerling1984; Nordt Reference Nordt, Goldberg, Holliday and Ferring2001). The air temperature was then estimated using the empirical formula based on the δ18O value (Dworkin et al. Reference Dworkin, Nordt and Atchley2005; Hyland and Sheldon Reference Hyland and Sheldon2013). Hence, these stable isotope compositions supported the paleoclimatic conditions (Kelson et al. Reference Kelson, Huth, Andrews, Bartleson, Cerling, Jin, Salinas and Levin2025).
Carbonate nodules, hard masses formed within the soil, are pedogenic carbonates and typically exist as irregular or rounded shapes (Barta Reference Barta2011). The diameter of carbonate nodules tended to increase with the radiocarbon age (Retallack Reference Retallack2005), which may indicate carbonate accumulation over time. Ca from parent material and carbonate ions from soil CO2 are translocated to the subsoils through leaching processes, then precipitate as pedogenic carbonate due to a decrease in CO2 partial pressure and moisture in the soil (Zamanian et al. Reference Zamanian, Pustovoytov and Kuzyakov2016). Carbonate nodules are commonly found in relatively dry areas with high evapotranspiration rates, predominantly arid, semiarid, and subhumid regions (Srivastava Reference Srivastava2001). Thus, typical soil types that contain pedogenic carbonates include Vertisols, Mollisols, Aridisols, and Alfisols (Alonso-Zarza and Wright Reference Alonso-Zarza and Wright2010). Additionally, stable carbon and oxygen isotopes of pedogenic carbonate have been widely used as a proxy for paleoclimate interpretation. In the Teotihuacan Valley in Mexico, the δ13C value of pedogenic carbonates in paleosols illustrates the mixture of C3 and C4 plants in the Pleistocene, shifting toward C4 plants during the Holocene; however, the δ18O value reveals an increase in temperature during the Pleistocene to late Holocene (Valera Fernandez et al. Reference Valera Fernandez, Solleiro Rebolledo, Sedov and Pustovoitov2022). Valera Fernandez et al. (Reference Valera Fernandez, Solleiro Rebolledo, Sedov and Pustovoitov2022) also established the time frames for the formation of pedogenic carbonates based on radiocarbon dating. For the formation of pedogenic carbonate, compared to a hot and dry climate, carbonate nodules can also be formed under lower air temperature and in a humid tropical climate. In Myanmar, soil carbonate formed during the dry season (winter to early spring) with lower temperatures (Licht et al. Reference Licht, Kelson, Bergel, Schauer, Petersen, Capirala, Huntington, Dupont-Nivet, Win and Aung2022). The δ13C value in the carbonate nodules supported that the primary carbon source of C3 plants in the forested soils of central Tennessee, USA (Railsback Reference Railsback2021). The value of δ13C in calcrete from the Lucknow area of the Ganga Basin in India implied a 69.2% contribution from C4 plants and a stronger effect of the monsoon climate during the Quaternary, as indicated by the more negative δ13C values (Prasanna et al. Reference Prasanna, Amrita, Amal, Anupam, Chandra, Kamlesh, Paul and Pawan2025). Hence, the stable isotope composition of pedogenic carbonate is useful for interpreting the global paleoclimate.
Climofunctions were applied to reconstruct the precipitation with various geological settings (Gillot et al. Reference Gillot, Cojan and Badia2022). The climofunction between the mean annual precipitation (MAP) and depth to the B horizon with secondary carbonates (Bk horizon) was established to interpret precipitation during the formation of pedogenic carbonates (Retallack Reference Retallack2005). MAP and the mean annual temperature (MAT) were also estimated by the climofunctions with bulk geochemistry of the B horizon to reconstruct the past precipitation and temperature (Gillot et al. Reference Gillot, Cojan and Badia2022; Sheldon et al. Reference Sheldon, Retallack and Tanaka2002). This was based on the soil chemical weathering enhanced by precipitation and temperature via hydrolysis (Sheldon et al. Reference Sheldon, Retallack and Tanaka2002). Furthermore, climofunctions with bulk geochemistry can eliminate the limitation of the application to the truncated paleosols. Climofunctions of MAT related to the soil base ratio (CaO and K2O) and MAP related to the clayeness ratio (Al2O3/SiO2) were established, respectively, by modern alluvial soils in Spain (Gillot et al. Reference Gillot, Cojan and Badia2022). MAT estimated by these climofunctions in paleosols in southern France and central Spain was consistent with the estimation from paleofloras, and MAP can correspond to the climofunction related to depth to the Bk horizon (Gillot et al. Reference Gillot, Cojan and Badia2022).
Taiwan is a humid and tropical island in eastern Asia, but carbonate nodules commonly exist in the subsoils of alluvial plains in the southwestern regions of the island (Chen et al. Reference Chen, Hseu and Tsai2015a). During the Holocene, these regions were impacted by marine transgression and regression (Chen and Yang Reference Chen and Yang2012). The soil genesis proceeded stably after marine regression, thus generating a soil chronosequence. Carbonate nodules typically form under high evapotranspiration conditions; however, the modern humid climate of Taiwan may not be favorable to the precipitation of carbonates. Therefore, this study hypothesized that these carbonate nodules are relictic pedofeatures formed under past climatic conditions. This aspect warrants further support by an integrated approach, including stable isotopic composition in carbonate nodules and pedological analyses. Hence, the objectives of this study were to (1) establish the formation ages of carbonate nodules by radiocarbon analysis and (2) reconstruct the paleoclimate from the stable carbon and oxygen isotope composition of the carbonate nodules from a chronosequence soil in southwestern Taiwan.
2. Study area
Taiwan lies between the convergence boundary of the Eurasian continental plate and the Philippine Sea plate (Chen and Liu Reference Chen and Liu2000). The changes in the coastal environment around Taiwan were caused by the accumulation of sediment from the orogenic belt, rising sea levels due to a warming climate, and crustal changes resulting from orogeny during the Quaternary (Chen and Yang Reference Chen and Yang2012). Sea levels in Taiwan were consistent with global trends since the late Holocene (Chen and Liu Reference Chen and Liu1996). The overall coastal changes in Taiwan from 20 ka to 6 ka were characterized by transgression due to rising sea levels. However, the sea level has not changed significantly since approximately 6 ka, with fluctuations not exceeding 0.3 to 0.5 meters. The higher sedimentation rate in Taiwan results in a relative decrease in sea level, leading to coastal regression (Chen and Yang Reference Chen and Yang2012).
3. Materials and methods
3.1 Soil sampling
In this study, we collected soil horizon samples from four profiles with different ages of shoreline changes, corresponding to the transgression and regression phases of sea level (Chen and Yang Reference Chen and Yang2012), thereby forming a chronosequence of soils. The sampling sites were located in Kaohsiung City, southwestern Taiwan (Table S1), and the parent materials of all soil profiles were interstratified sandstone and shale. The sampling sites with transgression and regression phases had been described in detail in Hum et al. (Reference Hum, Chu, Huang, Zehetner and Hseu2026), which investigated the same study area. The climate is sub-humid tropical, with a mean annual temperature of 24.7 °C and a mean annual precipitation of 1829 mm (based on data from 1931 to 2022). Four profiles with carbonate nodules were sampled and coded as pedons KS1, KS2, KS3, and KS4, respectively. Bulk soil samples from each horizon and the corresponding carbonate nodules were collected for this study. The age of shoreline change at pedon KS1 was estimated to be 10,000 years before present (years BP), situated above the transgression phase of 10,000 years BP. The age of shoreline change at pedon KS2 was 8000 years BP, situated above the transgression phase of 8000 years BP. The age of shoreline change at pedon KS3 was 5000 years BP, situated above the regression phase at 5000 years BP. The age of shoreline change at pedon KS4 was 3000 years BP, situated above the regression phase of 3000 years BP. The age of shoreline changes was determined by radiocarbon dating of drill cores and referred to as the transgression and regression phases (Chen and Yang Reference Chen and Yang2012). The soils were assumed to have developed stably after marine regression. These pedons were classified as Inceptic Haplustalf for pedon KS1, Ultic Haplustalfs for pedons KS2 and KS3, and Kanhaplic Haplustalf for pedon KS4 according to the Keys to Soil Taxonomy (Soil Survey Staff 2022). All pedons were classified as Haplic Lixisols in the IUSS Working Group WRB (2022).
The morphological characteristics of the studied pedons were described in the field, including Munsell color (moist), texture, structure, consistence, roots, clay coating, and carbonate nodules (Schoeneberger et al. Reference Schoeneberger, Wysocki and Benham2012). The carbonate effervescence was determined using a 1:10 dilute hydrochloric acid solution (HCl: water; Birkeland Reference Birkeland1984). The stage of carbonate morphology in nongravelly soils was described according to Gile et al. (Reference Gile, Peterson and Grossman1966) and Machette (Reference Machette and Wade1985).
The carbonate nodules were washed with distilled water to remove soil residues after being separated from the bulk soils. The abundance of carbonate nodules (weight %) in all horizon was calculated as the weight of carbonate nodules divided by the weight of the bulk soil. The carbonate nodule samples were then air-dried, ground, and passed through a <63 μm sieve. Preliminary tests indicated that organic matter in the carbonate nodules may interfere with the measurement of stable carbon and oxygen isotopes. To eliminate potential signal interference in the measurement of stable carbon and oxygen isotopes, organic matter in the powder of carbonate nodules was removed using 3% hydrogen peroxide (H2O2) at room temperature (Magaritz et al. Reference Magaritz, Kaufman and Yaalon1981). The carbonate nodule powder was separated using a 0.45 μm filter paper, and the filtrated sample was rinsed with distilled water to remove excess H2O2. Finally, the carbonate nodule powder was air-dried and prepared for the determination of stable carbon and oxygen isotopes.
3.2 Description of micromorphological characteristics
Undisturbed soil blocks were sampled using Kubiena boxes, and thin sections (30 μm thick) with vertical orientation were prepared by Spectrum Petrographics (Vancouver, WA, USA). Micromorphological characteristics of the thin sections were observed with a polarized microscope (DM2500, Leica, Wetzlar, Germany) and described according to Stoops (Reference Stoops2003).
3.3 Radiocarbon dating
The radiocarbon dating of the carbonate nodule sample was determined by accelerator mass spectrometry (AMS) on inorganic carbon at NTUAMS Lab, Department of Geology, National Taiwan University, Taipei, Taiwan. The sample was first acid-washed, washed with water, and then dried. The purified CO2 was synthesized into graphite using the zinc reduction method under a vacuum. The graphite is then pressed into a target and placed in an accelerator for measurement. The accelerator mass spectrometer model is HVE 1.0MV Tandetron Model 4110 BO (High Voltage Engineering Europa B.V., Amersfoort, Utrecht, Netherlands). OxII (SRM 4990 C) was used as a standard reference material of oxalic acid to verify the accuracy of measurement. The date was calibrated using the IntCal20 calibration curve. The radiocarbon age was expressed in Before Present (BP), and the present is AD 1950.
3.4 Analysis of stable carbon and oxygen isotopes
The analysis of stable C and O isotopes in carbonate nodules was performed by an automated carbonate preparation device (Kiel IV Carbonate Device, Thermo Scientific, Waltham, Massachusetts, US) and an isotope ratio mass spectrometry (IRMS; Thermo Fisher Delta V Advantage, Waltham, Massachusetts, USA) system. The nodule sample (<63 μm) was placed in a reaction vial, and five drops of 100% phosphoric acid were added to the sample to react with carbonate at 70 °C. NBS-19 was used as an isotopic reference material to examine the accuracy of the analysis and to calibrate the unknown samples. The analytical precision for reference material was better than ±0.03‰ (1σ) for both δ1 3C and δ1⁸O. An internal working standard was analyzed repeatedly to monitor the instrument stability, and the analytical precision was ±0.05‰ (1σ) for both δ1 3C and δ1⁸O. δ13C and δ18O values in carbonate nodules are reported in permil (‰) with respect to Vienna Peedee Belemnite (VPDB). The proportion of the contribution of carbon from C4 plants to carbonate is calculated by Eqn. 1 (Sarangi et al. Reference Sarangi, Agrawal and Sanyal2021). The two end-member isotopic values are –13‰ and +1‰ for pure C3 and pure C4 components, respectively (Nordt and Holliday Reference Nordt, Holliday and Gilbert2022):
 $C4\;\left( \% \right) = \left[ {\left( {{\delta ^{13}}{C_{sample}} - {\delta ^{13}}{C_{C3}}} \right)/\left( {{\delta ^{13}}{C_{C4}} - {\delta ^{13}}{C_{C3}}} \right)} \right] \times 100\%$
3.5 Estimation of paleotemperature and precipitation
Mean annual temperature (MAT) was estimated based on the empirical relationship between temperature and water/calcite in modern soils (R2 = 0.57; Eqn. 2; Hyland and Sheldon Reference Hyland and Sheldon2013). The mean annual precipitation (MAP) was calculated using the geochemical climofunction, an empirical formula that relates MAP to the chemical index of alteration without K (CIA-K) in the Bt horizon (R2 = 0.72; Eqn. 3; Sheldon et al. Reference Sheldon, Retallack and Tanaka2002). The calculation for CIA-K is given in Eqn. 4. The calculation of MAP was applied only to the B horizon, which showed a stronger relationship between MAP and CIA-K than to the A and C horizons. This empirical formula was derived from modern soils in North America covering a wide range of parent materials (volcanic ash, felsic, mafic, and loess), vegetation types (grasslands, broadleaf woodlands, and conifer forests), and soil formation times. This climofunction had a wider range of MAP, from 200 mm to 1600 mm. Besides, the studied soils were not included in the soils that were not suitable for this climofunction, such as arid soils with evaporite minerals, and soils with highly weathered minerals, including kaolinite, boehmite, and gibbsite (Sheldon et al. Reference Sheldon, Retallack and Tanaka2002). Besides, parent materials may affect the absolute CIA-K values; therefore, the application of this climofunction is to interpret the relative trends rather than absolute values.
Regarding elemental composition of the studied soils, the soil samples were digested with HF-HNO3 (US Environmental Protection Agency 1996). 2 mL of HF and 6 mL of HNO3 were added to 0.2 g of the soil sample in a Teflon vessel. The digestion of the samples was assisted by a microwave oven system (Speedwave Entry, Berghof, Eningen, Germany). The microwave program was set to 180 °C for 10 min, then maintained for an additional 10 min. After digestion, the digested solutions were diluted and filtered through a 0.45 μm filter. The concentration of Al, Ca, and Na in the final solution was detected by inductively coupled plasma optical emission spectrometry (ICP-OES; Optima 2100DV, Perkin Elmer, Waltham, MA, USA).
 $MAT\;\left( \rm{{^oC}} \right)\; = \left( {1.1415 \times \delta {1^{18}}{{\it{0}}_{sample}}} \right)\; + \;20.805$
 $MAP\;\left( {mm} \right) = 221\;{e^{0.0197\left( {CIA - K} \right)}}$
 $CIA - K = \;\frac{{A{l_2}{O_3}}}{{A{l_2}{O_3} + CaO + N{a_2}O}} \times 100$
4. Results
4.1 Morphological characteristics
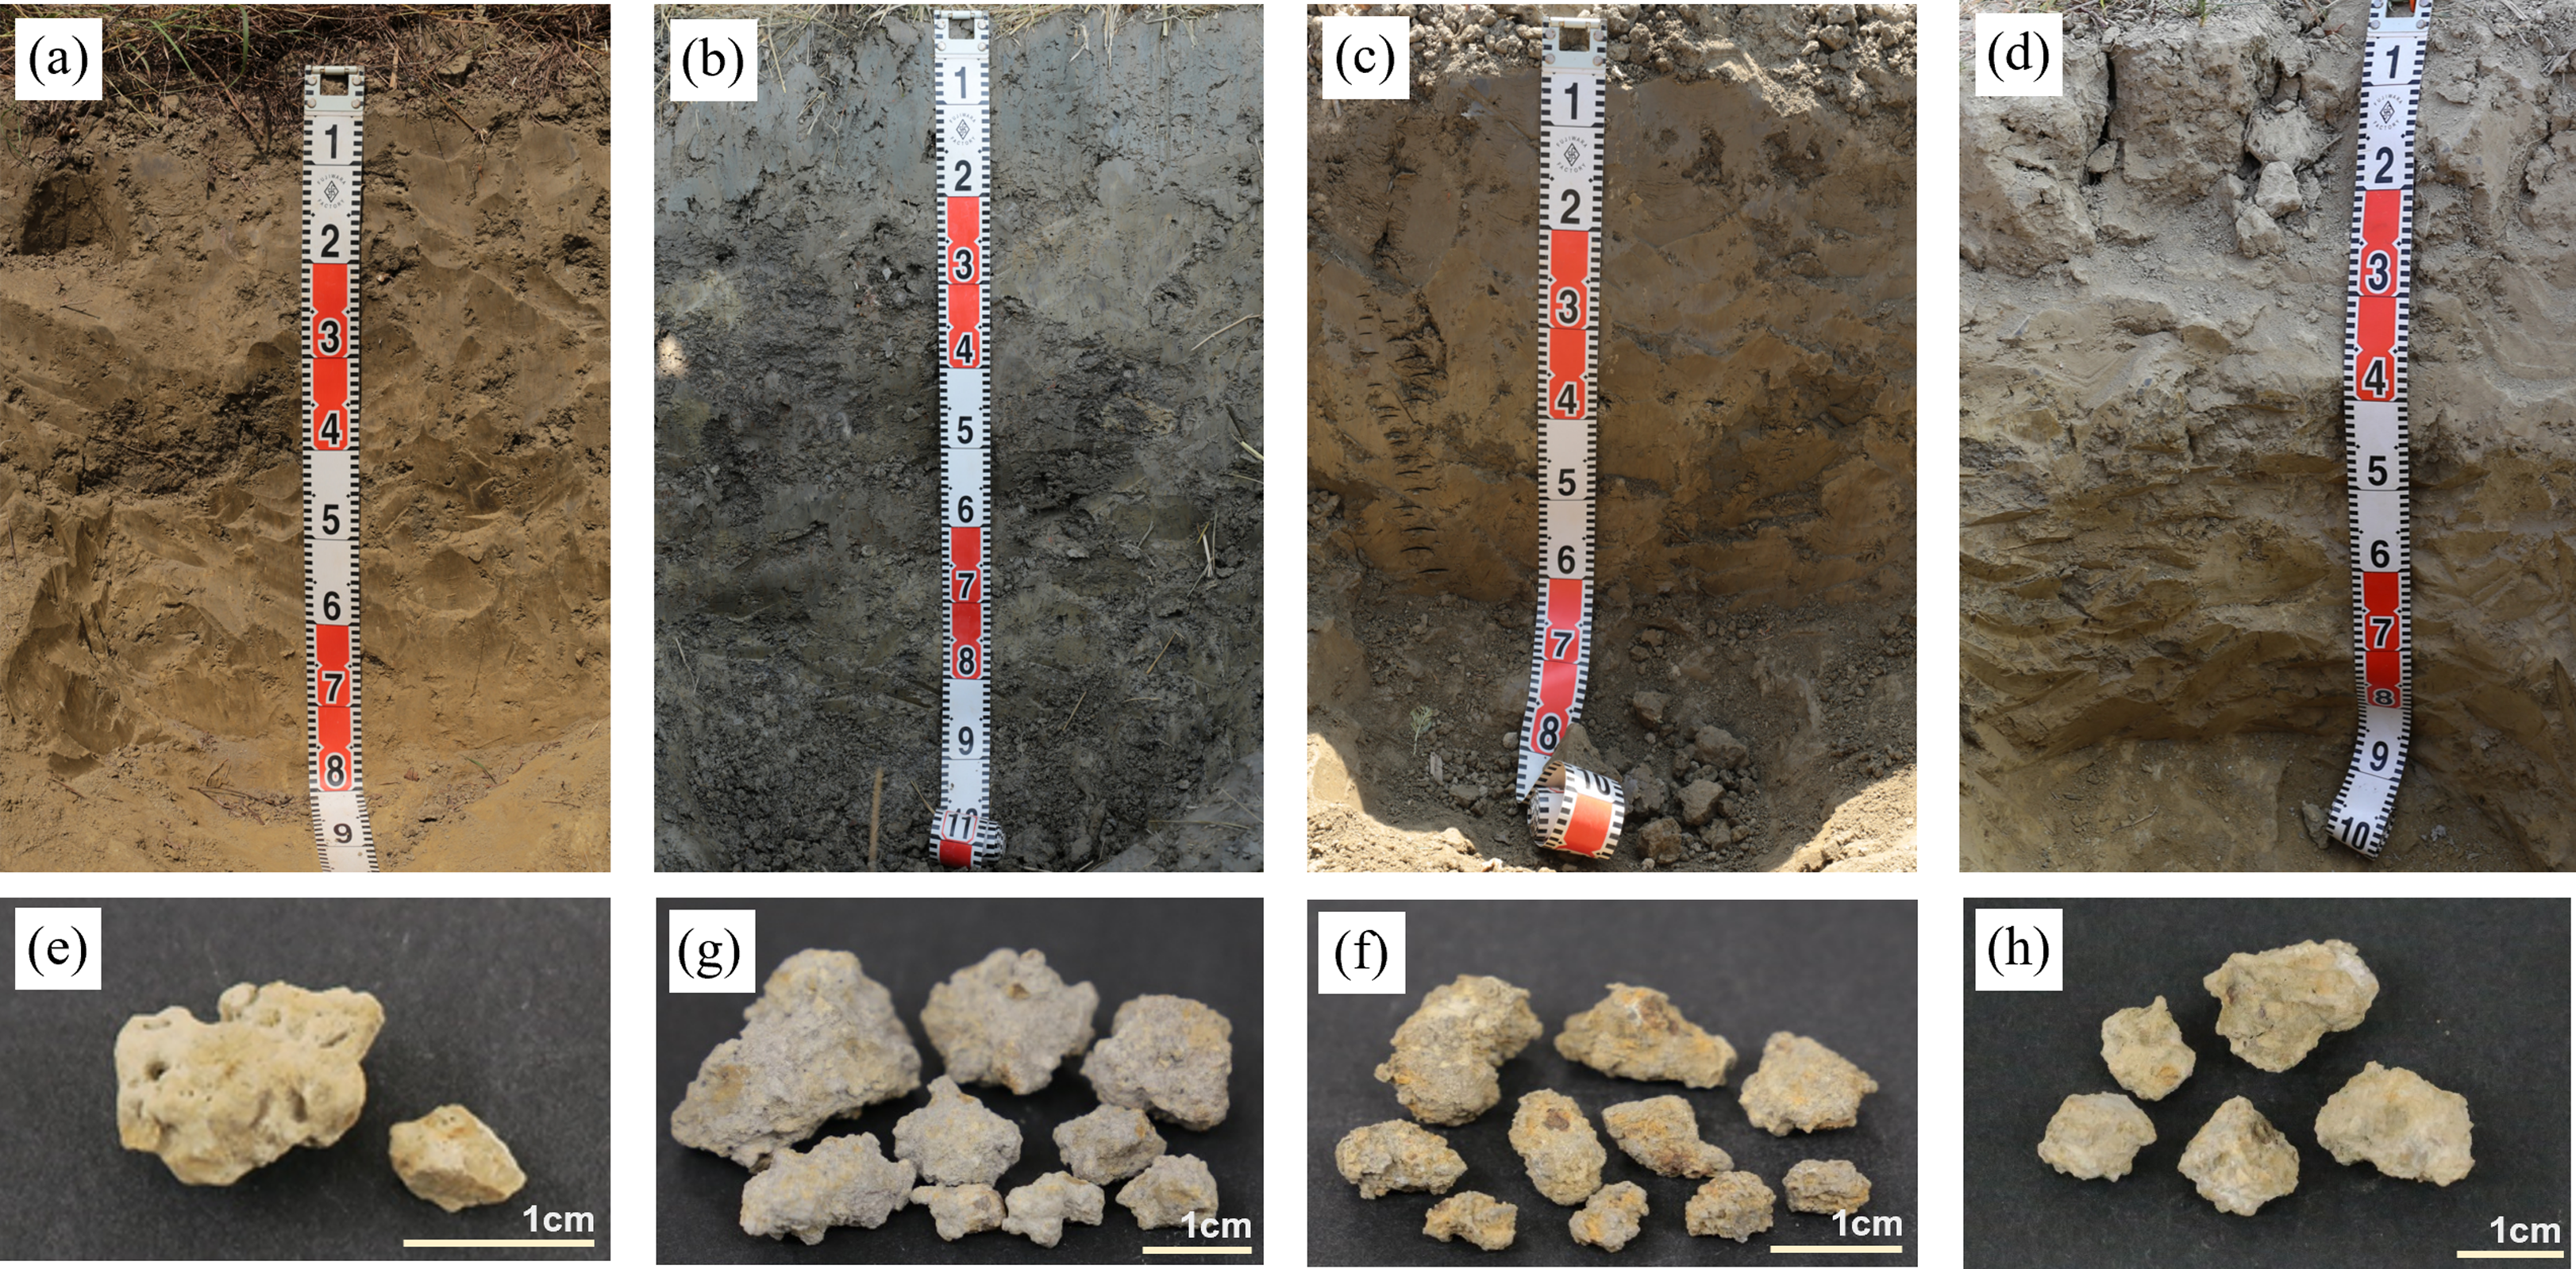
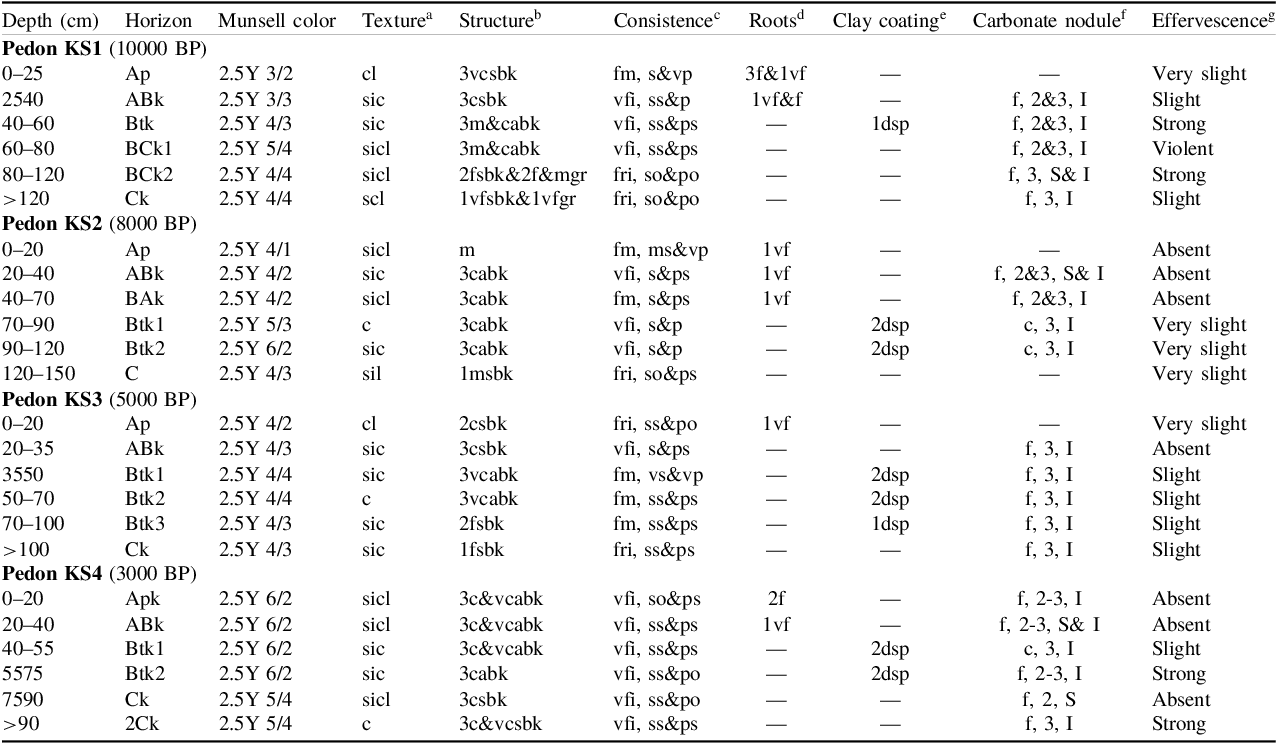
Figure 1 lists the photographs of the studied soil profiles corresponding to their carbonate nodules, and the field morphological characteristics are listed in Table 1. The texture classes of pedon KS1 ranged from sandy loam to silty clay loam. The structures were angular blocky in the Btk horizon and were subangular blocky and granular in the Ck horizon. Few distinct clay coatings were observed on the surface along pores in the Btk horizon of pedon KS1. Carbonate nodules were found in this pedon except for the Ap horizon. There were a few (<2% of the covered soil surface area) irregular shapes of carbonate nodules in the pedon KS1. The spherical shape of carbonate nodules was also found in the BCk2 horizon. The effervescence was very slight to violent in pedon KS1 (Table 1). The texture classes of pedon KS2 ranged from silty loam to clay. The structure was massive in the Ap horizon and was subangular blocky to angular blocky in other horizons. Common clay coatings on the surface along the pores were observed in the Btk1 and Btk2 horizons of pedon KS2. Carbonate nodules were observed in the ABk, BAk, Btk1, and Btk2 horizons. Few to common (2 to 20% of the covered soil surface area) carbonate nodules with irregular shapes were found in this pedon, and spherical shapes of carbonate nodules were found in the ABk horizon. The effervescence was absent in the upper horizons (Ap, ABk, and BAk horizons). However, carbonate nodules were observed in the ABk and BAk horizons. Therefore, the suffix “k” was assigned to these horizons to indicate the presence of pedogenic carbonate accumulation. The effervescence was very slight in the lower horizons (Btk1, Btk2, and C horizon). The textures of pedon KS3 ranged from clay loam to clay. The structures were subangular blocky to angular blocky. Few to common distinct clay coatings were discerned on the surface along pores in the Btk1, Btk2, and Btk3 horizons of pedon KS3. Except for the Ap horizon, carbonate nodules were observed in all horizons of pedon KS3. Few irregularly shaped carbonate nodules were found in this pedon. The effervescence was absent in the ABk horizon of pedon KS3, but carbonate nodules were present in this horizon. Accordingly, the suffix “k” was assigned to this horizon. The effervescence was very slight to slight in other horizons of pedon KS3. For pedon KS4, the textures ranged from silty clay loam to clay. The structures were subangular blocky to angular blocky. Common, distinct clay coatings were observed on the surface along pores in the Btk1 and Btk2 horizons. Carbonate nodules were found in all horizons of pedon KS4. Few to common carbonate nodules with irregular shapes were found in this pedon, and carbonate nodules with spherical shapes were observed in the ABk and Ck horizons. The effervescence was absent in the Apk, ABk, and Ck horizons, but was slight to strong in other horizons. The stage of carbonate morphology in all pedons was stage II, characterized by few to common carbonate nodules in the soil and a noncalcareous to slightly calcareous soil matrix.
Photographs of the field morphological characteristics of the studied soil profiles (a to d) and carbonate nodules (e to h). (a) Pedon KS1; (b) pedon KS2; (c) pedon KS3; (d) pedon KS4; (e) carbonate nodules from BCk2 horizon (80–120 cm) of pedon KS1; (f) carbonate nodules from BAk horizon (40–70 cm) of pedon KS2; (g) carbonate nodules from Btk3 horizon (70–100 cm) of pedon KS3; (h) carbonate nodules from Btk1 horizon (40–55 cm) of pedon KS4.

Figure 1. Long description
The image consists of eight sub-images. The first four sub-images (a to d) display vertical cross-sections of soil profiles labeled as pedon KS1, pedon KS2, pedon KS3, and pedon KS4 respectively. Each soil profile is measured with a ruler marked in centimeters, showing distinct layers and textures. The next four sub-images (e to h) present close-up views of carbonate nodules collected from specific horizons of the soil profiles. Sub-image (e) shows carbonate nodules from the BCk2 horizon (80 to 120 centimeters) of pedon KS1. Sub-image (f) displays carbonate nodules from the BAk horizon (40 to 70 centimeters) of pedon KS2. Sub-image (g) features carbonate nodules from the Btk3 horizon (70 to 100 centimeters) of pedon KS3. Sub-image (h) illustrates carbonate nodules from the Btk1 horizon (40 to 55 centimeters) of pedon KS4. Each set of nodules varies in size and shape, providing a detailed view of their morphological characteristics.
Field morphological characteristics of the studied soils.

Table 1. Long description
The table presents a detailed comparison of soil profiles for four pedons (KS1, KS2, KS3, KS4) at different depths and time periods, measured in centimeters before present (BP). Each pedon is analyzed across various horizons, with attributes including Munsell color, texture, structure, consistency, roots, clay coating, carbonate nodules, and effervescence. Pedon KS1, dating to 10000 BP, shows textures ranging from sandy loam to silty clay loam, with structures varying from angular blocky in the Btk horizon to subangular blocky and granular in the Ck horizon. Carbonate nodules are present except in the Ap horizon, with effervescence ranging from very slight to violent. Pedon KS2, from 8000 BP, has textures from silty loam to clay, with massive structures in the Ap horizon and subangular to angular blocky structures in other horizons. Clay coatings are common in the Btk1 and Btk2 horizons, and effervescence varies from absent in upper horizons to very slight in lower horizons. Pedon KS3, dated to 5000 BP, exhibits textures from clay loam to clay, with subangular to angular blocky structures and common clay coatings in the Btk horizons. Effervescence is absent in the ABk horizon but very slight to slight in other horizons. Pedon KS4, from 3000 BP, has textures ranging from silty clay loam to clay, with subangular to angular blocky structures and common clay coatings in the Btk horizons. Effervescence is absent in the Apk, ABk, and Ck horizons but slight to strong in other horizons. The table highlights the presence of carbonate nodules and varying degrees of effervescence across different soil horizons and time periods.
a cl: clay loam; sic: silty clay; sicl: silty clay loam; scl: sandy clay loam; c: clay; sil: silty loam.
b (Grade: 1: weak; 2: moderate; 3: strong); (Size: f: fine, m: medium, c: coarse, vc: very coarse); (Type: gr: granular, sbk: subangular blocky, abk: angular blocky, m: massive).
c (Rupture resistance: vfi: very firm, fm: firm, fri: friable); (Stickiness: so: non-sticky, ss: slightly sticky, s: moderately sticky, vs: very sticky); (Plasticity: po: non-plastic, ps: slightly plastic, p: moderately plastic, vp: very plastic).
d (Quantity: 1: few, 2: common, 3: many); (Size: vf: very fine, f: fine).
e (Amount: 1: few; 2: common); (Distinctness: d: distinct); (Location: sp: on surface along pores).
f (Quantity: f: few; c: common); (Size: 2: medium; 3: coarse); (Shape: I: irregular; S: spherical).
g (Class: Very slight: few bubbles seen; slight: bubbles readily seen; strong: bubbles form low foam; violent: thick foam forms quickly).
— not determined.
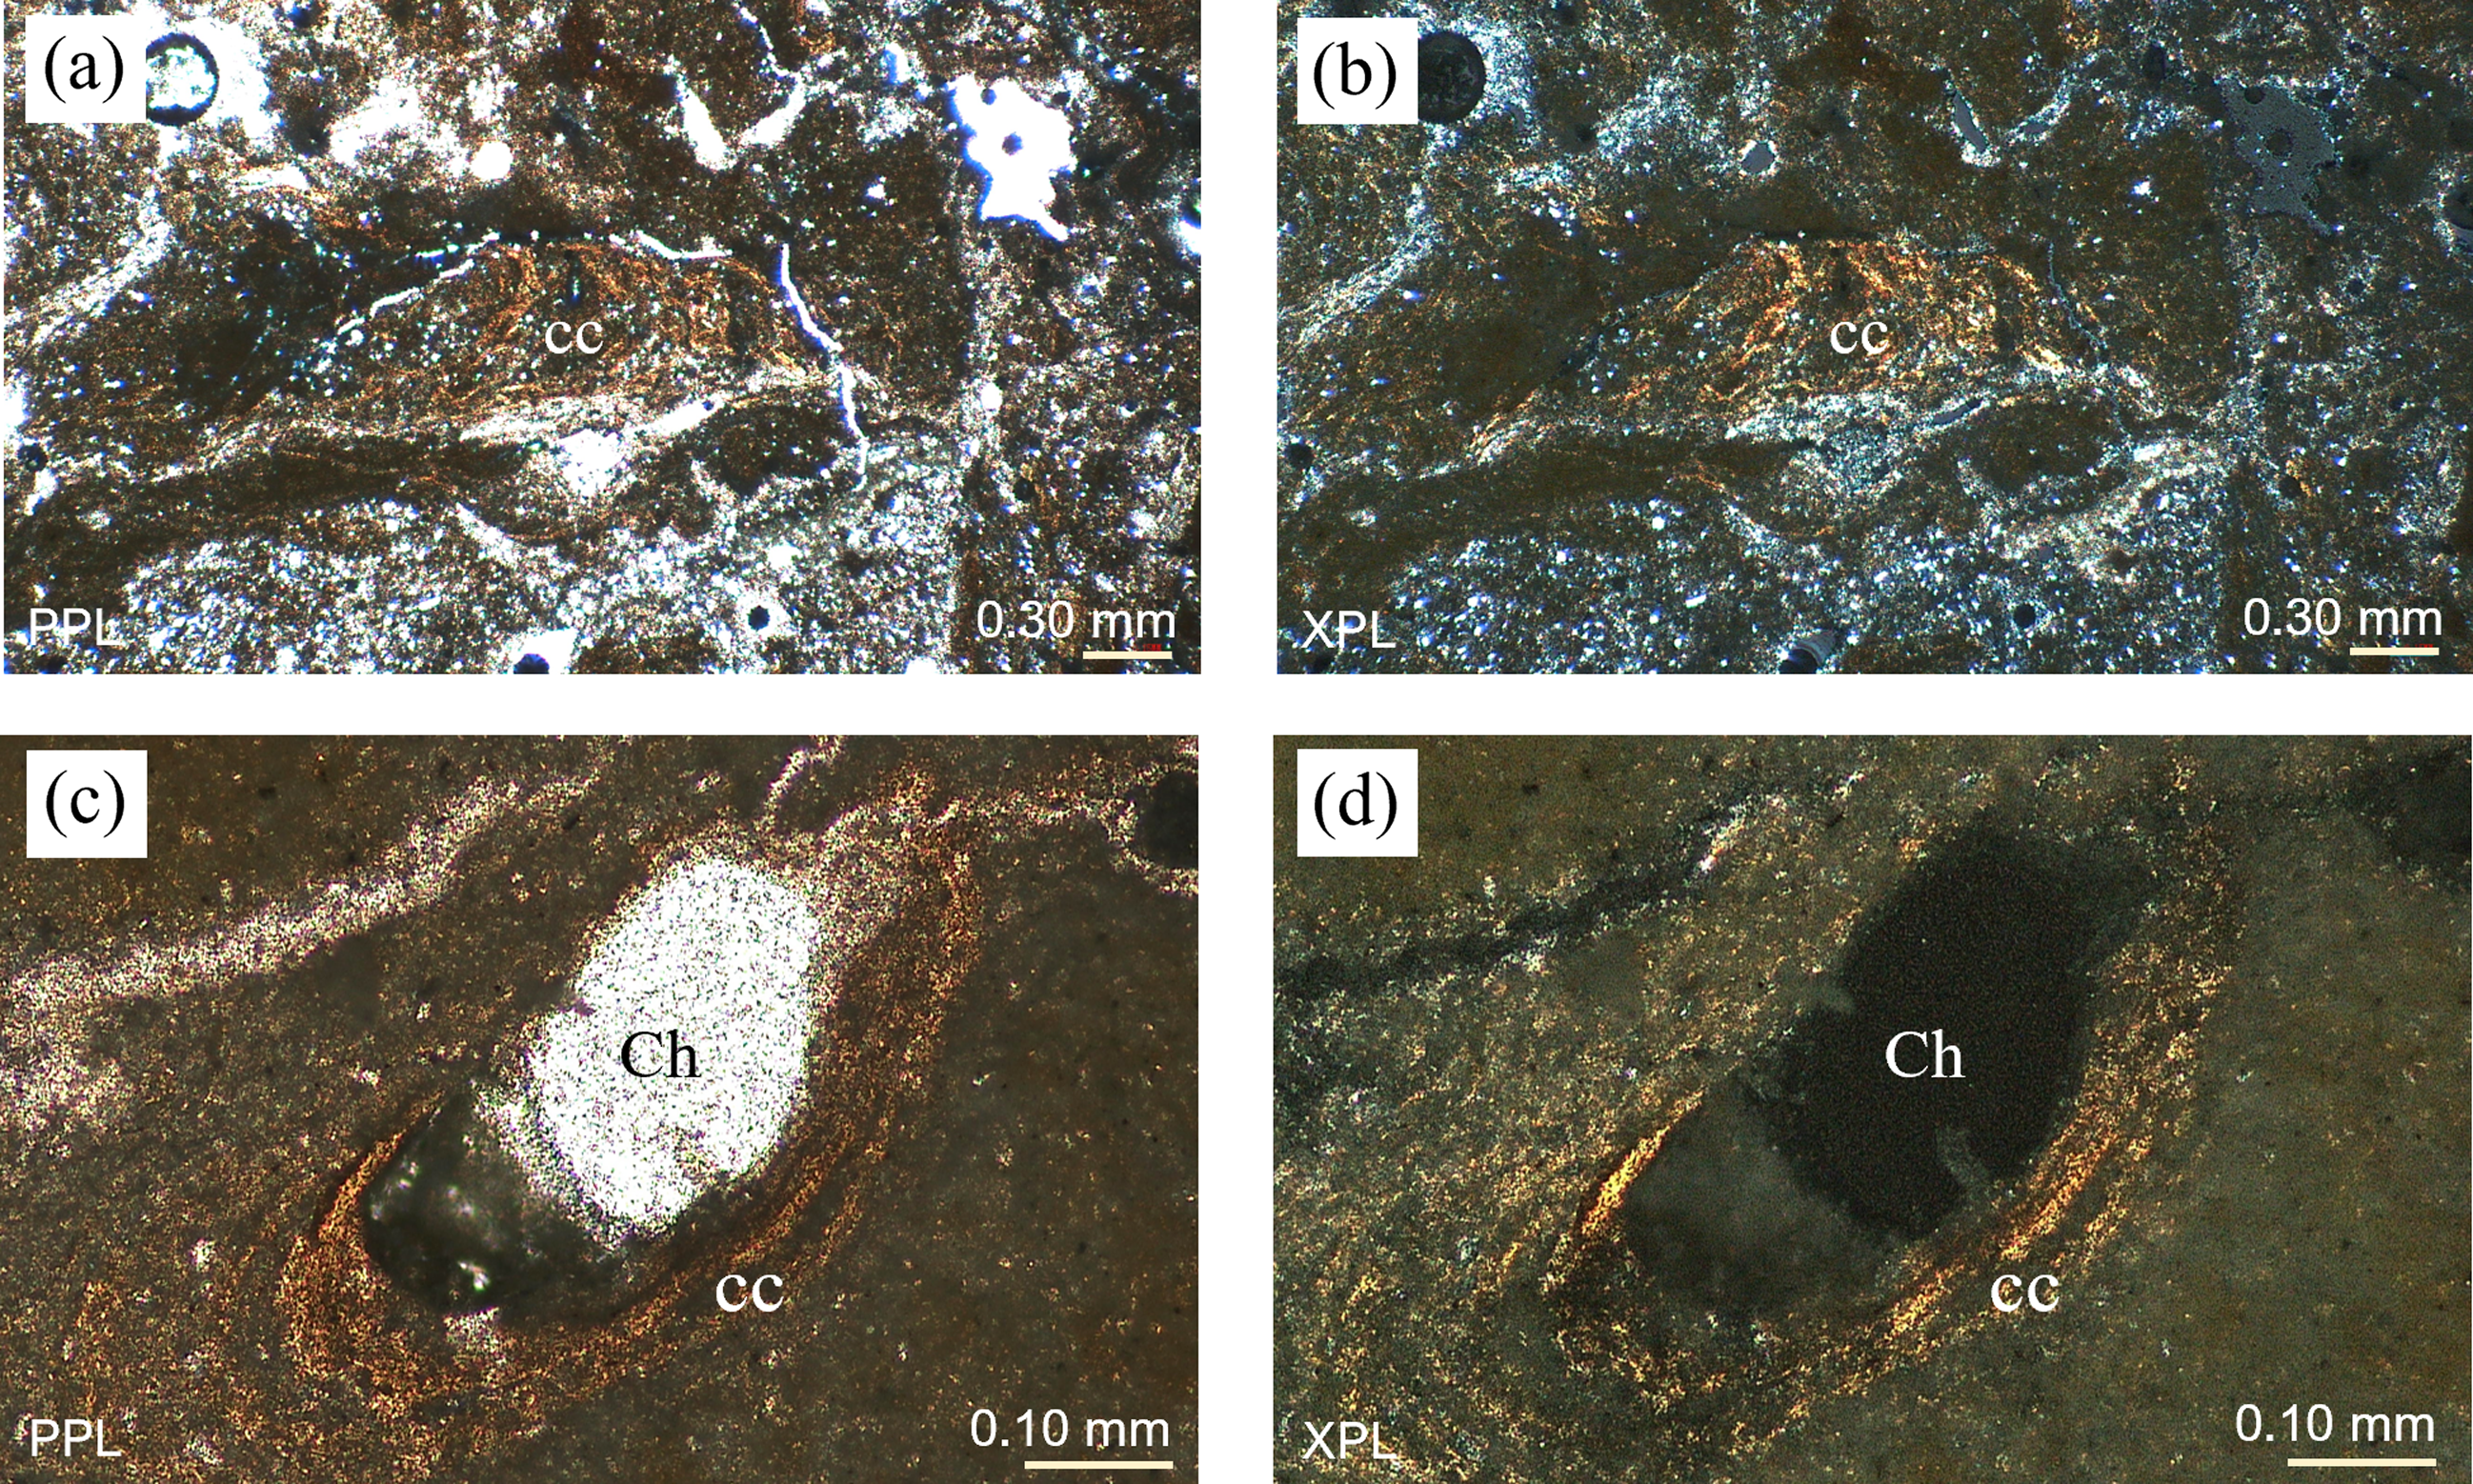
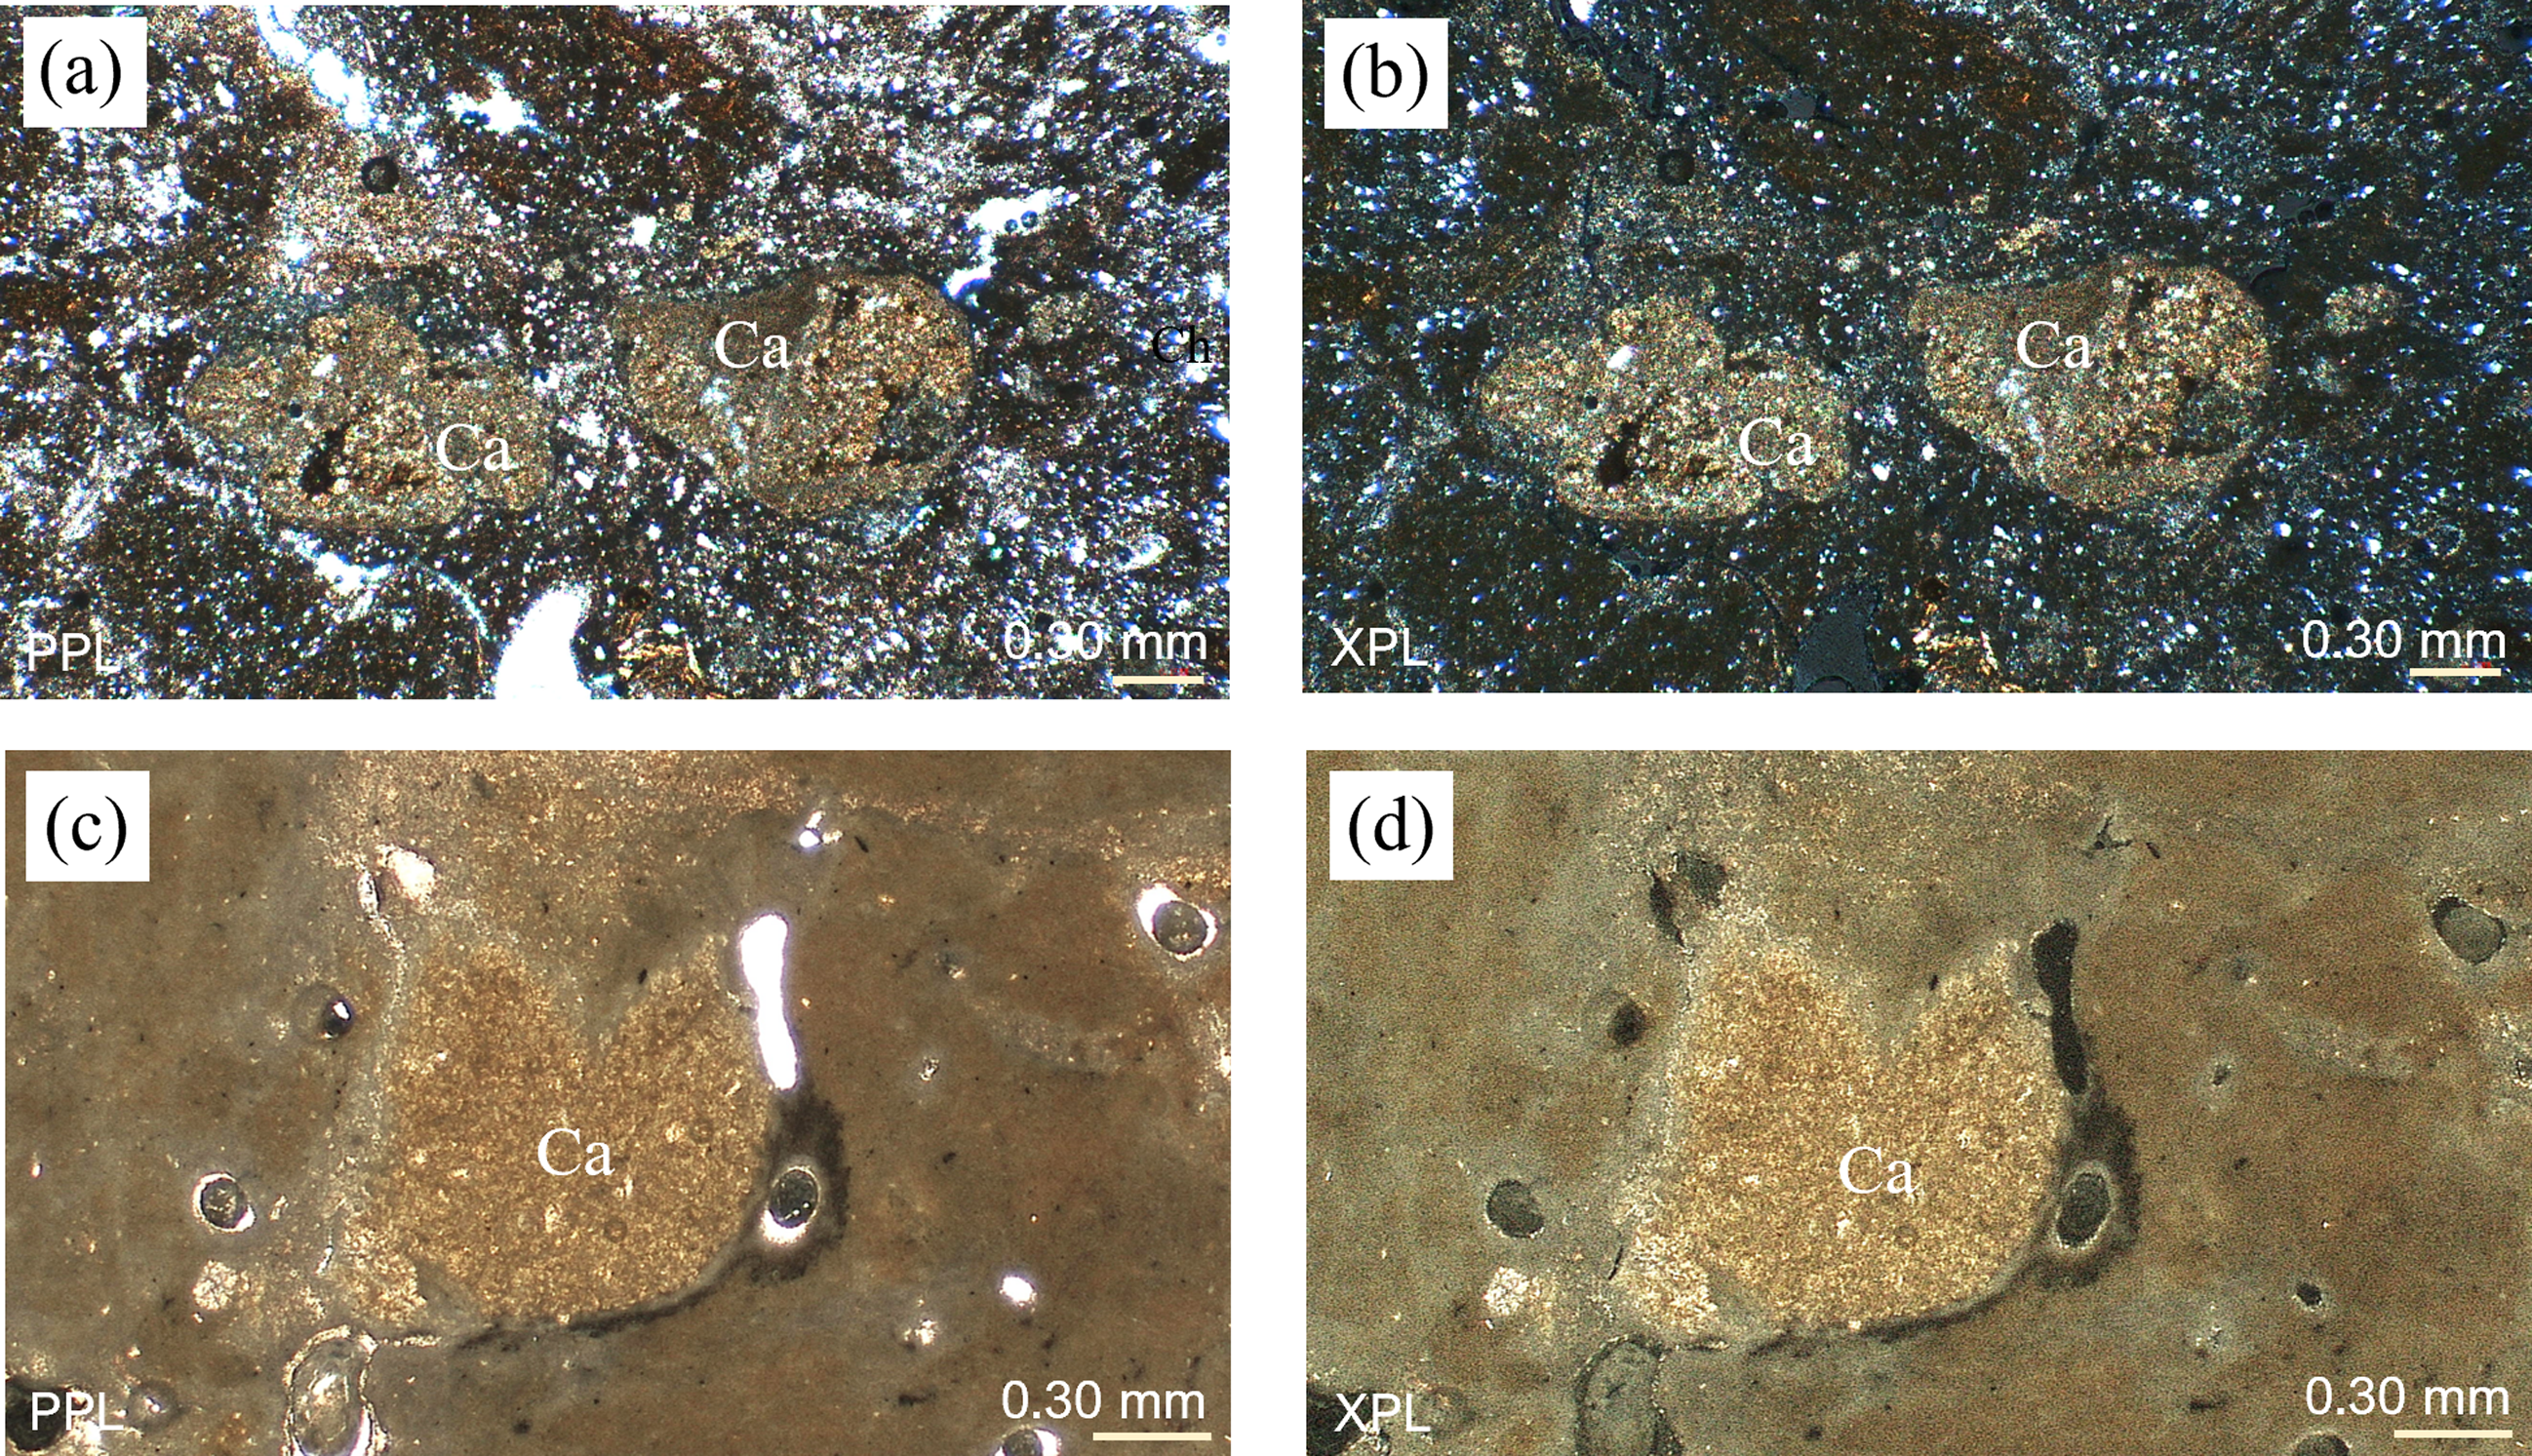
Clay coatings were distinctly present on the surfaces of voids in the subsurface horizons of the studied pedons. The clay coatings in the youngest pedon (KS4) were microlaminated (Figure 2a and b), with clay particles partly oriented and diffuse extinction lines. The soil groundmass was moderately sorted, and the clay features were embedded within it (Figure 2a and b). Clay coating was also discerned in the older pedon (pedon KS2), which was laminated and exhibited diffuse extinction lines (Figure 2c and d). In the youngest pedon, pedon KS4, the boundary of the carbonate nodules was sharp, and the skeletal grains within the carbonate nodules were similar to those in the surrounding matrix, which consisted of orthic nodules (Figure 3a and b). Additionally, carbonate nodules were observed in the older pedon (pedon KS2), which were orthic nodules with diffuse boundaries (Figure 3c and d).
Thin-section micrograph of clay coating from the Btk1 horizon (40–55 cm) of pedon KS4 under plane polarized light (PPL); (b) same as (a) but in cross-polarized light (XPL); (c) clay coating from the Btk1 horizon (70–90 cm) of pedon KS2 under PPL; (d) same as (c) but under XPL. Ch: channel; cc: clay coatings.

Figure 2. Long description
A thin-section micrograph displays a clay coating from the Btk1 horizon under plane polarized light. The image highlights two labeled parts: Ch, representing a channel, and cc, indicating clay coatings. The spatial arrangement shows the channel (Ch) centrally located within the clay coatings (cc). The texture and color variations help distinguish the different components. The same sample is shown in cross-polarized light in another image, revealing additional structural details.
Thin-section micrograph of carbonate nodules (Ca) from the Btk1 horizon (40–55 cm) of pedon KS4 under plane polarized light (PPL); (b) same as (a) but in cross-polarized light (XPL); (c) carbonate nodule from the Btk1 horizon (70–90 cm) of pedon KS2 under PPL; (d) same as (c) but under XPL.

Figure 3. Long description
Thin-section micrograph displays carbonate nodules labeled as Ca. Image (a) shows the nodules under plane polarized light (PPL) with a scale of 0.30 millimeters. Image (b) presents the same nodules under cross-polarized light (XPL). Image (c) depicts another carbonate nodule under PPL, while image (d) shows the same nodule under XPL. Each image highlights the internal structure and composition of the nodules.
4.2 Radiocarbon dating
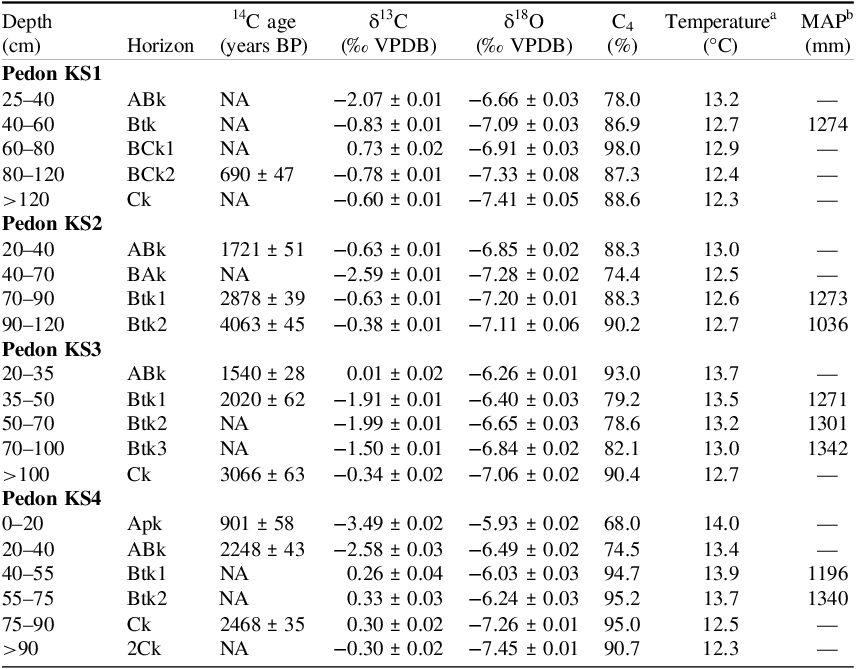
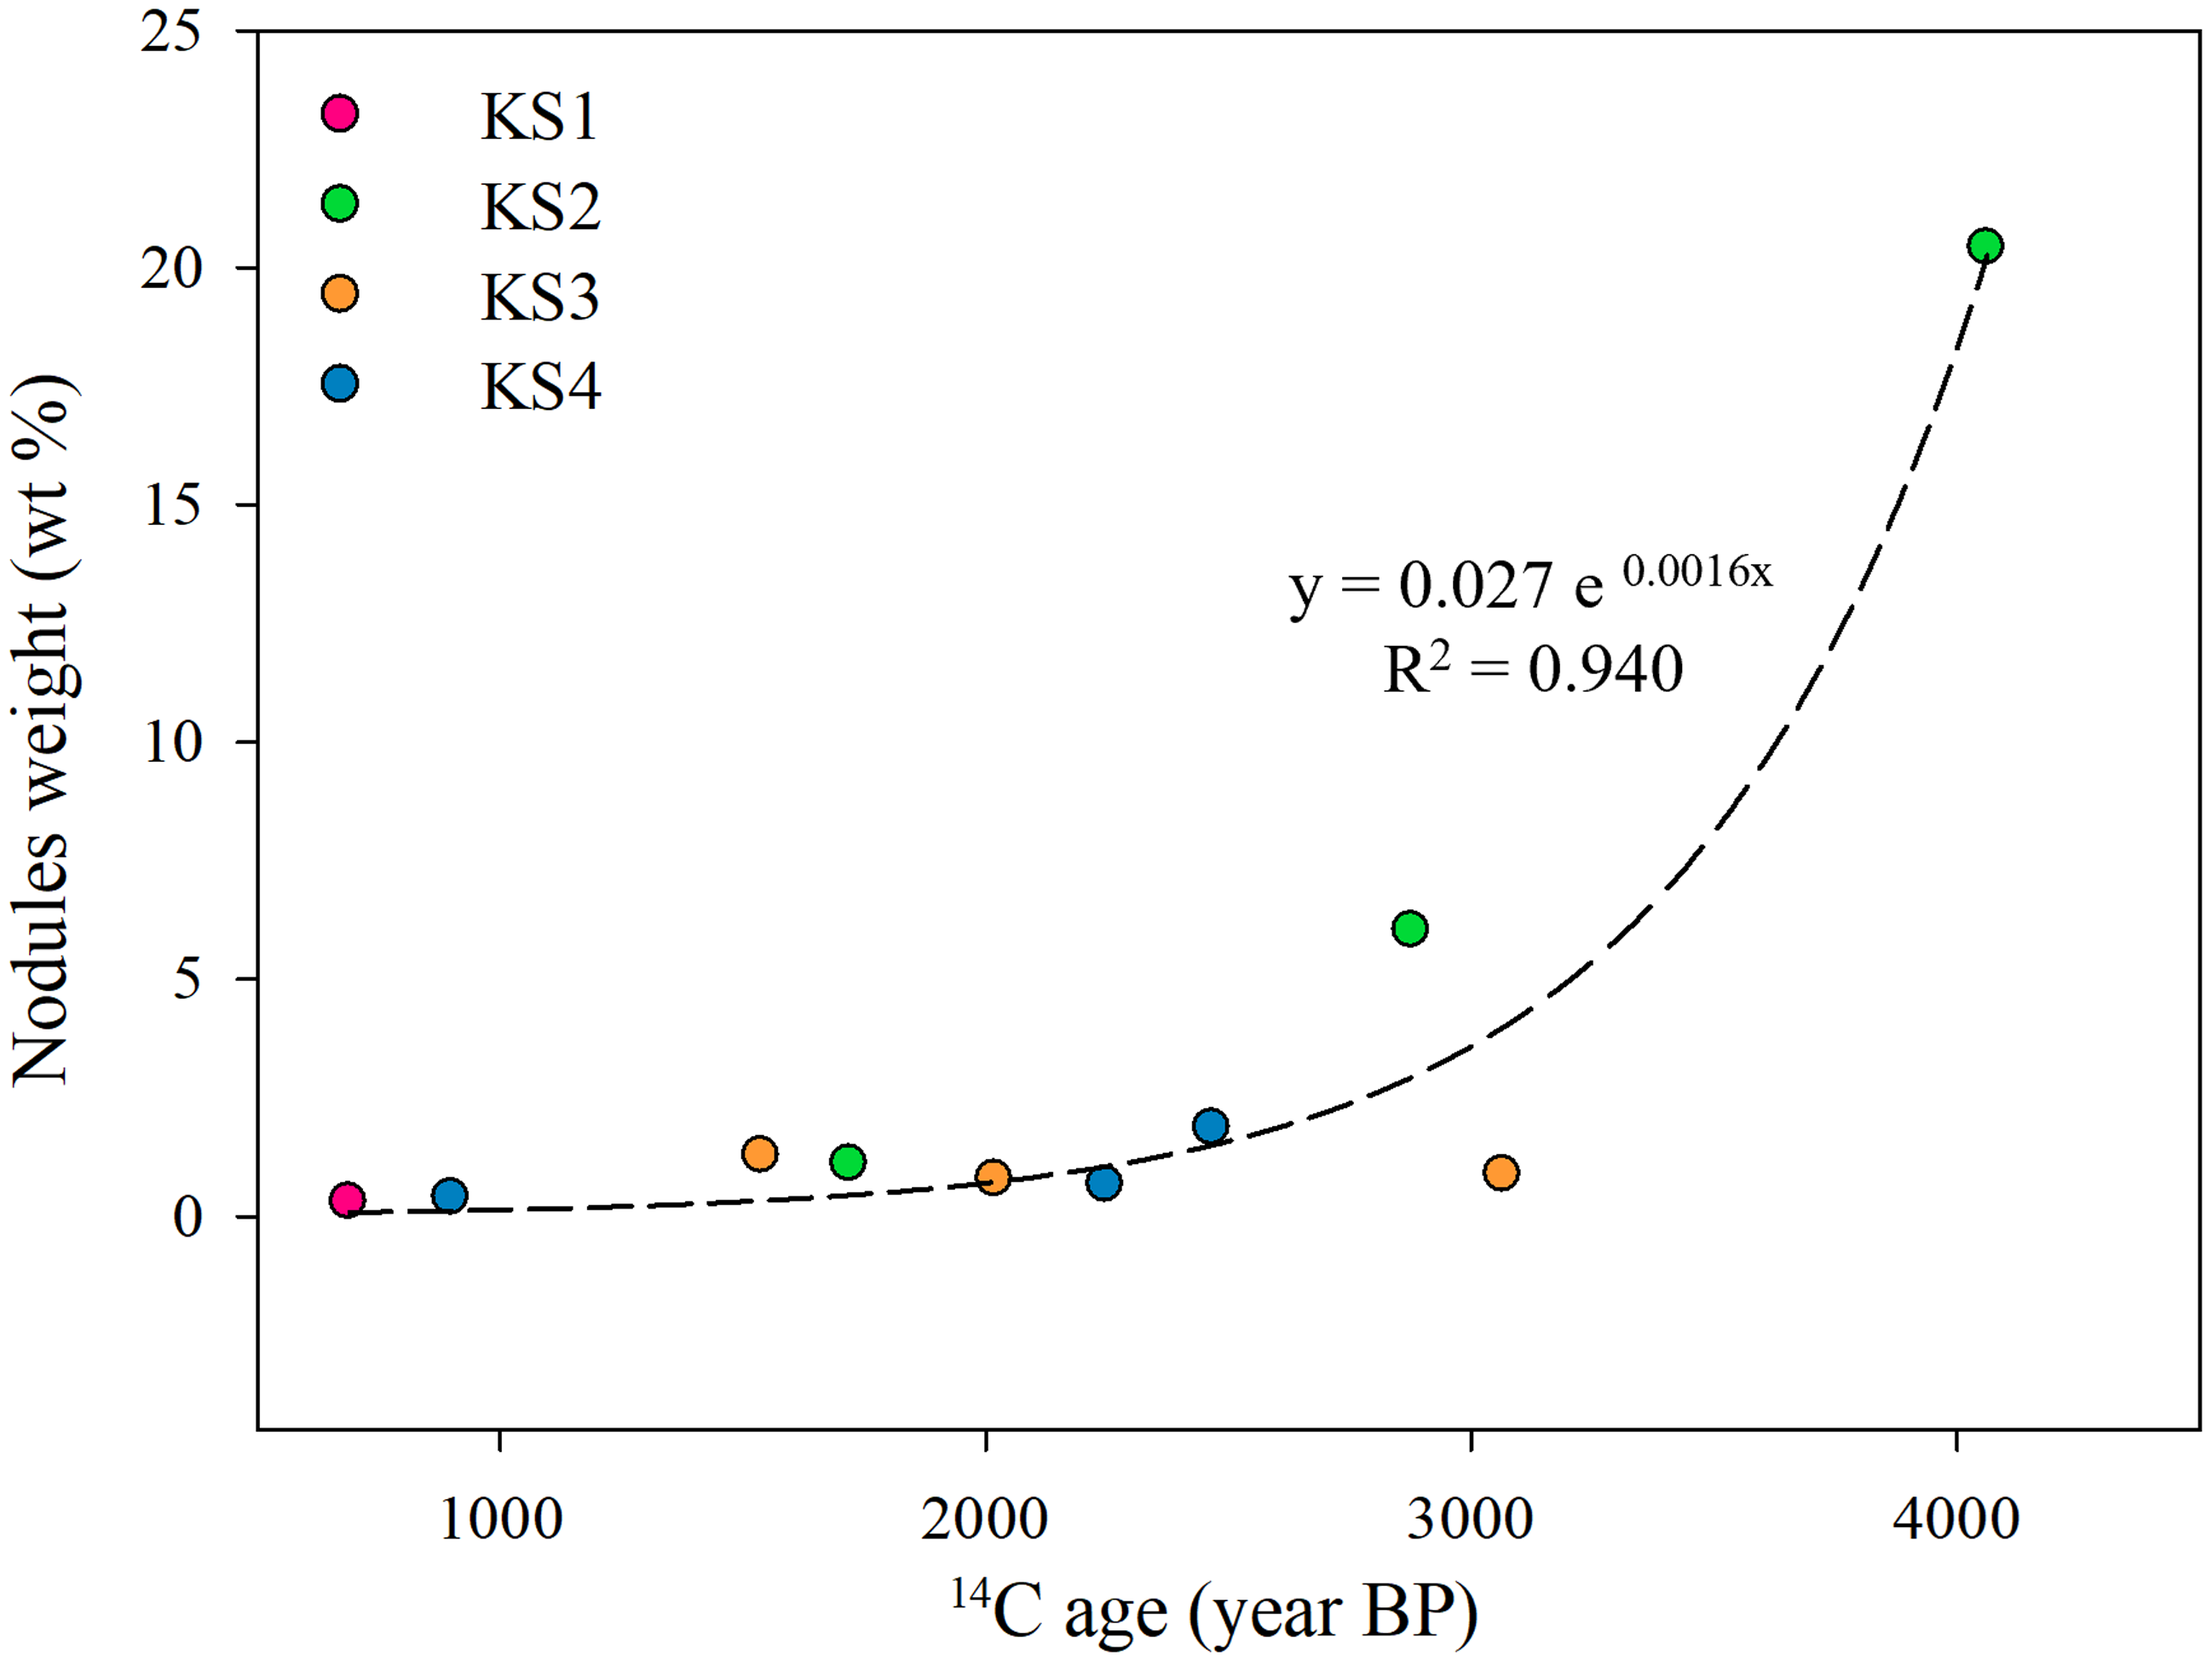
The radiocarbon age of the carbonate nodules is listed in Table 2. The 14C age of carbonate nodules in the BCk2 horizon of pedon KS1 (age of shoreline changes: 10,000 years BP) was 690 years BP. For pedon KS2 with an age of shoreline changes of 8000 years BP, the 14C age ranged from 1721 years BP to 4063 years BP. The 14C age of carbonate nodules in pedon KS3 (age of shoreline changes: 5000 years BP) ranged from 1540 years BP to 3066 years BP. In pedon KS4 with an age of shoreline changes of 3000 years BP, the 14C age in carbonate nodules ranged from 901 years BP to 2468 years BP. The radiocarbon ages of the carbonate nodules were lower than the ages of shoreline changes in their profiles. The 14C age of carbonate nodules was lower in the upper horizons and increased with depth in pedons KS2, KS3, and KS4. The weight of the carbonate nodules in the soils increased with the 14C age (Figure 4), but no obvious trend was observed between the average size of carbonate nodules and age (Table S2).
Stable carbon, oxygen isotopes, and radiocarbon age of the studied carbonate nodules, estimated temperature, and precipitation.

Table 2. Long description
The table presents data on stable carbon and oxygen isotopes, radiocarbon age, estimated temperature, and mean annual precipitation of carbonate nodules from four pedons. It includes measurements for different horizons at various depths. The table has eight columns: Depth in centimeters, Horizon, Radiocarbon age in years BP, Delta C 13 in per mil VPDB, Delta O 18 in per mil VPDB, C 4 percentage, Temperature in degrees Celsius, and Mean Annual Precipitation in millimeters. The data shows variations in isotope values, radiocarbon ages, and environmental conditions across different soil horizons and depths.
a estimated by Hyland and Sheldon (Reference Hyland and Sheldon2013).
b estimated by Sheldon et al. (Reference Sheldon, Retallack and Tanaka2002).
Plot of 14C age of carbonate nodules and nodule weights (n=10, p < 0.001) in the studied pedons.

Figure 4. Long description
A scatter plot showing the relationship between radiocarbon age and nodule weight of carbonate nodules in studied pedons. The x-axis represents the radiocarbon age in years before present (BP), ranging from 0 to 4000 years. The y-axis represents the nodule weight in weight percentage (wt %), ranging from 0 to 25 percent. The plot includes several data points color-coded as pink, green, orange, and blue, representing different samples labeled as KS1, KS2, KS3, and KS4 respectively. A dashed trend line is present, indicating an exponential relationship between the variables, with the equation y = 0.027 e^0.0016x and an R-squared value of 0.940. The data points show an overall increasing trend in nodule weight with increasing radiocarbon age, with some variability among the different samples. All values are approximated.
4.3 Stable isotopic composition and climofunctions
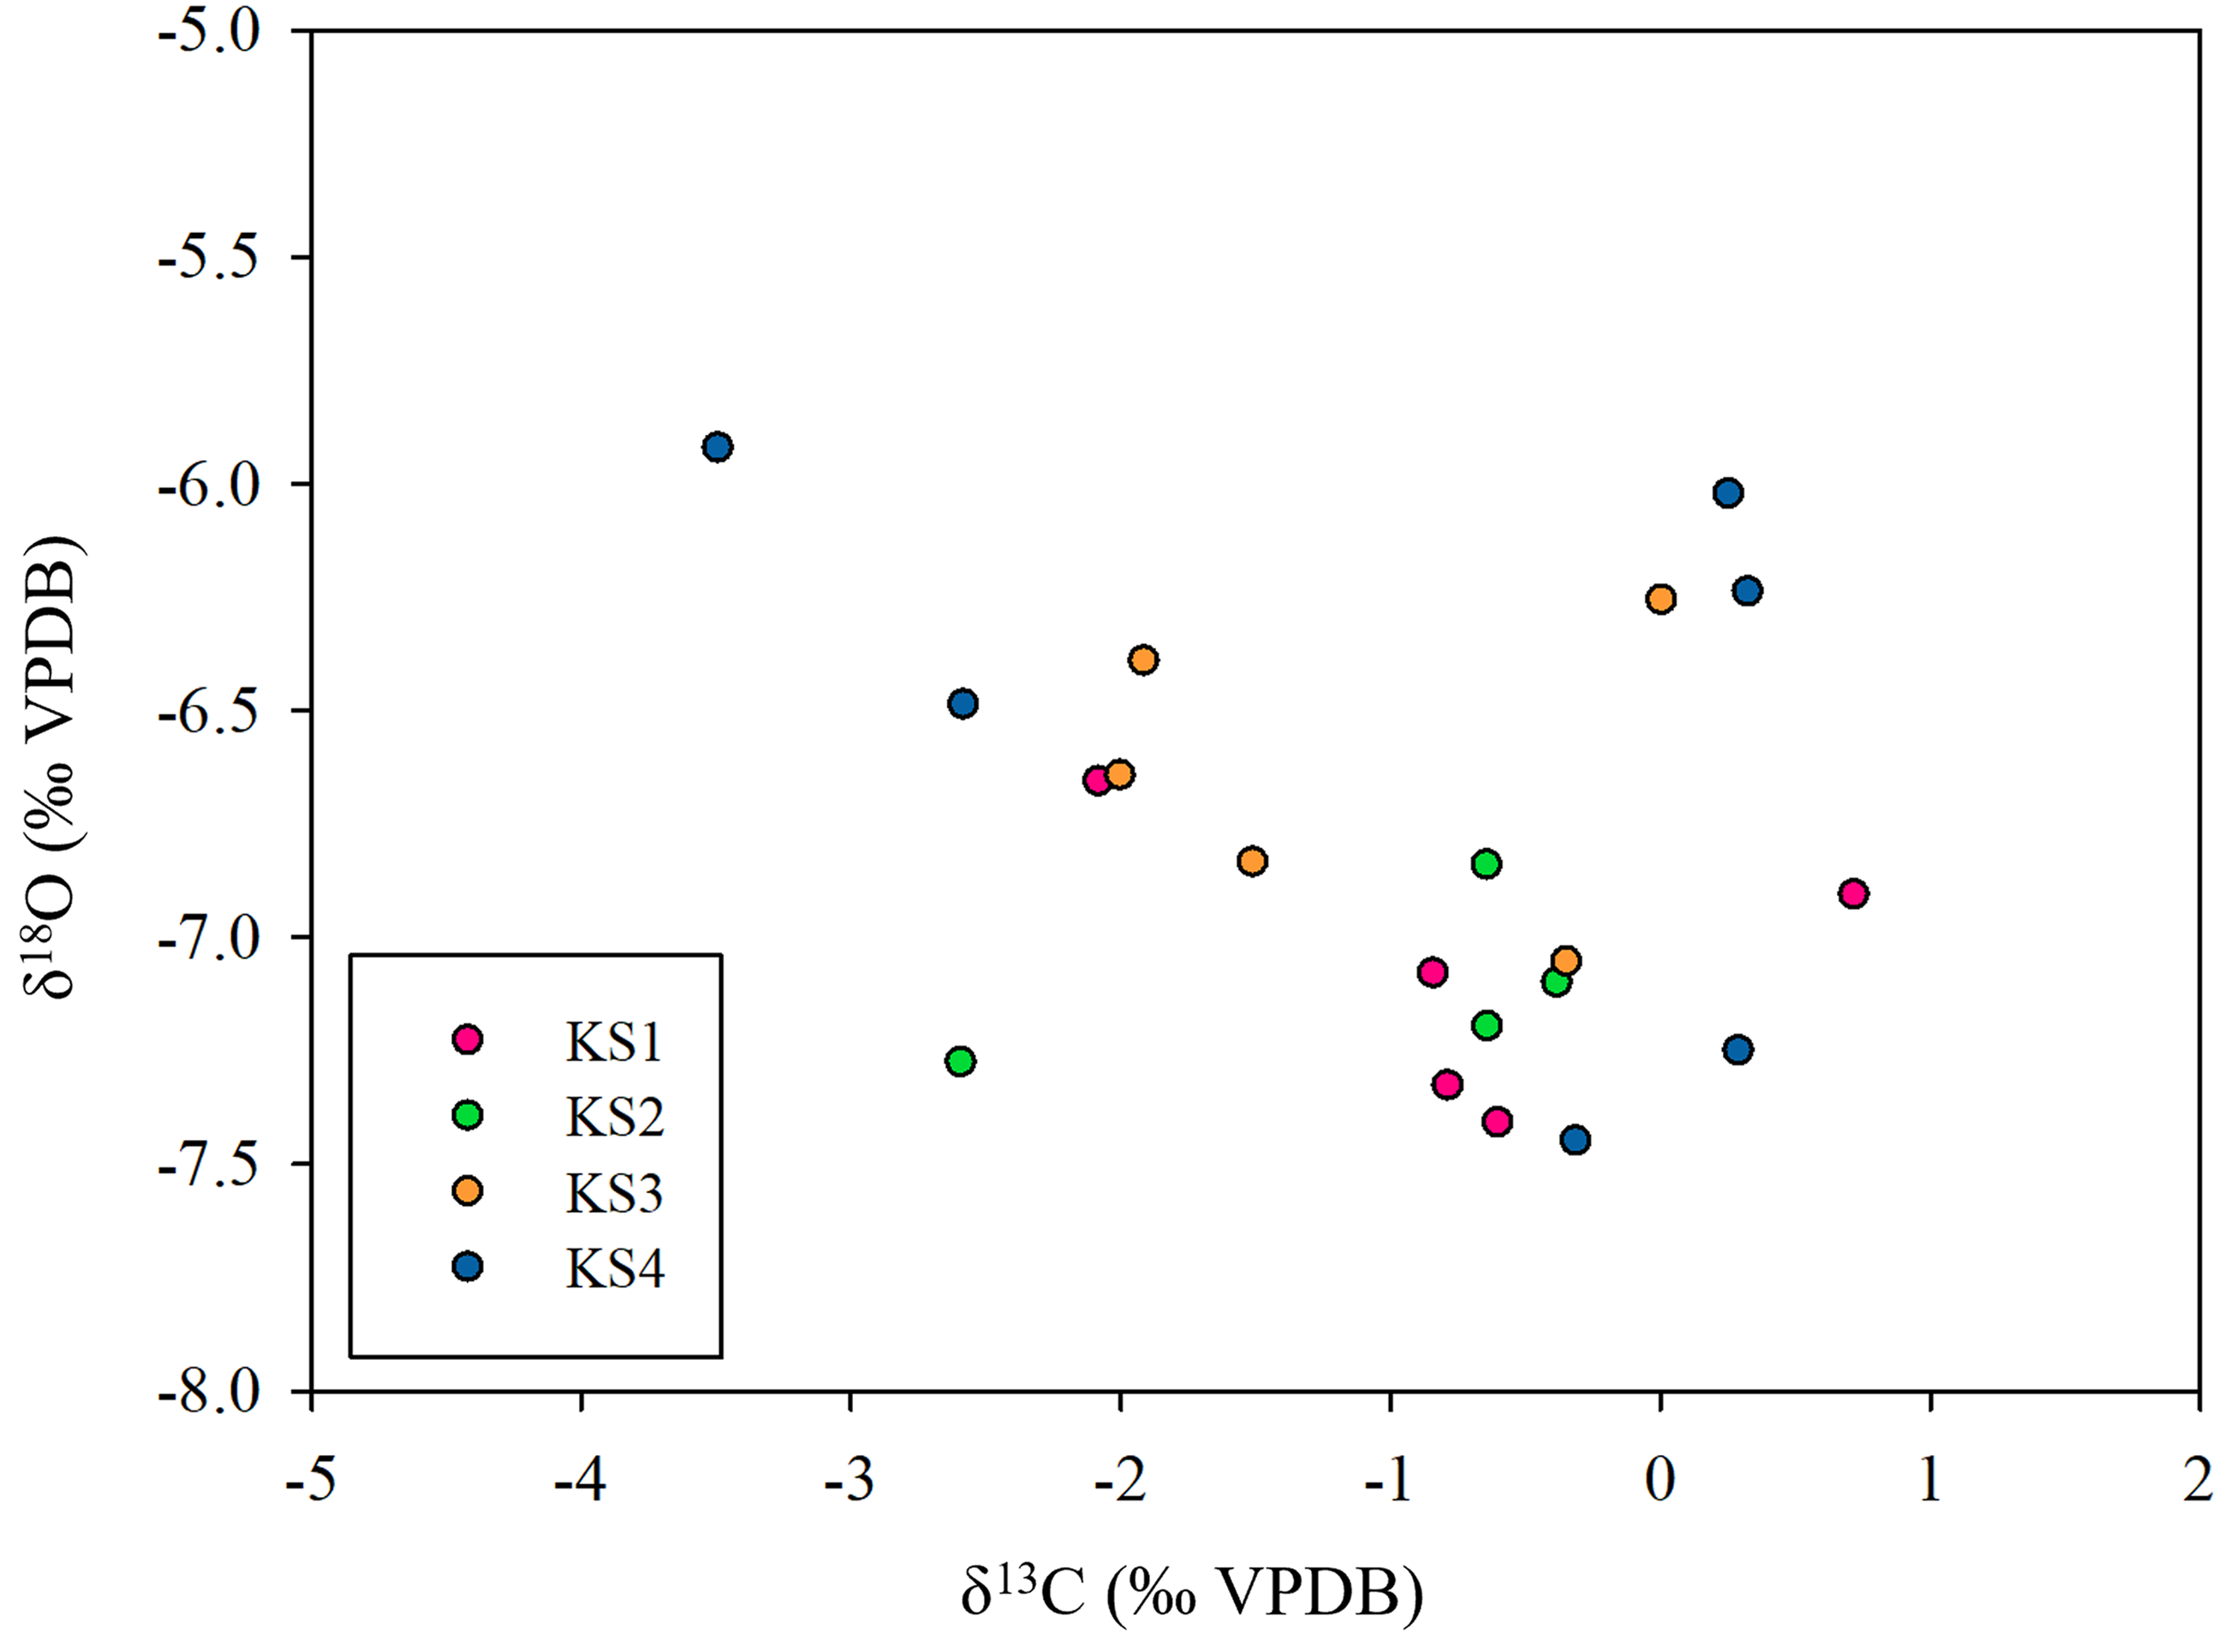
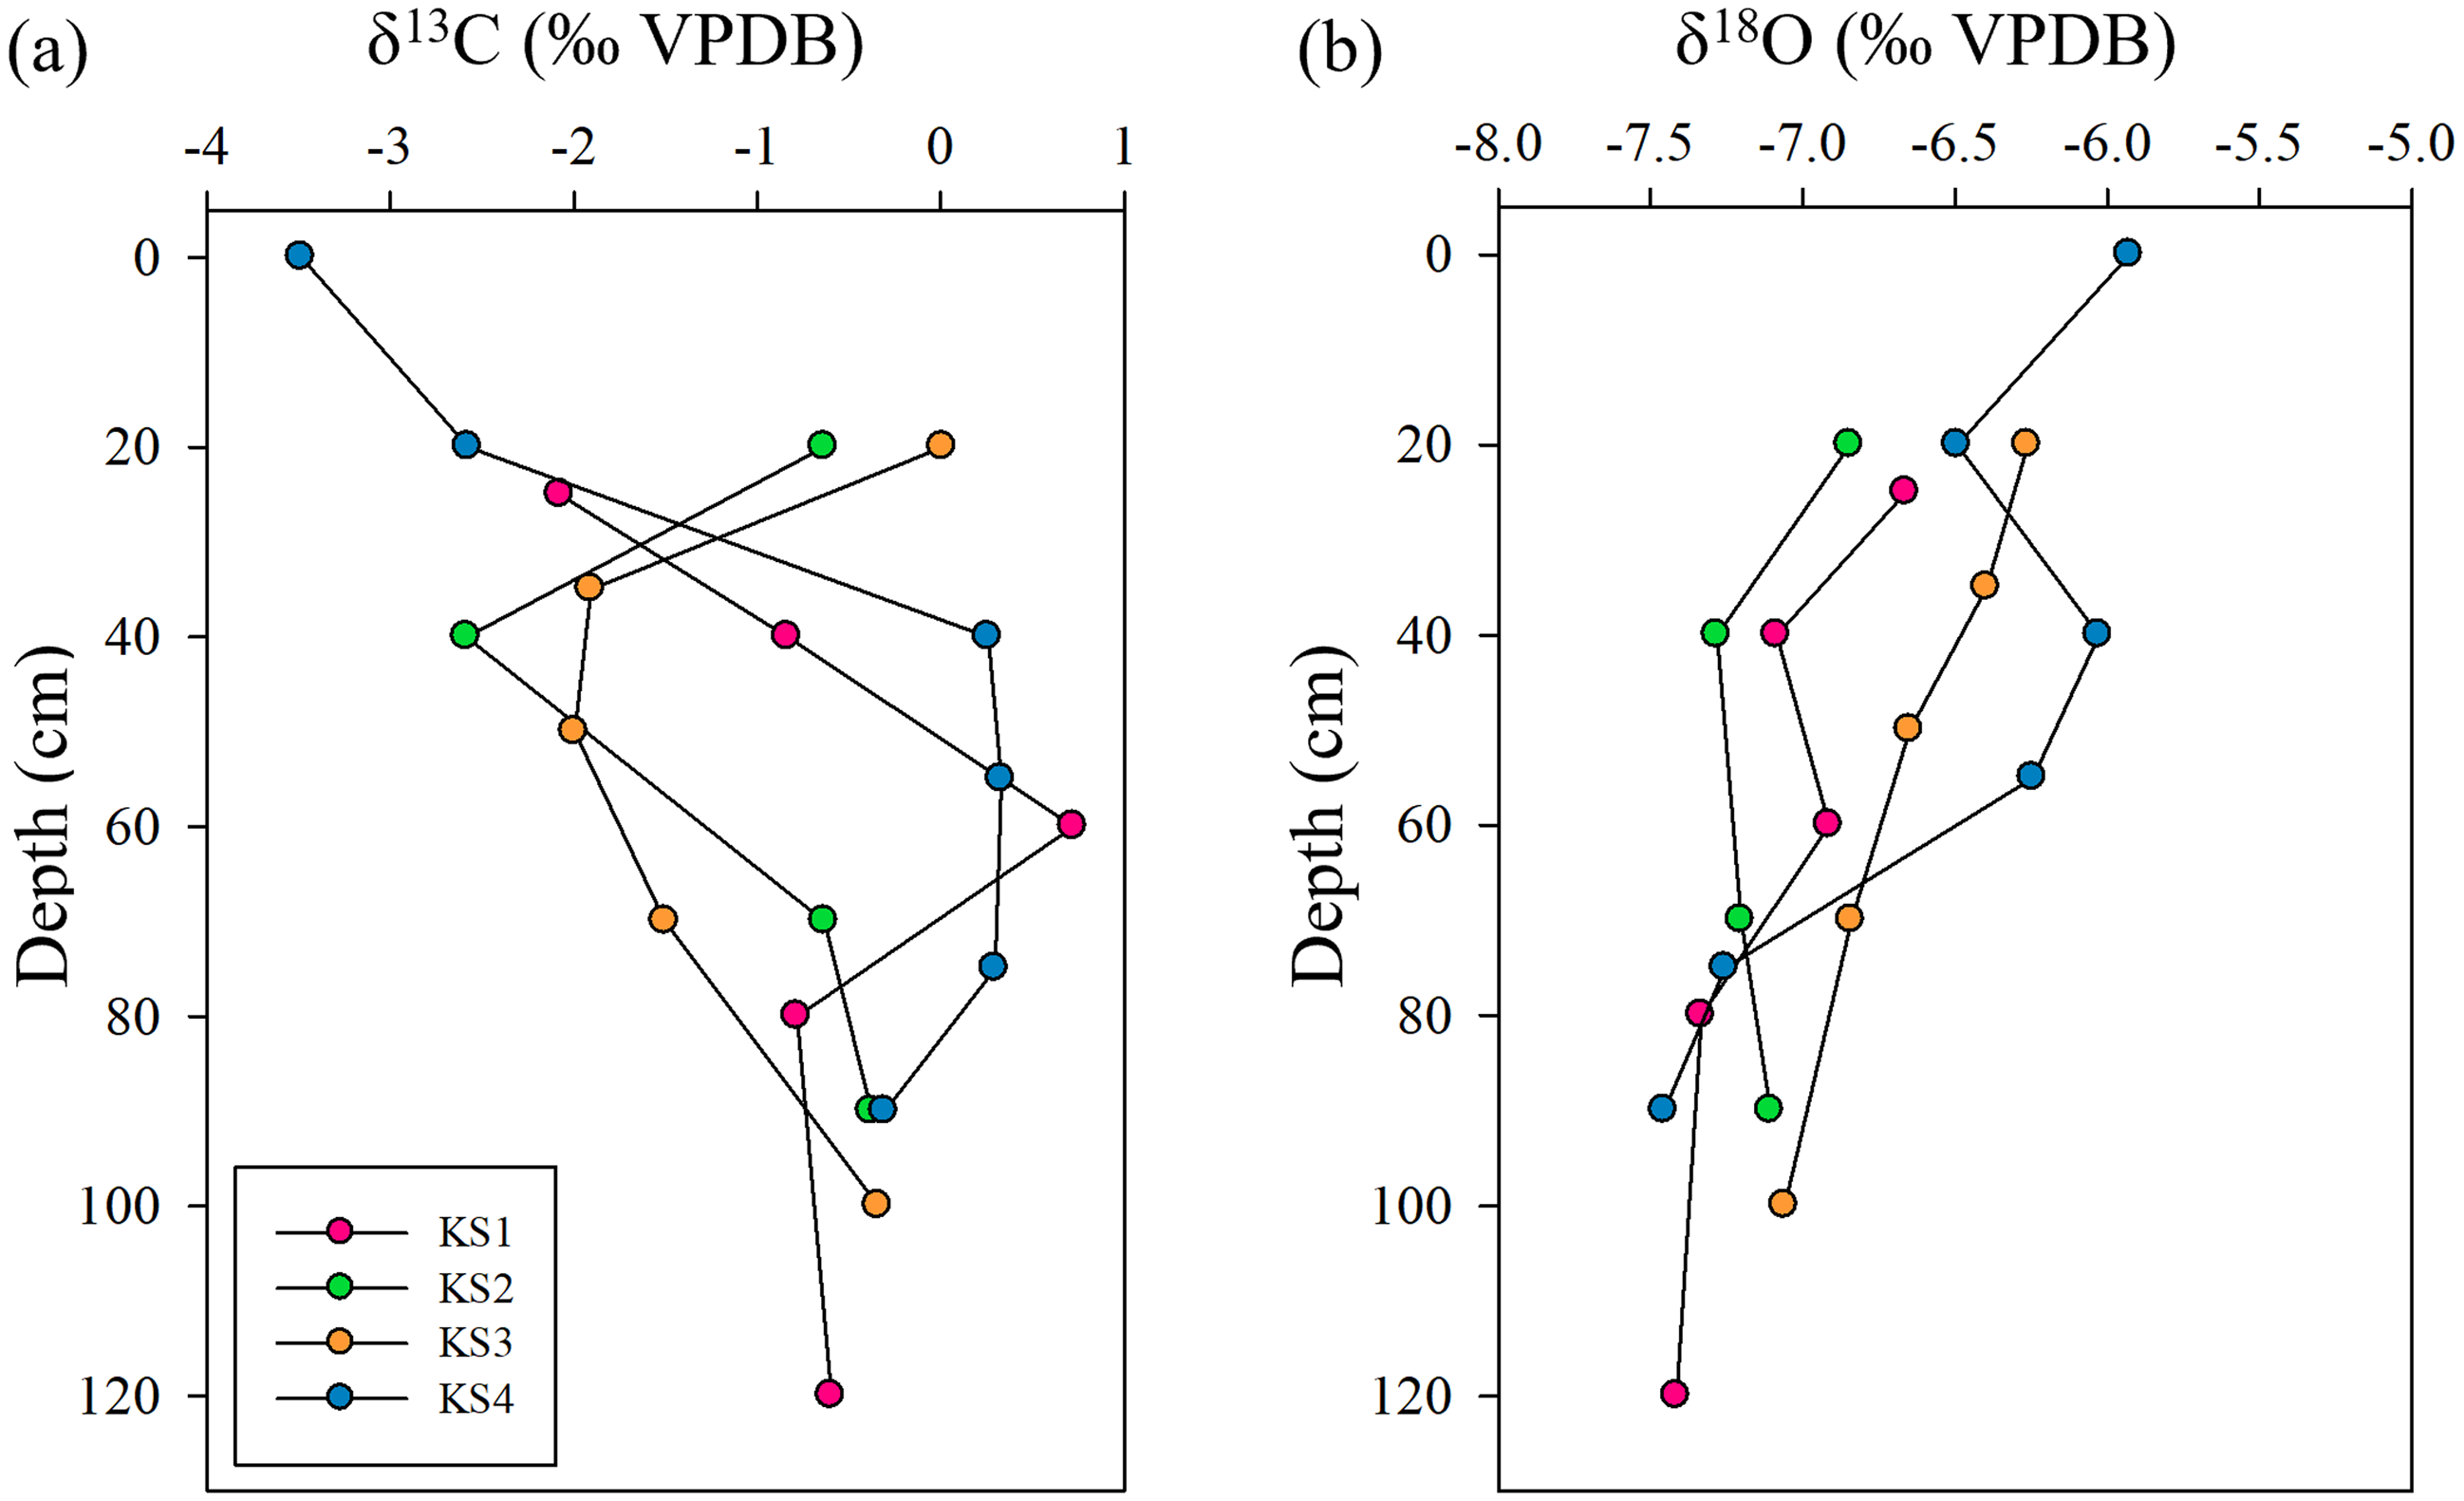
The stable carbon and oxygen isotopes in the carbonate nodules are listed in Table 2. δ13C values in carbonate nodules ranged from –3.49‰ to +0.73‰, which were lowest in the Apk horizon of pedon KS4 and highest in the BCk1 horizon of pedon KS1. δ18O values ranged from –7.45‰ to –5.93‰, and were lowest in the 2Ck horizon of pedon KS4 and highest in the Apk horizon of pedon KS4. The proportion of C4 plants ranged from 68.0 to 98.0%, which was lowest in the Apk horizon of pedon KS4 and highest in the BCk1 horizon of pedon KS1 (Table 2). The distribution of δ13C and δ18O values did not have an obvious trend (Figure 5). The δ13C value in carbonate nodules of pedon KS2 and KS3 was slightly higher in the surface soil (Figure 6a). The δ18O value was slightly higher in the surface soil, especially in pedon KS1 and KS2 (Figure 6b).
Plot of δ13C and δ18O values in carbonate nodules (n=20) from the studied pedons.

Figure 5. Long description
A scatter plot displays the relationship between delta 13C and delta 18O values in carbonate nodules, with 20 data points. The x-axis represents delta 13C values in per mil VPDB, ranging from -5 to 2. The y-axis represents delta 18O values in per mil VPDB, ranging from -8 to -5. The data points are color-coded into four categories: KS1, KS2, KS3, and KS4. KS1 is represented by pink dots, KS2 by green dots, KS3 by orange dots, and KS4 by blue dots. The plot shows a scattered distribution of data points with no clear trend. The data points are spread across the plot with some clustering observed around the center. All values are approximated.
Distribution of the values of δ13C (a) and δ18O (b) of carbonate nodules with depth in the studied pedons.

Figure 6. Long description
The line graph consists of two panels labeled (a) and (b). Panel (a) displays the distribution of delta 13C values with depth, ranging from -4 to 1 per mil VPDB on the x-axis and from 0 to 120 centimeters on the y-axis. Panel (b) shows the distribution of delta 18O values with depth, ranging from -8.0 to -5.0 per mil VPDB on the x-axis and from 0 to 120 centimeters on the y-axis. Each panel includes four data lines representing different pedons, labeled KS1, KS2, KS3, and KS4. The data points for each pedon are connected by lines, illustrating the variation in isotope values with depth. All values are approximated.
The temperature estimated from the climofunction with δ18O value in the carbonate nodules is listed in Table 2. The temperature ranged from 12.3 to 14.0°C, which was lowest in the Ck horizon of pedon KS1 and the 2Ck horizon of pedon KS4, and was highest in the Apk horizon of pedon KS4. MAP calculated ranged from 1036 to 1342 mm, and was lowest in the Btk2 horizon of pedon KS2 and was highest in the Btk3 horizon of pedon KS3.
5 Discussion
5.1 Pedogenesis along the chronosequence
The carbonate nodules were found in few quantities in the upper horizons and in common quantities in the lower horizons (Table 1) and were slightly increased in the subsoils (Table S1). The carbonate nodules with diffuse boundaries were orthic (Figure 3), implying that they were formed in situ (Wieder and Yaalon Reference Wieder and Yaalon1974). The presence of clay coating supported the clear migration of clay under humid and warm environments (Schaetzl and Anderson Reference Schaetzl and Anderson2005; Figure 2). Carbonate nodules indicated calcification in the studied soils under drier or higher evapotranspiration climatic conditions, which differed from the formation conditions associated with argilluviation. Under alternating wet and dry seasons, the accumulation of clay may be interrupted by carbonate cementation (de Jesus Alves et al. Reference de Jesus Alves, Ladeira and Batezelli2022). However, based on microscopic observations, clay coatings and carbonate nodules appeared to have formed separately in this study (Figures 2 and 3). This may imply that clay coatings and carbonate nodules were formed at different stages rather than seasonal alternation, reflecting an initial wetter stage followed by a drier stage. The climate was initially humid and warm, which favored eluviation and illuviation in the soils, leading to the migration and accumulation of clay in the subsoils (Hum et al. Reference Hum, Chu, Huang, Zehetner and Hseu2026). The leached out of the carbonates, causing migration and deposition of clay, thus forming argillans (Schaetzl and Anderson Reference Schaetzl and Anderson2005). Then, the climate became drier, and calcification became the predominant pedogenic process, resulting in the formation of carbonate nodules in the soils. The argillans formed under a former wetter climate can be preserved from the later drier climate (Birkeland Reference Birkeland1984).
The modern climate in the studied area was sub-humid with a mean annual precipitation of 1829 mm (based on data from 1931 to 2022; Hum et al. Reference Hum, Chu, Huang, Zehetner and Hseu2026). The high mean annual precipitation may enhance the leaching and dissolution of carbonates, which is not conducive to the formation of carbonate nodules. However, carbonate nodules can be formed during dry periods. Besides, the relationship between MAP and depth to the Bk horizon in Taiwan decreased with increasing depth (Figure S1), which is opposite to the trend of pedogenic carbonate occurrence in the soil profiles (Retallack Reference Retallack2005; Zamanian et al. Reference Zamanian, Pustovoytov and Kuzyakov2016). This further illustrates that the carbonate nodules are relictic feature of paleoclimate conditions, and modern climatic conditions may not be suitable for forming carbonate nodules.
5.2 Implications of paleoclimate reconstruction
The carbonate nodules formed between 4063 years BP and 690 years BP (Table 2). The ages of the carbonate nodules, as determined by radiocarbon dating within each profile, were younger than the ages of the shoreline changes, implying that the carbonate nodules were indeed formed after the marine regression. The relative depletion of 13C implied higher humidity and mean annual precipitation, while the relative enrichment of 13C indicated a climatic condition of relatively higher evaporation rate and depletion of the CO2 level (Barta et al. Reference Barta, Bradák, Novothny, Markó, Szeberényi, Kiss and Kovács2018). However, the δ13C values in the studied carbonate nodules, ranging from –3.49‰ to +0.73‰ (Table 2), were slightly negative to positive, indicating that the vegetation cover fell within these two extremes. For stable oxygen isotopes, highly negative values of δ18O imply a relatively moister condition, meteoric water in cool seasons, and a lower evaporation rate; highly positive values of δ18O reflect a higher evaporation rate and temperature and are closer to arid climatic conditions (Andrews et al. Reference Andrews, Singhvi, Kailath, Kuhn, Dennis, Tandon and Dhir1998; Barta et al. Reference Barta, Bradák, Novothny, Markó, Szeberényi, Kiss and Kovács2018). Hence, the more negative δ18O values in this study (−7.45‰ to −5.93‰; Table 2), which reflect a lower evaporation rate, and were likely influenced by the monsoon climate, compared to the arid climate (Andrews et al. Reference Andrews, Singhvi, Kailath, Kuhn, Dennis, Tandon and Dhir1998). Additionally, there was no significant correlation between δ13C and δ18O (Figure 5), which may reflect seasonal alternation between dry and wet conditions. The absence of an obvious trend between δ13C and δ18O values suggests a low evaporation rate (Barta et al. Reference Barta, Bradák, Novothny, Markó, Szeberényi, Kiss and Kovács2018), supported by a positive correlation between δ13C and δ18O values under arid conditions, resulting from the enrichment of the values of δ13C in soil CO2 and δ18O in soil water (Valera Fernandez et al. Reference Valera Fernandez, Solleiro Rebolledo, Sedov and Pustovoitov2022). The value of δ18O in carbonate nodules from the surface soils was slightly higher in all pedons (Figure 6b). This was due to the preferential infiltration of lighter isotopes or the greater evaporation in the surface soils (Quade et al. Reference Quade, Cerling and Bowman1989).
The carbon isotope composition demonstrated that the carbon sources of carbonate nodules are a mixture of C3 and C4 plants and a predominance of the C4 plants (68.0 to 98.0%; Table 2). C4 plants prefer lower atmospheric pCO2 and are active in hot and drought conditions but can tolerate a minimum summer temperature of 6 to 10°C globally. For C3 plants, the growth is promoted under wet winters and dry summers (Sage and Kubien Reference Sage and Kubien2003). C4 plants are invasive and can expand under conditions of enhanced summer precipitation but are inhibited under greater summer aridity (Hajek et al. Reference Hajek, Sturchio and Knapp2024). Besides, C4 plants are tolerant to salt, desiccation, and drought environments (Pardo and VanBuren Reference Pardo and VanBuren2021). The studied soils were non-saline to moderately saline conditions, with electrical conductivity ranging from 0.67 to 8.77 dSm-1 (Table S2). Hence, C4 plants may acted as pioneer plants, adapting to the harsh conditions during the early stage following marine regression in the study area. With the growth of C4 plants, they formed a larger canopy that shaded the slower-growing C3 plants (Sage and Kubien Reference Sage and Kubien2003). C4 plants are more competitive than C3 plants in low atmospheric pCO2 due to their CO2 concentrating mechanism. However, the climatic conditions of lower atmospheric pCO2 are insufficient to spread C4 plants, and favorable temperatures and moisture are also required. Hence, the distribution of C3 or C4 plants is controlled by regional climate and cannot reflect the atmospheric CO2 level (Lim and Fujiki Reference Lim and Fujiki2011). The MAT (12.3–14.0 °C) and MAP (1036–1342 mm) interpreted from the climofunctions were lower than the modern temperatures and precipitation. This suggested that during 4063 years BP and 690 years BP, the environment was cooler and drier than the present.
The pollen record from Dongyuan Lake, located in southern Taiwan, indicates that climate conditions from 8.2 ka BP to 4.1 ka BP were warmer than the present. A strong East Asian Summer Monsoon (EASM) occurred during the mid-Holocene, peaking at 6.1 ka BP, marking the Holocene Climate Optimum (HCO). This resulted in warmer and wetter climatic conditions and favored the formation of clay coatings in the study area. The climate was then cooler than present from 4.1 ka BP to 2.1 ka BP (Lee and Liew Reference Lee and Liew2010). Furthermore, during the period from ∼4 ka to 2 ka BP in Taiwan, the lower sea surface temperatures of the Western Pacific Warm Pool resulted in less moisture in the East Asian monsoon region due to an El Niño-like condition (Chen et al. Reference Chen, Shen, Li, Zhang, Sun and Ji2015b). Additionally, the warm Kuroshio Currents and the southward shift of the Intertropical Convergence Zone (ITCZ) at 4–2 ka BP can lead to a decrease in summer monsoon rainfall in Taiwan (Selvarej et al. Reference Selvaraj, Chen and Lou2007). Then the EASM rainfall increased after 2 ka to the present (Ding et al. Reference Ding, Zheng, Zheng and Kao2020). The paleoclimate conditions coincided with the evidence reconstructed from pollen and charcoal in the Toushe Basin, central Taiwan (Huang et al. Reference Huang, Ma, Chyi, Tang and Zhao2020). Hence, this evidence indicated the existence of a relatively cooler and drier period after ∼4 ka BP, which was caused by the weak EASM intensity, and favored the formation of carbonate nodules in the studied soils. Besides, multiple cooling and drying events were identified at approximately 4.7, 4.2, 3.7, 3.2, 2.8, and 2.4 ka BP in the Korean Peninsula, which lies within the East Asian monsoon belt (Park et al. Reference Park, Park, Yi, Cheul Kim, Lee and Choi2019). Consistently, relatively dry and cool conditions were inferred on Jeju Island, South Korea, between 4350 and 1920 yr BP based on a low ratio of arboreal pollen to total pollen, indicating forest shrinking (Park et al. Reference Park, Shin and Byrne2016). In Jingpo Lake, northeastern China, cool and dry conditions occurred during ∼5100 cal years BP to 3600 cal years BP, characterized by pollens from broadleaved taxa. The climatic condition shifted to a warmer and wetter climate during ∼3600 years BP to 2100 years BP based on pollen records of herb taxa (Chen et al. Reference Chen, Shen, Li, Zhang, Sun and Ji2015b). Although the pollen record does not reflect C3/C4 composition directly, it provides an independent proxy for regional climatic conditions in the East Asian monsoon region.
The strong EASM led to a rainfall maximum in Taiwan during the mid-Holocene, particularly between 8 and 4 ka BP, indicating high rainfall and temperatures (Ding et al. Reference Ding, Zheng, Zheng and Kao2020). The increase in rainfall and air temperature enhanced the pedogenic processes in the soils, such as argilluviation. During 4∼2 ka BP, a weak EASM occurred, leading to decreased rainfall and drought in Taiwan. Hence, calcification became the main pedogenic process, and thus carbonate nodules were generated in the soils during this interval. After 2 ka BP, the EASM rainfall shifted, causing high rainfall, which weakened calcification, resulting in fewer carbonate nodules being formed (Figure 4). During 4063 years BP and 690 years BP, the stable carbon isotopes in carbonate nodules reflect a vegetation that consisted of a mixture of C3 and C4 plants, with a predominance of C4 species. According to the estimation from climofunctions, the climate during this time frame was drier and cooler than the present, which can correspond to the formation of carbonate nodules in the studied area. However, the geochemical climofunction for MAP was developed based on modern soils in North America, and differences in climatic seasonality and parent materials in monsoonal regions may introduce systematic uncertainties in its application. Therefore, the reconstructed MAP values are interpreted as relative trends rather than absolute values. Besides, the potential effects of other pedogenic processes during this time frame cannot be excluded and are considered a source of uncertainty in this study.
6. Conclusions
Carbonate nodules were relictic features and were formed under paleoclimatic conditions. By radiocarbon dating, the carbonate nodules formed between 4063 years BP and 690 years BP. The stable carbon isotopes in carbonate nodules suggested a coexistence of C3 and C4 plants in a C4-dominated vegetation. The C4 plants are invasive and may act as the pioneer plants in the early post-regression of sea level. The stable oxygen isotopes in carbonate nodules implied a lower temperature than the present, with a mean annual temperature of 12.3 to 14.0 °C. The mean annual precipitation estimated by climofunctions was 1036 to 1342 mm during the formation of carbonate nodules, which was lower than the present. The climatic conditions were drier and cooler than present, which favoured the formation of carbonate nodules in the study area. This study highlights that the stable carbon and oxygen isotopes in carbonate nodules can serve as indicators of climatic conditions and as valuable proxies for paleoclimate reconstruction. However, the interpretation of the climatic conditions based on carbonate nodules in this study primarily reflects relative trends rather than precise absolute values. Nevertheless, uncertainties remain and require further refinement in future studies.
Supplementary material
To view supplementary material for this article, please visit https://doi.org/10.1017/RDC.2026.10228
Data availability
The data that support this study will be made available upon reasonable request.
Acknowledgments
The authors would like to thank the National Science and Technology Council, Taiwan, for financially supporting this research under Grant No. MOST 114-2313-B-002-033-MY3. The authors acknowledge the NTUAMS Lab for operating the AMS 14C dating.