1. Introduction
Interest in transitional wall-bounded shear flow dates back to early studies by Reynolds (Reference Reynolds1883), who noted that the flow in a pipe was sensitive to disturbances. Though much progress has been made, a full understanding of the phenomena has yet to be realized. One of the main challenges lies in the fact that linear stability analysis fails to accurately predict the Reynolds numbers at which flows are observed to transition to turbulence. For example, plane Couette flow is linearly stable for any Reynolds number (Romanov Reference Romanov1973) yet is observed to transition to turbulence at Reynolds numbers as low as  $360\pm 10$ (Tillmark & Alfredsson Reference Tillmark and Alfredsson1992). This failure has led researchers to study the mechanisms underlying transition by instead analysing energy growth. In particular, there has been an emphasis on characterizing the types of finite-amplitude perturbations that are most likely to lead to transition as well as the flow structures that dominate in this regime (e.g. Schmid & Henningson Reference Schmid and Henningson1992; Lundbladh, Henningson & Reddy Reference Lundbladh, Henningson and Reddy1994; Reddy et al. Reference Reddy, Schmid, Baggett and Henningson1998; Philip, Svizher & Cohen Reference Philip, Svizher and Cohen2007; Duguet, Brandt & Larsson Reference Duguet, Brandt and Larsson2010a; Duguet et al. Reference Duguet, Monokrousos, Brandt and Henningson2013; Farano et al. Reference Farano, Cherubini, Robinet and De Palma2015).
Reddy et al. (Reference Reddy, Schmid, Baggett and Henningson1998) examined the relative flow response of different transition-inducing flow perturbations in both plane Couette flow and Poiseuille flow through extensive direct numerical simulations (DNS). Those authors observed that both streamwise vortices and oblique waves require less energy density than random noise to trigger transition (Reddy et al. Reference Reddy, Schmid, Baggett and Henningson1998, figures 19 and 23) in both flows. They further showed that in Poiseuille flow even perturbations in the form of Tollmien–Schlichting (TS) waves, which are linearly unstable at  $Re>5772$ (Orszag Reference Orszag1971), require larger energy density to trigger transition than either streamwise vortices or oblique waves (Reddy et al. Reference Reddy, Schmid, Baggett and Henningson1998, figure 19). Similar behaviour has been observed in studies of the transient energy growth and input–output response of the linearized Navier–Stokes (LNS) equations (Reddy & Henningson Reference Reddy and Henningson1993; Jovanović & Bamieh Reference Jovanović and Bamieh2005). In fact, input–output analysis of channel flow suggests that streamwise constant structures have larger energy growth than the linearly unstable TS waves, even at supercritical Reynolds numbers (i.e. above the Reynolds number at which the laminar flow is no longer linearly stable) (Jovanović Reference Jovanović2004; Jovanović & Bamieh Reference Jovanović and Bamieh2004). Studies of the LNS have indicated that streamwise vortical structures represent both the initial condition (optimal perturbation) that leads to the largest energy growth (Gustavsson Reference Gustavsson1991; Butler & Farrell Reference Butler and Farrell1992; Reddy & Henningson Reference Reddy and Henningson1993; Schmid & Henningson Reference Schmid and Henningson2001) as well as the type of structure that sustains the highest energy growth (e.g. Farrell & Ioannou Reference Farrell and Ioannou1993; Bamieh & Dahleh Reference Bamieh and Dahleh2001; Jovanović & Bamieh Reference Jovanović and Bamieh2005). The importance of streamwise vortices was also confirmed by Bottin et al. (Reference Bottin, Dauchot, Daviaud and Manneville1998), who connected experimental results with this form of exact coherent structures in plane Couette flow.
On the other hand, the simulations of Schmid & Henningson (Reference Schmid and Henningson1992) and Reddy et al. (Reference Reddy, Schmid, Baggett and Henningson1998) as well as the experiments of Elofsson & Alfredsson (Reference Elofsson and Alfredsson1998) indicate that perturbations of oblique waves require slightly less energy than streamwise vortices to initiate transition. Nonlinear optimal perturbations (NLOP) to plane Couette flow, i.e. the initial perturbations that require the least energy to transition the flow from laminar to turbulent, also take the form of oblique waves that are localized in the streamwise direction (e.g. Duguet et al. Reference Duguet, Brandt and Larsson2010a, Reference Duguet, Monokrousos, Brandt and Henningson2013; Monokrousos et al. Reference Monokrousos, Bottaro, Brandt, Di Vita and Henningson2011; Rabin, Caulfield & Kerswell Reference Rabin, Caulfield and Kerswell2012; Cherubini & De Palma Reference Cherubini and De Palma2013, Reference Cherubini and De Palma2015). For plane Poiseuille flow, hairpin vortices associated with the very short time scale of the Orr mechanism represent the NLOP (Farano et al. Reference Farano, Cherubini, Robinet and De Palma2015, Reference Farano, Cherubini, Robinet and De Palma2016). These results suggest that traditional linear analysis does not capture the full range of highly amplified structures in transitional flows.
Recent experiments and DNS of plane Couette flow with very large channel size ( ${\sim }O(100)$ times the channel half-height) have also uncovered oblique turbulent bands (turbulent stripes) in the transitional flow regime of wall-bounded shear flows (e.g. Prigent et al. Reference Prigent, Grégoire, Chaté, Dauchot and van Saarloos2002, Reference Prigent, Grégoire, Chaté and Dauchot2003; Duguet, Schlatter & Henningson Reference Duguet, Schlatter and Henningson2010b; De Souza, Bergier & Monchaux Reference De Souza, Bergier and Monchaux2020; Tuckerman, Chantry & Barkley Reference Tuckerman, Chantry and Barkley2020). These turbulent–laminar patterns were also observed in DNS of transitional plane Poiseuille flow with sufficiently large channel size (Tsukahara et al. Reference Tsukahara, Seki, Kawamura and Tochio2005; Xiong et al. Reference Xiong, Tao, Chen and Brandt2015; Kanazawa Reference Kanazawa2018; Tao, Eckhardt & Xiong Reference Tao, Eckhardt and Xiong2018; Shimizu & Manneville Reference Shimizu and Manneville2019; Song & Xiao Reference Song and Xiao2020; Xiao & Song Reference Xiao and Song2020). The presence of such structures was later confirmed by experiments (Hashimoto et al. Reference Hashimoto, Hasobe, Tsukahara, Kawaguchi and Kawamura2009; Paranjape Reference Paranjape2019; Paranjape, Duguet & Hof Reference Paranjape, Duguet and Hof2020, figure 1). There is strong evidence that the mechanisms leading to the growth and maintenance of these oblique turbulent bands are nonlinear in both plane Couette flow (Barkley & Tuckerman Reference Barkley and Tuckerman2007; Tuckerman & Barkley Reference Tuckerman and Barkley2011; Duguet & Schlatter Reference Duguet and Schlatter2013) and plane Poiseuille flow (Tuckerman et al. Reference Tuckerman, Kreilos, Schrobsdorff, Schneider and Gibson2014). That view has been further supported by analysis of exact equilibrium and travelling wave solutions of the nonlinear Navier–Stokes (NS) equations (e.g. for plane Couette flow (Deguchi & Hall Reference Deguchi and Hall2015; Reetz, Kreilos & Schneider Reference Reetz, Kreilos and Schneider2019) and Poiseuille flow (Paranjape et al. Reference Paranjape, Duguet and Hof2020)).
The literature described above points to the benefit of nonlinear methods in characterizing the full range of flow structures in transitional channel flow. However, these methods have far larger computational costs than linear analysis methods (e.g. Kerswell, Pringle & Willis Reference Kerswell, Pringle and Willis2014; Kerswell Reference Kerswell2018). This trade-off between obtaining a more comprehensive characterization of the phenomena and analysis that is computationally tractable is long-standing. However, there is significant evidence to suggest that insight can be gained through parametrizing or bounding the effect of the nonlinearity rather than undertaking the full computational burden of resolving it. For example, Kreiss, Lundbladh & Henningson (Reference Kreiss, Lundbladh and Henningson1994) and Chapman (Reference Chapman2002) employed a bound on the nonlinearity to derive a finite-amplitude permissible perturbation that a flow could sustain while remaining laminar. More recently, finite-amplitude stability analysis of transitional shear flows employed local componentwise (sector) bounds on the nonlinearity and exploited the passivity of the nonlinear operator to develop linear-matrix-inequality-based approaches to compute bounds on permissible perturbations for a range of shear flow models (e.g. Kalur, Seiler & Hemati Reference Kalur, Seiler and Hemati2021b, Reference Kalur, Seiler and Hemati2020; Kalur et al. Reference Kalur, Mushtaq, Seiler and Hemati2021a; Liu & Gayme Reference Liu and Gayme2020b). The inclusion of information about the nonlinear behaviour produced results that matched simulation data better than those derived through previous linear approaches. Data-driven methods to parametrize or colour (in space or time) the input (forcing) applied to the dynamics linearized around the turbulent mean velocity have also enabled nonlinear effects to be captured within the input–output framework, leading to better prediction of flow statistics (Chevalier et al. Reference Chevalier, Hœpffner, Bewley and Henningson2006; Zare, Jovanović & Georgiou Reference Zare, Jovanović and Georgiou2017; Morra et al. Reference Morra, Nogueira, Cavalieri and Henningson2021; Nogueira et al. Reference Nogueira, Morra, Martini, Cavalieri and Henningson2021). The effect of the nonlinearity in the NS equations has also been incorporated directly into input–output and resolvent analysis through shaping or parametrizing the forcing, e.g. by including larger-amplitude forcing in the near-wall region (Jovanović & Bamieh Reference Jovanović and Bamieh2001; Hœpffner et al. Reference Hœpffner, Chevalier, Bewley and Henningson2005).
In this work, we build on this notion of including the effect of the nonlinearity within a computationally tractable linear framework using the concept of a structured uncertainty (e.g. Packard & Doyle Reference Packard and Doyle1993; Zhou, Doyle & Glover Reference Zhou, Doyle and Glover1996). In particular, we partition the NS equations into a feedback interconnection between the linearized dynamics and a model of the nonlinear forcing, as shown in figure 1. We then structure the feedback to enforce a block-diagonal structure (bottom block outlined by the blue dashed rectangle). In particular, the feedback defines the componentwise inputs to the linearized momentum equations, which are modelled in terms of an uncertain gain  $-\boldsymbol {u}_{\xi }$ of an input–output mapping from each component
 $\boldsymbol {\nabla } u$,
 $\boldsymbol {\nabla } v$ and
 $\boldsymbol {\nabla } w$ to the respective forcings
 $f_{x,\xi }$,
 $f_{y,\xi }$ and
 $f_{z,\xi }$. We represent this gain using the structured singular value (Doyle Reference Doyle1982; Safonov Reference Safonov1982),
 $\mu$, which we use to define the largest gain under the structured forcing (Packard & Doyle Reference Packard and Doyle1993). Conceptually the approach allows us to develop a feedback interconnection between the LNS equations and a structured forcing that is explicitly constrained to preserve the componentwise structure of the nonlinearity in the NS equations.
Block diagram representing the structured input–output feedback interconnection between the linearized dynamics and structured forcing modelling the nonlinearity (in the blue dashed region). In particular, each component of the forcing is modelled as an input–output mapping from the respective component of the velocity gradient  $\boldsymbol {\nabla } u$,
 $\boldsymbol {\nabla } v$,
 $\boldsymbol {\nabla } w$ to the respective component forcings
 $f_{x,\xi }$,
 $f_{y,\xi }$,
 $f_{z,\xi }$ of the linearized dynamics with the gain
 $-\boldsymbol {u}_{\xi }$ defined in terms of the structured singular value of a linearized closed-loop system response.

Structured input–output analysis shares the advantages of all methods employing analysis of the spatio-temporal frequency response, which this work builds upon (e.g. Farrell & Ioannou Reference Farrell and Ioannou1993; Bamieh & Dahleh Reference Bamieh and Dahleh2001; Jovanović & Bamieh Reference Jovanović and Bamieh2005; McKeon & Sharma Reference McKeon and Sharma2010; McKeon, Sharma & Jacobi Reference McKeon, Sharma and Jacobi2013; McKeon Reference McKeon2017; Illingworth, Monty & Marusic Reference Illingworth, Monty and Marusic2018; Vadarevu et al. Reference Vadarevu, Symon, Illingworth and Marusic2019; Madhusudanan, Illingworth & Marusic Reference Madhusudanan, Illingworth and Marusic2019; Symon, Illingworth & Marusic Reference Symon, Illingworth and Marusic2021; Liu & Gayme Reference Liu and Gayme2019, Reference Liu and Gayme2020a). Of greatest interest in this work is its computational tractability compared with nonlinear approaches and the lack of finite channel size effects that can plague both DNS and experimental studies. This approach is most closely related to the analysis of the largest singular value ( $\mathcal {H}_\infty$ norm) of the spatio-temporal frequency response of the linearized dynamics (top block of figure 1), which measures the structure that sustains the highest input–output growth (e.g. Jovanović Reference Jovanović2004; Schmid Reference Schmid2007; Hwang & Cossu Reference Hwang and Cossu2010a,Reference Hwang and Cossub; Illingworth Reference Illingworth2020). However, in those works the forcing is assumed to excite the dynamics at all frequencies (e.g. delta-correlated spatio-temporal white noise); in this sense, it can be thought of as the open-loop response of the top block in figure 1.
We apply the proposed structured input–output analysis to transitional plane Couette and plane Poiseuille flows. The results indicate that the addition of a structured feedback interconnection enables identification and analysis of the wider range of transition-inducing flow structures identified in the literature without the computational burden of nonlinear optimization or extensive simulations. More specifically, the results for transitional plane Couette flow reproduce results from DNS-based analysis (Reddy et al. Reference Reddy, Schmid, Baggett and Henningson1998) and predictions of NLOP approaches (Rabin et al. Reference Rabin, Caulfield and Kerswell2012), which both indicate that oblique waves require less energy to induce transition than the streamwise elongated structures emphasized in traditional input–output analysis. In plane Poiseuille flow, these transition-inducing flow structures are consistent with DNS (Reddy et al. Reference Reddy, Schmid, Baggett and Henningson1998) emphasizing oblique waves and NLOP analysis that highlights the importance of spatially localized structures with streamwise wavelengths larger than their spanwise extent (Farano et al. Reference Farano, Cherubini, Robinet and De Palma2015). The proposed approach also reproduces the characteristic wavelengths and angle of the oblique turbulent band observed in very-large-channel studies of transitional plane Couette flow (Prigent et al. Reference Prigent, Grégoire, Chaté and Dauchot2003). The wavelengths of oblique turbulent bands in transitional plane Poiseuille flow with very large channel size (Kanazawa Reference Kanazawa2018) also fall within the range of flow structures showing large structured input–output response.
The agreement between predictions from structured input–output analysis and observations from experiments, DNS and NLOP analysis show that this framework captures important nonlinear effects. In particular, the results suggest that restricting the feedback in a componentwise manner preserves the structure of the nonlinear mechanisms that weaken the streaks developed through the lift-up effect, in which cross-stream forcing amplifies streamwise streaks (Ellingsen & Palm Reference Ellingsen and Palm1975; Landahl Reference Landahl1975; Brandt Reference Brandt2014). Traditional input–output analysis instead predicts the dominance of streamwise elongated structures associated with the lift-up mechanism (see e.g. the discussion in Jovanović (Reference Jovanović2021)). An examination of Reynolds number trends supports the notion that imposing a structured feedback interconnection based on certain input–output properties associated with the nonlinearity in the NS equations leads to a weakening of the amplification of streamwise elongated structures.
The remainder of this paper is organized as follows. Section 2 describes the flow configurations of interest and the details of the structured input–output analysis approach. Section 3 analyses the results obtained from the application of structured input–output analysis to both plane Couette flow and plane Poiseuille flow. We then analyse Reynolds number dependence in § 4. The paper is concluded in § 5.
2. Formulating the structured input–output model
2.1. Governing equations
We consider incompressible flow between two infinite parallel plates and employ  $x$,
 $y$ and
 $z$ to respectively denote the streamwise, wall-normal and spanwise directions. The corresponding velocity components are denoted by
 $u$,
 $v$ and
 $w$. The coordinate frames and configurations used for plane Couette flow and plane Poiseuille flow are shown in figure 2. We express the velocity field as a vector
 $\boldsymbol {u}_{{tot}}=[u_{{tot}}\ v_{{tot}}\ w_{{tot}}]^\text {T}$ with superscript ‘T’ indicating the transpose. We then decompose the velocity field into the sum of a laminar base flow (
 $U(y)=y$ for plane Couette flow and
 $U(y)=1-y^2$ for plane Poiseuille flow) and fluctuations about the base flow
 $\boldsymbol {u}$; i.e.
 $\boldsymbol {u}_{{tot}}=U(y)\boldsymbol {e}_x+\boldsymbol {u}$ with
 $\boldsymbol {e}_x$ denoting the
 $x$ direction (streamwise) unit vector. The pressure field is similarly decomposed into
 $p_{{tot}}=P+p$. The dynamics of the fluctuations
 $\boldsymbol {u}$ and
 $p$ is governed by the NS equations:
 $$\begin{gather} \partial_{t} \boldsymbol{u} + U\partial_x \boldsymbol{u} + v\,\frac{dU }{\textrm{d} y}\boldsymbol{e}_x +\boldsymbol{\nabla} p -\frac{1}{Re}{\nabla}^2 \boldsymbol{u} ={-} \boldsymbol{u} \boldsymbol{\cdot} \boldsymbol{\nabla} \boldsymbol{u}, \end{gather}$$
 $$\begin{gather}\boldsymbol{\nabla} \boldsymbol{\cdot} \boldsymbol{u}=0. \end{gather}$$
Here, the spatial variables are normalized by the channel half-height  $h$: e.g.
 $y=y_*/h\in [-1,1]$, where the subscript
 $*$ indicates dimensional quantities. The velocity is normalized by a nominal characteristic velocity
 $U_n$, where
 $\pm U_n$ is the velocity at the channel walls for plane Couette flow and
 $U_n$ is the channel centreline velocity for plane Poiseuille flow. Time and pressure are normalized by
 $h/U_n$ and
 $\rho U_n^2$, respectively. The Reynolds number is defined as
 $Re=U_nh/\nu$, where
 $\nu$ is the kinematic viscosity. In (2.1),
 $\boldsymbol {\nabla }:=\left [\partial _x \enspace \partial _y \enspace \partial _z\right ]^\text {T}$ represents the gradient operator and
 $\nabla ^2:=\partial _x^2+\partial _y^2+\partial _z^2$ represents the Laplacian operator. We impose no-slip boundary conditions at the wall; i.e.
 $\boldsymbol {u}(y=\pm 1)=\boldsymbol {0}$ for both flows. Finally, we write the nonlinear term in (2.1a) as
 \begin{equation} \boldsymbol{f}:={-}\boldsymbol{u}\boldsymbol{\cdot} \boldsymbol{\nabla }\boldsymbol{u}=\left[-\boldsymbol{u}\boldsymbol{\cdot} \boldsymbol{\nabla }u \quad -\boldsymbol{u}\boldsymbol{\cdot} \boldsymbol{\nabla }v\quad -\boldsymbol{u}\boldsymbol{\cdot} \boldsymbol{\nabla}w\right]^\text{T}=:\left[f_x\quad f_y\quad f_z\right]^\text{T}, \end{equation}
where  $=:$ indicates that the right-hand side is defined by the left-hand side. We refer to
 $f_x$,
 $f_y$ and
 $f_z$ as the respective streamwise, wall-normal and spanwise components of the nonlinearity and collectively as the nonlinear components of (2.1). This expression of the nonlinearity as forcing terms makes (2.1) into a set of forced linear evolution equations. This approach builds on the growing body of work that has shown promise in capturing critical features of this forced system response using linear analysis techniques (see e.g. the reviews of Schmid (Reference Schmid2007), McKeon (Reference McKeon2017) and Jovanović (Reference Jovanović2021) and references therein).
Illustrations of flows between two parallel flat plates: (a) plane Couette flow with laminar base flow  $\boldsymbol {U}(y)=y\boldsymbol {e}_x$ and (b) plane Poiseuille flow with laminar base flow
 $\boldsymbol {U}(y)=(1-y^2)\boldsymbol {e}_x$.

We next construct the model of the nonlinearity that will allow us to build the feedback interconnection of figure 1. The velocity field  $-\boldsymbol {u}$ in (2.2) associated with the forcing components can be viewed as the gain operator of an input–output system in which the velocity gradients
 $\boldsymbol {\nabla } u$,
 $\boldsymbol {\nabla } v$ and
 $\boldsymbol {\nabla } w$ act as the respective inputs and the forcing components f x,
 $f_y$ and
 $f_z$ act as the respective outputs. It is this gain that we seek to model through
 $-\boldsymbol {u}_{\xi }$ in figure 1. This input–output model of the nonlinear components is given by
 \begin{align}
\boldsymbol{f}_{\xi}:={-}\boldsymbol{u}_{\xi}\boldsymbol{\cdot}
\boldsymbol{\nabla
}\boldsymbol{u}=[-\boldsymbol{u}_{\xi}\boldsymbol{\cdot}
\boldsymbol{\nabla }u \quad
-\boldsymbol{u}_{\xi}\boldsymbol{\cdot} \boldsymbol{\nabla
}v\quad -\boldsymbol{u}_{\xi}\boldsymbol{\cdot}
\boldsymbol{\nabla}w]^\text{T}=:\left[f_{x,\xi}\quad
f_{y,\xi}\quad f_{z,\xi}\right]^\text{T},
\end{align}
where  $-\boldsymbol {u}_{\xi }=[-u_\xi ,-v_\xi ,-w_\xi ]^\text {T}$ maps the corresponding velocity gradient into each component of the modelled forcing driving the linearized dynamics. The next subsection describes how we construct this input–output map so that it enables us to analyse the perturbations that are most likely to induce transition using the structured singular value formalism (Packard & Doyle Reference Packard and Doyle1993; Zhou et al. Reference Zhou, Doyle and Glover1996).
2.2. Structured input–output response
We now define the spatio-temporal frequency response  $\mathcal {H}_{{\nabla }}(y;k_x,k_z,\omega )$ that will form the basis of the structured input–output response. We first perform the standard transformation to express the dynamics (2.1) in terms of the wall-normal velocity
 $v$ and wall-normal vorticity
 $\omega _y:=\partial _z u-\partial _x w$ (Schmid & Henningson Reference Schmid and Henningson2001), which enforces (2.1b) and eliminates the pressure dependence. This formulation similarly imposes the divergence-free condition on the forcing model, since any component of the input forcing that can be written as the gradient of a scalar function
 $\,\boldsymbol{f}_{\phi}=\boldsymbol{\nabla}\phi$ will be absorbed into the pressure gradient and eliminated. We then exploit the shift-invariance in the
 $(x,z)$ spatial directions of the two flow configurations of interest and assume invariance to shifts in
 $t$, which allows us to perform the following triple Fourier transform for a variable
 $\psi$:
 \begin{equation} \hat{\psi}(y;k_x,k_z,\omega):=\int\limits_{-\infty}^{\infty} \int\limits_{-\infty}^{\infty}\int\limits_{-\infty}^{\infty}\psi(x,y,z,t) \exp({-\text{i}(k_x x + k_z z+\omega t )})\,{\textrm{d}\kern0.7pt x}\,\textrm{d}z\,\textrm{d}t, \end{equation}
where  $\text {i}=\sqrt {-1}$ is the imaginary unit,
 $\omega$ is the temporal frequency and
 $k_x = 2{\rm \pi} /\lambda _x$ and
 $k_z = 2{\rm \pi} /\lambda _z$ are the respective dimensionless
 $x$ and
 $z$ wavenumbers.
The resulting system of equations describing the transformed linearized equations subject to the modelled forcing  $\boldsymbol {f}_{\xi }$ is
 \begin{equation} \text{i}\omega\begin{bmatrix} \hat{v}\\ \hat{\omega}_y \end{bmatrix}=\hat{\mathcal{A}}\begin{bmatrix} \hat{v}\\ \hat{\omega}_y \end{bmatrix}+\hat{\mathcal{B}}\begin{bmatrix}\hat{f}_{x,\xi}\\ \hat{\,f}_{y,\xi}\\ \hat{\,f}_{z,\xi}\end{bmatrix},\quad \begin{bmatrix}\hat{u}\\ \hat{v}\\ \hat{w}\end{bmatrix}=\hat{\mathcal{C}}\begin{bmatrix} \hat{v}\\ \hat{\omega}_y \end{bmatrix}. \end{equation}
The operators in (2.5) are defined following Jovanović & Bamieh (Reference Jovanović and Bamieh2005):
 \begin{gather} \hat{\mathcal{A}}(k_x,k_z):=\begin{bmatrix}\hat{{\nabla}}^2 & 0\\ 0 & \mathcal{I} \end{bmatrix}^{{-}1}\begin{bmatrix} -\text{i}k_xU{\hat{\nabla}}^2+\text{i}k_xU''+\hat{{\nabla}}^4/Re & 0\\ -\text{i}k_zU' & -\text{i}k_x U+\hat{{\nabla}}^2/Re \end{bmatrix}, \end{gather}
 \begin{gather}\hat{\mathcal{B}}(k_x,k_z):= \begin{bmatrix}\hat{{\nabla}}^2 & 0\\ 0 & \mathcal{I} \end{bmatrix}^{{-}1} \begin{bmatrix} -\text{i}k_x\partial_y & -(k_x^2+k_z^2) & -\text{i}k_z \partial_y\\ \text{i}k_z & 0 & -\text{i}k_x \end{bmatrix}, \end{gather}
 \begin{gather}\hat{\mathcal{C}}(k_x,k_z):=\frac{1}{k_x^2+k_z^2}\begin{bmatrix} \text{i}k_x\partial_y & -\text{i}k_z\\ k_x^2+k_z^2 & 0\\ \text{i}k_z \partial_y & \text{i}k_x \end{bmatrix}, \end{gather}
where  $U':=\textrm {d}U(y)/{\textrm {d} y}$,
 $U'':=\textrm {d}^2U(y)/{\textrm {d} y}^2$,
 $\hat {{\nabla }}^2:=\partial _{yy}-k_x^2-k_z^2$ and
 $\hat {\nabla }^4:=\partial ^{(4)}_{y}-2(k_x^2+k_z^2)\partial _{yy}+(k_x^2+k_z^2)^2$. The boundary conditions, which can be derived from the no-slip conditions, are
 \begin{equation} \hat{v}(y={\pm} 1)= \frac{\partial \hat{v}}{\partial y}(y=\pm1)=\hat{\omega}_y(y={\pm} 1)=0. \end{equation}
The spatio-temporal frequency response  $\mathcal {H}$ of the system in (2.5) that maps the input forcing
 $\hat {\boldsymbol {f}}_{\xi }(y;k_x,k_z,\omega )$ to the velocity vector
 $\hat {\boldsymbol {u}}(y;k_x,k_z,\omega )$ at the same spatio-temporal wavenumber–frequency triplet, i.e.
 $\hat {\boldsymbol {u}}(y;k_x,k_z,\omega )=\mathcal {H}(y;k_x,k_z,\omega )\hat {\boldsymbol {f}}_{\xi }(y;k_x,k_z,\omega )$, is given by
 \begin{equation} \mathcal{H}(y;k_x,k_z,\omega):=\hat{\mathcal{C}}(\text{i}\omega\,\mathcal{I}_{2\times 2}-\hat{\mathcal{A}})^{{-}1}\hat{\mathcal{B}}. \end{equation}
Here  $\mathcal {I}_{2\times 2}:=\text {diag}(\mathcal {I},\mathcal {I})$, where
 $\mathcal {I}$ is the identity operator and
 $\text {diag}(\cdot )$ indicates a block diagonal operation. Following the language in Jovanović (Reference Jovanović2021), we also refer to
 $\mathcal {H}(y; k_x,k_y, \omega )$ defined in (2.8) as the frequency response operator.
The linear form of (2.3) allows us to also perform the spatio-temporal Fourier transform (2.4) on this forcing model to obtain
 \begin{equation} \hat{\boldsymbol{f}}_{\xi}={-}\hat{\boldsymbol{u}}_{\xi}\boldsymbol{\cdot}\hat{\boldsymbol{\nabla}} \hat{\boldsymbol{u}}= \begin{bmatrix} \hat{\,f}_{x,\xi}\\ \hat{f}_{y,\xi}\\ \hat{f}_{z,\xi} \end{bmatrix}=\begin{bmatrix} -\boldsymbol{\hat{u}}_{\xi}^{\text{T}} & & \\ & -\boldsymbol{\hat{u}}_{\xi}^{\text{T}} & \\ & & -\boldsymbol{\hat{u}}_{\xi}^{\text{T}} \end{bmatrix}\begin{bmatrix} \hat{\boldsymbol{\nabla}}\hat{u}\\ \hat{\boldsymbol{\nabla}}\hat{v}\\ \hat{\boldsymbol{\nabla}}\hat{w} \end{bmatrix}, \end{equation}
which can be decomposed as
 \begin{equation} \begin{bmatrix} \hat{\,f}_{x,\xi}\\ \hat{f}_{y,\xi}\\ \hat{f}_{z,\xi} \end{bmatrix}=\text{diag}\left(-\hat{\boldsymbol{u}}_{\xi}^{\text{T}} ,-\hat{\boldsymbol{u}}_{\xi}^{\text{T}},- \hat{\boldsymbol{u}}_{\xi}^{\text{T}} \right)\text{diag}\left(\hat{\boldsymbol{\nabla}},\hat{\boldsymbol{\nabla}}, \hat{\boldsymbol{\nabla}}\right)\begin{bmatrix} \hat{u}\\ \hat{v}\\ \hat{w} \end{bmatrix}. \end{equation}
This decomposition of the forcing function is illustrated in the two blocks inside the blue dashed region in figure 3(a), where the velocity field arising from the spatio-temporal frequency response  $\mathcal {H}$ is the input and the forcing is the output.
Illustration of feedback interconnection associated with structured input–output analysis: (a) a componentwise description, where blocks inside of the blue dashed region represent the modelled forcing in (2.10) corresponding to the bottom block of figure 1; (b) a high-level description after discretization.

In order to isolate the gain  $-\boldsymbol {u}_{\xi }$ that we seek to model, it is analytically convenient to combine the linear gradient operator with the spatio-temporal frequency response. The resulting modified frequency response operator is
 \begin{equation} \mathcal{H}_{{\nabla}}(y;k_x,k_z,\omega):=\text{diag}(\hat{\boldsymbol{\nabla}}, \hat{\boldsymbol{\nabla}},\hat{\boldsymbol{\nabla}})\mathcal{H}(y;k_x,k_z, \omega). \end{equation}
We note that this operator in (2.11) can be also obtained by modifying  $\hat {\mathcal {C}}$ in (2.8) such that the output corresponds to a vectorized velocity gradient. Finally, we redraw the system as a feedback interconnection between this linear operator in (2.11) and the structured uncertainty
 \begin{equation} \hat{\boldsymbol{u}}_{\varXi}:=\text{diag}\left(-\hat{\boldsymbol{u}}_{\xi}^{\text{T}} ,-\hat{\boldsymbol{u}}_{\xi}^{\text{T}},-\hat{\boldsymbol{u}}_{\xi}^{\text{T}} \right). \end{equation}
The structured uncertainty  $\hat {\boldsymbol {u}}_{\varXi }$ in (2.12) has a block-diagonal structure such that the resulting feedback interconnection leads to a forcing model that retains the componentwise structure of the nonlinearity. Figure 3(b) describes the resulting feedback interconnection between the modified spatio-temporal frequency response and the structured uncertainty, where
 $\boldsymbol{\mathsf{H}}_{{\nabla }}$ and
 $\hat {\boldsymbol{\mathsf{u}}}_{\varXi }$ respectively represent the spatial discretizations (numerical approximations) of
 $\mathcal {H}_{{\nabla }}$ in (2.11) and
 $\hat {\boldsymbol {u}}_{\varXi }$ in (2.12).
We are interested in characterizing the perturbations associated with the most amplified flow structures under structured forcing. This amplification under structured forcing can be quantified by the structured singular value of the modified frequency response operator  $\mathcal {H}_{{\nabla }}$ (see e.g. Packard & Doyle (Reference Packard and Doyle1993, definition 3.1) and Zhou et al. (Reference Zhou, Doyle and Glover1996, definition 11.1)), which is defined as follows.
Definition 2.1 Given wavenumber and frequency pair  $(k_x,k_z,\omega )$, the structured singular value
 $\mu _{\hat {\boldsymbol{\mathsf{U}}}_{\varXi }}[\boldsymbol{\mathsf{H}}_{{\nabla }}(k_x,k_z,\omega )]$ is defined as
 \begin{equation}
\mu_{\hat{\boldsymbol{\mathsf{U}}}_{\varXi}}[\boldsymbol{\mathsf{H}}_{{\nabla}}(k_x,k_z,\omega)]:=\frac{1}{
\text{min}\{\bar{\sigma}[\hat{\boldsymbol{\mathsf{u}}}_{\varXi}]\,:\,\hat{\boldsymbol{\mathsf{u}}}_{\varXi}\in
\hat{\boldsymbol{\mathsf{U}}}_{\varXi},\,\text{det}[\boldsymbol{\mathsf{I}}-\boldsymbol{\mathsf{H}}_{{\nabla}}(k_x,k_z,\omega)
\hat{\boldsymbol{\mathsf{u}}}_{\varXi}]=0\}},\end{equation}
unless no  $\hat {\boldsymbol{\mathsf{u}}}_{\varXi }\in \hat {\boldsymbol{\mathsf{U}}}_{\varXi }$ makes
 $\boldsymbol{\mathsf{I}}-\boldsymbol{\mathsf{H}}_{{\nabla }}\hat {\boldsymbol{\mathsf{u}}}_{\varXi }$ singular, in which case
 $\mu _{\hat {\boldsymbol{\mathsf{U}}}_{\varXi }}[\boldsymbol{\mathsf{H}}_{{\nabla }}]:=0$.
Here,  $\bar {\sigma }[\cdot ]$ is the largest singular value,
 $\text {det}[\cdot ]$ is the determinant of the argument and
 $\boldsymbol{\mathsf{I}}$ is the identity matrix. The subscript of
 $\mu$ in (2.13) is a set
 $\hat {\boldsymbol{\mathsf{U}}}_{\varXi }$ containing all uncertainties having the same block-diagonal structure as
 $\hat {\boldsymbol{\mathsf{u}}}_{\varXi }$; i.e.
 \begin{equation}
\hat{\boldsymbol{\mathsf{U}}}_{\varXi}:=\{\text{diag}(-\hat{\boldsymbol{\mathsf{u}}}_{\xi}^{\text{T}},-\hat{\boldsymbol{\mathsf{u}}}_{\xi}^{\text{T}},-
\hat{\boldsymbol{\mathsf{u}}}_{\xi}^{\text{T}}):-\hat{\boldsymbol{\mathsf{u}}}^{\text{T}}_{\xi}\in
\mathbb{C}^{N_y\times 3N_y}\},
\end{equation}
where  $N_y$ denotes the number of grid points in
 $y$.
For ease of computation and analysis, the form of the structured uncertainty in (2.14) allows the full degrees of freedom for the complex matrix  $-\hat {\boldsymbol{\mathsf{u}}}^{\text {T}}_{\xi }\in \mathbb {C}^{N_y\times 3N_y}$. A natural refinement to better represent the physics would be to enforce a diagonal structure for each of the sub-blocks of this matrix. This approach is not pursued here because it requires extensions of both the analysis and computational tools to properly evaluate the response. These extensions are beyond the scope of the current work.
The largest structured singular value across all temporal frequencies characterizes the largest response associated with a stable structured feedback interconnection (i.e. the full block diagram in figure 3b). Here, stability is defined in terms of the small gain theorem (Zhou et al. Reference Zhou, Doyle and Glover1996, theorem 11.8).
Proposition 2.2 (small gain theorem)
Given  $0<\beta <\infty$ and wavenumber pair
 $(k_x,k_z)$. The loop shown in figure 3(b) is stable for all
 $\hat {\boldsymbol{\mathsf{u}}}_{\varXi }\in \hat {\boldsymbol{\mathsf{U}}}_{\varXi }$ with
 $\|\hat {\boldsymbol{\mathsf{u}}}_{\varXi }\|_{\infty }:={{\rm sup}}_{\omega \in \mathbb {R}}\,\bar {\sigma }[\hat {\boldsymbol{\mathsf{u}}}_{\varXi }]<{1}/{\beta }$ if and only if:
 \begin{equation} \|\mathcal{H}_{{\nabla}}\|_{\mu}(k_x,k_z):=\underset{\omega \in \mathbb{R}}{{\rm sup}}\,\mu_{\hat{\boldsymbol{\mathsf{U}}}_{\varXi}}[\boldsymbol{\mathsf{H}}_{{\nabla}}(k_x,k_z,\omega)]\leqslant \beta. \end{equation}
Here,  $\text {sup}$ represents supremum (least upper bound) operation, and we abuse the notation by writing
 $\|\cdot \|_{\mu }$ (Packard & Doyle Reference Packard and Doyle1993), although the quantity in (2.15) is not a proper norm (i.e. it does not necessarily satisfy the triangle inequality). This value
 $\|\mathcal {H}_{{\nabla }}\|_{\mu }(k_x,k_z)$ in (2.15) directly quantifies most amplified flow structures (characterized by the associated (
 $k_x,k_z$) pair) under structured forcing. This quantity is closely related to that obtained from input–output analysis based on the
 $\mathcal {H}_{\infty }$ norm (Jovanović Reference Jovanović2004; Schmid Reference Schmid2007; Illingworth Reference Illingworth2020) and characterizations of transient growth (e.g. Schmid Reference Schmid2007), where flow structures with high amplification under external input forcing or high transient energy growth are associated with transition.
2.3. Numerical method
The operators in (2.6) are discretized using the Chebyshev differentiation matrices generated by the MATLAB routines of Weideman & Reddy (Reference Weideman and Reddy2000). The boundary conditions in (2.7) are implemented following Trefethen (Reference Trefethen2000, chapters 7 and 14). We employ the Clenshaw–Curtis quadrature (Trefethen Reference Trefethen2000, chapter 12) in computing both singular and structured singular values to ensure that they are independent of the number of Chebyshev spaced wall-normal grid points. The numerical implementation of the operators is validated through comparisons of the plane Poiseuille flow results for computations of the  $\mathcal {H}_\infty$ norm in Jovanović (Reference Jovanović2004, chapter 8.1.2) and Schmid (Reference Schmid2007, figure 5), and plane Couette flow in Jovanović (Reference Jovanović2004, chapter 8.2). We use
 $N_y=30$ collocation points (excluding the boundary points), which is the same number employed in Jovanović & Bamieh (Reference Jovanović and Bamieh2005) and Jovanović (Reference Jovanović2004). We verified that doubling the number of collocation points in the wall-normal direction does not alter the results, indicating grid convergence. We employ, respectively,
 $50$ and
 $90$ logarithmically spaced points in the spectral range
 $k_x \in [10^{-4},10^{0.48}]$ and
 $k_z \in [10^{-2},10^{1.2}]$ which is similar to the numbers of points and ranges employed in Jovanović & Bamieh (Reference Jovanović and Bamieh2005).
We compute  $\|\mathcal {H}_{{\nabla }}\|_{\mu }$ in (2.15) for each wavenumber pair
 $(k_x,k_z)$ using the mussv command in the Robust Control Toolbox (Balas et al. Reference Balas, Chiang, Packard and Safonov2005) of MATLAB R2020a. The arguments of mussv employed here include the state-space model of
 $\boldsymbol{\mathsf{H}}_{{\nabla }}$ that samples the frequency domain adaptively. (The command mussv can adaptively sample frequency domain
 $\omega \in \mathbb {R}^+$, and the frequency domain
 $\omega \in \mathbb {R}^-$ can be computed by modifying the state-space model.) The BlockStructure argument comprises three full
 $N_y\times 3N_y$ complex matrices, and we use the ‘Uf’ algorithm option. The average computation time for each wavenumber pair
 $(k_x,k_z)$ is around
 $11$ s on a computer with a 3.4 GHz Intel Core i7-3770 CPU and 16 GB RAM. These computations can be easily parallelized over either the
 $k_x$ or
 $k_z$ domain using, for example, the parfor command in the Parallel Computing Toolbox in MATLAB.
3. Structured spatio-temporal frequency response
In this section, we use  $\|\mathcal {H}_{{\nabla }}\|_{\mu }(k_x,k_z)$ in (2.15) to characterize the flow structures (i.e. the (
 $k_x$,
 $k_z$) wavenumber pairs) that are most amplified in transitional plane Couette flow and plane Poiseuille flow. In order to illustrate the relative effect of the feedback interconnection versus the imposed structure we compare the results with
 \begin{equation} \|\mathcal{H}\|_{\infty}(k_x,k_z):=\underset{\omega \in \mathbb{R}}{\text{sup}}\,\bar{\sigma}[\boldsymbol{\mathsf{H}}(k_x,k_z,\omega)],\end{equation}
where  $\boldsymbol{\mathsf{H}}$ is the discretization of spatio-temporal frequency response operator
 $\mathcal {H}$ in (2.8). This quantity, which was previously analysed for transitional flows (Jovanović Reference Jovanović2004; Schmid Reference Schmid2007; Illingworth Reference Illingworth2020), describes the maximum singular value of the frequency response operator
 $\mathcal {H}$. This quantity represents the maximal gain of
 $\mathcal {H}$ over all temporal frequencies, i.e. the worst-case amplification over harmonic inputs. Therefore the highest values of
 $\|\mathcal {H}\|_\infty$ correspond to structures that are most amplified but not those with the largest sustained energy density that is often reported in the literature (e.g. Farrell & Ioannou Reference Farrell and Ioannou1993; Bamieh & Dahleh Reference Bamieh and Dahleh2001; Jovanović & Bamieh Reference Jovanović and Bamieh2005).
In order to isolate the effect of the structure imposed on the nonlinearity from the effect of the closed-loop feedback interconnection, we also compute
 \begin{equation} \|\mathcal{H}_{{\nabla}}\|_{\infty}(k_x,k_z):=\underset{\omega \in \mathbb{R}}{\text{sup}}\,\bar{\sigma}[\boldsymbol{\mathsf{H}}_{{\nabla}}(k_x,k_z,\omega)].\end{equation}
This quantity is the unstructured counterpart of  $\|\mathcal {H}_{{\nabla }}\|_{\mu }$, which is obtained by replacing the uncertainty set
 $\hat {\boldsymbol{\mathsf{U}}}_{\varXi }$ with the set of full complex matrices
 $\mathbb {C}^{3N_y\times 9N_y}$ (Packard & Doyle Reference Packard and Doyle1993; Zhou et al. Reference Zhou, Doyle and Glover1996). In other words, the definition does not specify a particular feedback pathway associated with each component of forcing, which leads to an unstructured feedback interconnection. We note that by definition
 $\|\mathcal {H}_{{\nabla }}\|_{\mu }(k_x,k_z)\leqslant \|\mathcal {H}_{{\nabla }}\|_{\infty }(k_x,k_z)$ (Packard & Doyle Reference Packard and Doyle1993, equation (3.4)). Comparisons between
 $\|\mathcal {H}_{{\nabla }}\|_{\mu }$ and
 $\|\mathcal {H}_{{\nabla }}\|_{\infty }$, therefore, highlight the effect of the structured uncertainty. The values
 $\|\mathcal {H}\|_{\infty }$ in (3.1) and
 $\|\mathcal {H}_{{\nabla }}\|_\infty$ in (3.2) are computed using the hinfnorm command in the Robust Control Toolbox (Balas et al. Reference Balas, Chiang, Packard and Safonov2005) of MATLAB.
In the next subsection we analyse plane Couette flow at  $Re=358$. This is followed by a study of plane Poiseuille flow at
 $Re=690$ in § 3.2. These Reynolds numbers are within the ranges of
 $Re\in [340,393]$ and
 $Re\in [660,720]$, where oblique turbulent bands are respectively observed in plane Couette flow (Prigent et al. Reference Prigent, Grégoire, Chaté and Dauchot2003) and plane Poiseuille flow (Kanazawa Reference Kanazawa2018). These particular values were selected because there are data from previous studies (Prigent et al. Reference Prigent, Grégoire, Chaté and Dauchot2003; Kanazawa Reference Kanazawa2018) available for comparison. This § 3.3 ends with a discussion of the role of the componentwise structure of the feedback interconnection in structured input–output analysis.
3.1. Plane Couette flow at  $Re=358$

In this subsection, we use the proposed approach to analyse the perturbations that are most likely to trigger transition in plane Couette flow at  $Re=358$ using the
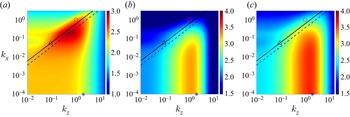
 $\|\mathcal {H}_{{\nabla }}\|_{\mu }$ formulation described in the previous section. Figure 4(a) shows this quantity alongside results obtained using input–output analysis describing the most amplified flow structures in terms of
 $\|\mathcal {H}\|_{\infty }$ in figure 4(b) and
 $\|\mathcal {H}_{{\nabla }}\|_{\infty }$ in (3.2) in figure 4(c). In all panels, we indicate the structures with
 $k_x\approx 0$ and
 $k_z=2$ representing streamwise vortices using blue stars and indicate
 $k_x=1$ and
 $k_z=1$ representing the oblique waves that were observed as the structures requiring the least energy to trigger transition in the DNS of Reddy et al. (Reference Reddy, Schmid, Baggett and Henningson1998) using red circles. In general, the wavenumber pair
 $k_x\approx 0$ and
 $k_z=2$ marked by blue stars represents streamwise elongated flow structures that include both streamwise vortices and streamwise streaks. However, we refer to (
 $k_x\approx 0,k_z=2$) as streamwise vortices when comparing with the results in Reddy et al. (Reference Reddy, Schmid, Baggett and Henningson1998) because that work explicitly introduced streamwise vortices associated with this wavenumber pair. Figure 4 shows clear differences in the dominant structures identified using the structured input–output approach. The largest magnitudes of
 $\|\mathcal {H}_{{\nabla }}\|_{\mu }$ in figure 4(a) are associated with oblique waves with
 $k_x\in [10^{-2},1]$ and
 $k_z\in [10^{-1},1]$, while the streamwise elongated structures that are dominant in figure 4(b,c) have a lesser but still large magnitude. This result is consistent with findings of Reddy et al. (Reference Reddy, Schmid, Baggett and Henningson1998, figure 23) showing that oblique waves require less perturbation energy to trigger turbulence in plane Couette flow than streamwise vortices. A comparison of
 $\|\mathcal {H}_{{\nabla }}\|_{\infty }$ in figure 4(c) and
 $\|\mathcal {H}\|_{\infty }$ in figure 4(b) indicates that it is not the feedback interconnection that significantly changes the dominant flow structures but rather the imposition of the componentwise structure of the nonlinearity. In addition, we observe that the magnitude of
 $\|\mathcal {H}_{{\nabla }}\|_{\mu }$ in figure 4(a) is lower than that of
 $\|\mathcal {H}_{{\nabla }}\|_{\infty }$ in figure 4(c) for each
 $(k_x, k_z)$ pair, which is consistent with the fact that the unstructured gain
 $\|\mathcal {H}_{{\nabla }}\|_{\infty }$ provides an upper bound on the structured one,
 $\|\mathcal {H}_{{\nabla }}\|_{\mu }$ (Packard & Doyle Reference Packard and Doyle1993).
Contour plots of (a)  $\text {log}_{10}[\|\mathcal {H}_{{\nabla }}\|_{\mu }(k_x,k_z)]$, (b)
 $\text {log}_{10}[\|\mathcal {H}\|_{\infty }(k_x,k_z)]$ and (c)
 $\text {log}_{10}[\|\mathcal {H}_{{\nabla }}\|_{\infty }(k_x,k_z)]$ for plane Couette flow at
 $Re=358$. Here the blue star indicates streamwise vortices with
 $k_x\approx 0$,
 $k_z=2$; the red circle marks oblique waves with
 $k_x=k_z=1$ as studied by (Reddy et al. Reference Reddy, Schmid, Baggett and Henningson1998). The black triangle marks
 $\lambda _x=113$,
 $\lambda _z=69$ which are the observed wavelengths of the oblique turbulent band at
 $Re=358$ (Prigent et al. Reference Prigent, Grégoire, Chaté and Dauchot2003). The black solid line is
 $\lambda _z=\lambda _x\tan (32^\circ )$ representing a
 $32^\circ$ angle of the oblique turbulent band, and the blue dashed line represents
 $\lambda _z=\lambda _x\tan (20^\circ )$.

The difference between the results in figure 4 mirrors the differences between the optimal perturbation structures predicted by linear optimal perturbation and NLOP analyses. In particular, the structures predicted using  $\|\mathcal {H}_{{\nabla }}\|_\mu$ are streamwise localized oblique waves reminiscent of those obtained as NLOP of plane Couette flow (Monokrousos et al. Reference Monokrousos, Bottaro, Brandt, Di Vita and Henningson2011; Duguet et al. Reference Duguet, Brandt and Larsson2010a, Reference Duguet, Monokrousos, Brandt and Henningson2013; Rabin et al. Reference Rabin, Caulfield and Kerswell2012; Cherubini & De Palma Reference Cherubini and De Palma2013, Reference Cherubini and De Palma2015), whereas the results obtained using
 $\|\mathcal {H}\|_\infty$ in figure 4(b) indicate the dominance of the types of streamwise elongated flow structures predicted as linear optimal perturbations (Butler & Farrell Reference Butler and Farrell1992). Our results also reflect previous findings that the NLOP is wider in the spanwise direction than the linear optimal perturbation (Rabin et al. Reference Rabin, Caulfield and Kerswell2012, figure 11). The results in figure 4 therefore indicate that the proposed structured input–output framework provides closer agreement with both DNS- and NLOP-based predictions of perturbations to which the flow is most sensitive than traditional input–output methods focusing on the spatio-temporal frequency response
 $\mathcal {H}$ in (2.8). The inclusion of a feedback loop for
 $\|\mathcal {H}_{{\nabla }}\|_{\infty }$ in figure 4(c) does lead to small improvements in the width of the structures predicted, but it does not lead to identification of the dominance of the oblique waves. This behaviour suggests that the weakening of the amplification of the streamwise elongated structures is a direct result of the structure imposed in the feedback interconnection.
Oblique turbulent bands have also been observed to be prominent in the transitional regime of plane Couette flow with very large channel size (Prigent et al. Reference Prigent, Grégoire, Chaté and Dauchot2003; Duguet et al. Reference Duguet, Schlatter and Henningson2010b). Figure 4 indicates the wavelength pair  $\lambda _x=113$ and
 $\lambda _z=69$ (black triangle) associated with the oblique turbulent bands that are observed to have horizontal extents in the range
 $\lambda _x\in [107,118]$ and
 $\lambda _z\in [62,76]$ in very-large-channel studies of plane Couette flow at
 $Re=358$; see Prigent et al. (Reference Prigent, Grégoire, Chaté and Dauchot2003, figures 3(b) and 5). The characteristic inclination angle measured from the streamwise direction in the
 $x$–
 $z$ plane is
 $\theta :=\tan ^{-1}(\lambda _z/\lambda _x)=\tan ^{-1}(69/113)\approx 32^\circ$. This value is indicated by the black solid line,
 $\lambda _z=\lambda _x\tan (32^\circ )$, in figure 4 and falls within the mid-range of the angles
 $\theta \in [28^\circ ,35^\circ ]$ corresponding to the spread of the data in Prigent et al. (Reference Prigent, Grégoire, Chaté and Dauchot2003, figure 5). Other simulations employing a tilted domain to impose an angle constrained by periodic boundary conditions in the streamwise and spanwise directions indicate that the oblique turbulent bands can be maintained by an angle as low as
 $20^\circ$; see e.g. Duguet et al. (Reference Duguet, Schlatter and Henningson2010b, figure 6). In figure 4, we also plot the angle
 $20^\circ$ represented by the blue dashed line,
 $\lambda _z=\lambda _x\tan (20^\circ )$, which is shown to correspond to the centre of the peak region of
 $\|\mathcal {H}_{{\nabla }}\|_\mu$. The results in the literature indicate that oblique structures associated with a range of wavelengths and inclination angles may provide large amplification, which may be the reason for the large peak region of
 $\|\mathcal {H}_{{\nabla }}\|_{\mu }$ in figure 4(a). These results suggest that structured input–output analysis captures the angle of the oblique turbulent band in transitional plane Couette flow. While there is some footprint of these types of structures in all three panels, the ranges of characteristic wavelengths and angles are most clearly associated with the peak region of
 $\|\mathcal {H}_{{\nabla }}\|_{\mu }$ in figure 4(a), and the line representing the angle of the structures is quite consistent with the shape of the peak region. The fact that these structures become more prominent through this analysis suggests that these turbulent bands arise in transitional flows due to their large amplification (sensitivity to disturbances).
3.2. Plane Poiseuille flow at $Re=690$

In this subsection, we apply the proposed structured input–output analysis to investigate highly amplified flow structures in plane Poiseuille flow at  $Re=690$. Figure 5(a–c) compares
 $\|\mathcal {H}_{{{\nabla }}}\|_{\mu }$,
 $\|\mathcal {H}\|_{\infty }$ and
 $\|\mathcal {H}_{{\nabla }}\|_\infty$ for this flow configuration. In each panel, we also indicate the streamwise vortices with
 $k_x\approx 0$ and
 $k_z=2$ (blue star), oblique waves with
 $k_x=k_z=1$ (black circle) and TS waves with
 $k_x=1$ and
 $k_z\approx 0$ (magenta square) that were identified as transition-inducing perturbations in Reddy et al. (Reference Reddy, Schmid, Baggett and Henningson1998). Similar to the results for plane Couette flow in figure 4, the quantities
 $\|\mathcal {H}\|_{\infty }$ and
 $\|\mathcal {H}_{{\nabla }}\|_{\infty }$ show qualitatively similar behaviour; the highest values for both correspond to streamwise streaks and vortices. In figures 5(b) and 5(c), the TS wave structure appears as a local peak with a magnitude that is about an order of magnitude smaller than the values associated with the streamwise vortices in
 $\|\mathcal {H}_{{\nabla }}\|_\infty$ and
 $\|\mathcal {H}\|_\infty$. In these two panels, the values for the oblique waves are of a similar order of magnitude to that of the peak corresponding to the TS waves in
 $\|\mathcal {H}\|_\infty$ and slightly higher in
 $\|\mathcal {H}_{{\nabla }}\|_\infty$. These findings agree with previous analyses of
 $\|\mathcal {H}\|_\infty$ in Jovanović (Reference Jovanović2004) and Schmid (Reference Schmid2007). The similarity of the
 $\|\mathcal {H}_{{\nabla }}\|_\infty$ and
 $\|\mathcal {H}\|_\infty$ results indicates that an unstructured feedback interconnection does not lead to substantial changes in the most prominent structures.
Contour plots of (a)  $\text {log}_{10}[\|\mathcal {H}_{{\nabla }}\|_{\mu }(k_x,k_z)]$, (b)
 $\text {log}_{10}[\|\mathcal {H}\|_{\infty }(k_x,k_z)]$ and (c)
 $\text {log}_{10}[\|\mathcal {H}_{{\nabla }}\|_{\infty } (k_x,k_z)]$ for plane Poiseuille flow at
 $Re=690$. Here the blue star,
 $k_x\approx 0$,
 $k_z=2$, marks streamwise vortices; the black circle,
 $k_x=k_z=1$, marks oblique waves; the magenta square,
 $k_x=1$,
 $k_z\approx 0$, marks TS waves studied by Reddy et al. (Reference Reddy, Schmid, Baggett and Henningson1998). The black triangle,
 $\lambda _x=314$,
 $\lambda _z=248$, indicates the wavelengths of the oblique turbulent band at
 $Re=690$ observed in Kanazawa (Reference Kanazawa2018).

The overall shape of  $\|\mathcal {H}_{{\nabla }}\|_\mu$ is somewhat different from that of either
 $\|\mathcal {H}\|_\infty$ or
 $\|\mathcal {H}_{{\nabla }}\|_\infty$. The streamwise elongated structures that are dominant in figure 5(b,c) have a lesser but still large magnitude, while the peak value corresponds to oblique waves. The TS wave corresponds to a local peak in
 $\|\mathcal {H}_{{\nabla }}\|_{\mu }$, but the magnitudes are smaller than the peak values associated with oblique waves. This result is consistent with findings of Reddy et al. (Reference Reddy, Schmid, Baggett and Henningson1998, figure 19) showing that oblique waves require slightly less perturbation energy to trigger turbulence in plane Poiseuille flow than streamwise vortices. Both the peak region and the large region of very high values in the bottom left quadrant of figure 5(a) are consistent with the short-time-scale NLOP of plane Poiseuille flow, which was shown to be spatially localized with streamwise wavelength larger than spanwise wavelength (Farano et al. Reference Farano, Cherubini, Robinet and De Palma2015). These results indicate that the inclusion of structured uncertainty uncovers a broader range of transition-inducing structures and correctly orders their relative amplification in the sense of their transition-inducing potential.
There is evidence that the oblique turbulent bands that are observed in very-large-channel studies also play a role in transition. Their ability to trigger transition has been exploited in a number of studies that employ flow fields with sustained oblique turbulent bands at a relatively high  $Re$ as the initial conditions to trigger the banded turbulent–laminar patterns associated with transitioning flows at a Reynolds number of interest (e.g. Tsukahara et al. Reference Tsukahara, Seki, Kawamura and Tochio2005; Tuckerman et al. Reference Tuckerman, Kreilos, Schrobsdorff, Schneider and Gibson2014; Tao et al. Reference Tao, Eckhardt and Xiong2018; Xiao & Song Reference Xiao and Song2020). The characteristic wavelength pair (
 $\lambda _x=314$,
 $\lambda _z=248$) associated with this structure in plane Poiseuille flow at
 $Re=690$ (estimated from Kanazawa (Reference Kanazawa2018, figure 5.1b)) is indicated in each panel of figure 5 using a black triangle. These characteristic wavelengths are located within the range of large values of
 $\|\mathcal {H}_{{\nabla }}\|_\mu$. They are not associated with peak regions of
 $\|\mathcal {H}\|_\infty$ or
 $\|\mathcal {H}_{{\nabla }}\|_\infty$ in figures 5(b) or 5(c), although a footprint of these flow structures is visible in both. Figure 5(a) indicates that the flow structure associated with the oblique turbulent band has a similar amplification under structured forcing to that of streamwise elongated structures, although both of their magnitudes are smaller than that associated with the oblique waves. Further analysis of these structures and their role in transition is a topic of ongoing work.
3.3. Componentwise structure of nonlinearity: weakening of the lift-up mechanism
The results in the previous subsections, particularly the differences between  $\|\mathcal {H}_{{\nabla }}\|_\mu$ and
 $\|\mathcal {H}_{{\nabla }}\|_\infty$ in figures 4 and 5, highlight the role of the feedback interconnection structure in the identification of the perturbations to which the flow is most sensitive. In particular, the imposition of the componentwise structure leads to lesser prominence of streamwise elongated structures
 $(k_x\approx 0, k_z=2)$ in
 $\|\mathcal {H}_{{\nabla }}\|_{\mu }$ compared with
 $\|\mathcal {H}\|_{\infty }$ or
 $\|\mathcal {H}_{\boldsymbol {\nabla }}\|_{\infty }$ in both plane Couette flow and Poiseuille flow (see figures 4 and 5).
The mechanisms underlying the differences in  $\|\mathcal {H}_{{\nabla }}\|_{\mu }$ and
 $\|\mathcal {H}_{{\nabla }}\|_{\infty }$ can be analysed by isolating the effect of forcing in each component of the momentum equation, i.e.
 $f_x$,
 $f_y$,
 $f_z$ in (2.2), on the amplification of each velocity component
 $u$,
 $v$,
 $w$. These nine quantities are associated with
 $\|\mathcal {H}_{ij}\|_{\infty }$, where the spatio-temporal frequency response operator
 $\mathcal {H}_{ij}$ from each forcing component (
 $j=x,y,z$) to each velocity component (
 $i=u,v,w$) is given by (Jovanović & Bamieh Reference Jovanović and Bamieh2005)
 \begin{equation}
\mathcal{H}_{ij}=\hat{\mathcal{C}}_{i}(\text{i}\omega \mathcal{I}_{2\times 2}-\hat{\mathcal{A}})^{{-}1}\hat{\mathcal{B}}_{j}\end{equation}
with
 $$\begin{gather} \hat{\mathcal{B}}_x:=\hat{\mathcal{B}}\left[ \mathcal{I} \quad 0 \quad 0 \right]^{\text{T}}, \quad \hat{\mathcal{B}}_y:=\hat{\mathcal{B}}\left[ 0 \quad \mathcal{I} \quad 0 \right]^{\text{T}},\quad \hat{\mathcal{B}}_z:=\hat{\mathcal{B}}\left[ 0 \quad 0 \quad \mathcal{I} \right]^{\text{T}}, \end{gather}$$
 $$\begin{gather}\hat{\mathcal{C}}_u:=\left[\mathcal{I} \quad 0 \quad 0 \right]\hat{\mathcal{C}} ,\quad \hat{\mathcal{C}}_v:=\left[0 \quad \mathcal{I} \quad 0 \right]\hat{\mathcal{C}},\quad \hat{\mathcal{C}}_w:=\left[0 \quad 0\quad \mathcal{I} \right]\hat{\mathcal{C}}. \end{gather}$$
These quantities were analysed in Jovanović (Reference Jovanović2004) and Schmid (Reference Schmid2007). Those results indicate that the most significant amplification is seen when forcing is applied in the cross-stream and the output is the streamwise velocity component, i.e. that associated with respective frequency response operators  $\mathcal {H}_{uy}$,
 $\mathcal {H}_{uz}$ and input–output pathway
 $f_y\rightarrow u$,
 $f_z\rightarrow u$. Similar behaviour occurs if we isolate
 $\mathcal {H}_{{\nabla }}$ by examining each input–output response pathway:
 \begin{equation} \mathcal{H}_{{\nabla} ij}:=\hat{\boldsymbol{\nabla}}\mathcal{H}_{ij}. \end{equation}
In that prior work, the input forcing (applied either directly to the LNS (top block in figure 1) or through a feedback interconnection) was unstructured in the sense that there was no restriction in terms of the permissible input–output pathways. The behaviour of the largest  $\|\mathcal {H}_{ij}\|_\infty$ (
 $\|\mathcal {H}_{{\nabla } {ij}}\|_\infty$) response therefore dominates the overall
 $\|\mathcal {H}\|_\infty$ (
 $\|\mathcal {H}_{{\nabla }}\|_\infty$) response.
The structured input–output analysis framework introduced here instead imposes a correlation between each component of the modelled forcing  $f_{x,\xi }$,
 $f_{y,\xi }$ and
 $f_{z,\xi }$ and the respective velocity components
 $u$,
 $v$ and
 $w$ by constraining the feedback interconnection to retain the componentwise structure of our input–output model of the forcing. This model of the forcing in terms of componentwise input–output relationships from
 $\boldsymbol {\nabla } u$,
 $\boldsymbol {\nabla } v$ and
 $\boldsymbol {\nabla } w$ to the respective components
 $f_{x,\xi }=-\boldsymbol {u}_{\xi }\boldsymbol {\cdot } \boldsymbol {\nabla } u$,
 $f_{y,\xi }=-\boldsymbol {u}_{\xi }\boldsymbol {\cdot } \boldsymbol {\nabla } v$ and
 $f_{z,\xi }=-\boldsymbol {u}_{\xi }\boldsymbol {\cdot } \boldsymbol {\nabla } w$ with the gain defined in terms of
 $-\boldsymbol {u}_{\xi }$ constrains the feedback relationships such that each component of the forcing is most strongly influenced by that component of the velocity field and velocity gradient. These constraints on the permissible feedback pathways within our model of the nonlinear interactions limit the influence of the input–output pathways
 $f_y\rightarrow u$ and
 $f_z\rightarrow u$. The structured input–output response
 $\|\mathcal {H}_{{\nabla }}\|_\mu$ is instead associated with input–output pathways
 $f_x\rightarrow u$,
 $f_y\rightarrow v$ and
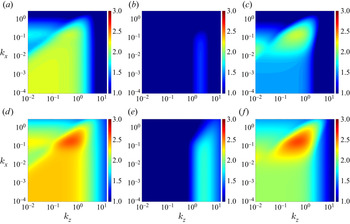
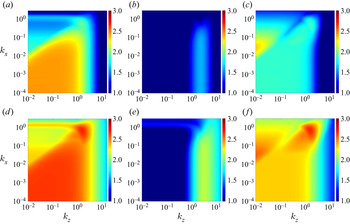
 $f_z\rightarrow w$ as illustrated in figures 6 and 7, which plot
 $\|\mathcal {H}_{ux}\|_{\infty }$,
 $\|\mathcal {H}_{vy}\|_{\infty }$,
 $\|\mathcal {H}_{wz}\|_{\infty }$,
 $\|\mathcal {H}_{{\nabla } ux}\|_{\infty }$,
 $\|\mathcal {H}_{ {\nabla } vy}\|_{\infty }$ and
 $\|\mathcal {H}_{{\nabla } wz}\|_{\infty }$ for the plane Couette and Poiseuille cases respectively discussed in §§ 3.1 and 3.2. Here, we can see that the results of structured input–output analysis
 $\|\mathcal {H}_{{\nabla }}\|_{\mu }$ for both of these flows in figures 4(a) and 5(a) resemble the combined effect of this limited set of input–output pathways. Moreover, the quantity
 $\|\mathcal {H}_{{\nabla }}\|_{\mu }$ at each wavenumber pair
 $(k_x,k_z)$ is lower bounded by
 $\|\mathcal {H}_{{\nabla } ux}\|_{\infty }$,
 $\|\mathcal {H}_{{\nabla } vy}\|_{\infty }$ and
 $\|\mathcal {H}_{{\nabla } wz}\|_{\infty }$ as described in theorem 3.1, whose proof is provided in Appendix A.1. The relationship in theorem 3.1 is evident when comparing results in figures 4(a) and 6(d–f) for plane Couette flow and comparing results in figures 5(a) and 7(d–f) for plane Poiseuille flow.
Theorem 3.1 Given wavenumber pair  $(k_x,k_z)$,
 \begin{equation} \|\mathcal{H}_{{\nabla}}\|_{\mu}\geqslant \text{max}[\|\mathcal{H}_{{\nabla} ux}\|_{\infty},\|\mathcal{H}_{{\nabla} vy}\|_{\infty}, \|\mathcal{H}_{{\nabla} wz}\|_{\infty}]. \end{equation}
Contour plots of (a)  $\text {log}_{10}[\|\mathcal {H}_{ux}\|_{\infty }(k_x,k_z)]$, (b)
 $\text {log}_{10}[\|\mathcal {H}_{vy}\|_{\infty }(k_x,k_z)]$, (c)
 $\text {log}_{10}[\|\mathcal {H}_{wz}\|_{\infty } (k_x,k_z)]$, (d)
 $\text {log}_{10}[\|\mathcal {H}_{{\nabla } {ux}}\|_{\infty }(k_x,k_z)]$, (e)
 $\text {log}_{10}[\|\mathcal {H}_{{\nabla } {vy}}\|_{\infty }(k_x,k_z)]$ and (f)
 $\text {log}_{10}[\|\mathcal {H}_{{\nabla } {wz}}\|_{\infty }(k_x,k_z)]$ for plane Couette flow at
 $Re=358$.

Contour plots of (a)  $\text {log}_{10}[\|\mathcal {H}_{ux}\|_{\infty }(k_x,k_z)]$, (b)
 $\text {log}_{10}[\|\mathcal {H}_{vy}\|_{\infty }(k_x,k_z)]$, (c)
 $\text {log}_{10}[\|\mathcal {H}_{wz}\|_{\infty } (k_x,k_z)]$, (d)
 $\text {log}_{10}[\|\mathcal {H}_{{\nabla } {ux}}\|_{\infty }(k_x,k_z)]$, (e)
 $\text {log}_{10}[\|\mathcal {H}_{{\nabla } {vy}}\|_{\infty }(k_x,k_z)]$ and (f)
 $\text {log}_{10}[\|\mathcal {H}_{{\nabla } {wz}}\|_{\infty }(k_x,k_z)]$ for plane Poiseuille flow at
 $Re=690$.

The input–output pathways that dominate the overall unstructured response  $\|\mathcal {H}\|_{\infty }$ (
 $\|\mathcal {H}_{uy}\|_{\infty }$ and
 $\|\mathcal {H}_{uz}\|_{\infty }$) emphasize amplification of streamwise streaks by cross-stream forcing, i.e. the lift-up mechanism (see e.g. the discussion in Jovanović (Reference Jovanović2021) for further details). The lift-up mechanism therefore appears to be weakened through the imposition of the componentwise structure of the nonlinearity, which is consistent with results suggesting that nonlinear mechanisms disadvantage the growth of streaks (e.g. Duguet et al. Reference Duguet, Monokrousos, Brandt and Henningson2013; Brandt Reference Brandt2014). These results suggest that the preservation of the componentwise structure of nonlinearity within the proposed approach enables the method to capture important nonlinear effects, leading to better agreement with DNS and experimental studies and nonlinear analysis of the perturbations that require less energy to initiate transition, e.g. NLOP.
4. Reynolds number dependence
In this section, we aggregate results across a range of  $(k_x,k_z)$ scales to study the Reynolds number dependence and the associated scaling law of
 $\|\mathcal {H}_{{\nabla }}\|_{\mu }$ for both plane Couette flow and plane Poiseuille flow. In particular, we compute
 \begin{equation} \|\mathcal{H}_{{\nabla}}\|_{\mu}^M:=\underset{k_z,\,k_x}{\text{max}}\|\mathcal{H}_{{\nabla}}\|_{\mu}(k_x,k_z), \end{equation}
where  ${\max}_{{k_z,\,k_x}}$ corresponds to the maximum value over the wavenumber pairs
 $(k_x,k_z)$ in the computational range of
 $k_x \in [10^{-4},10^{0.48}]$ and
 $k_z \in [10^{-2},10^{1.2}]$.
In order to compare our results with the scaling relationships of  $\|\mathcal {H}\|_{\infty }$ previously described in the literature and to isolate the effect of the structure in the feedback loop, we analogously define
 $$\begin{gather} \|\mathcal{H}\|_{\infty}^M:=\underset{\substack{k_z,\,k_x}}{\text{max}}\,\|\mathcal{H}\|_{\infty}(k_x,k_z), \end{gather}$$
 $$\begin{gather}\|\mathcal{H}_{{\nabla}}\|_{\infty}^M:=\underset{\substack{k_z,\,k_x}}{\text{max}}\,\|\mathcal{H}_{{\nabla}}\|_{\infty}(k_x,k_z). \end{gather}$$
The scaling of quantities related to  $\|\mathcal {H}\|_{\infty }$ and
 $\|\mathcal {H}\|_{\infty }^M$ with different input–output pathways, i.e. different
 $\hat {\mathcal {B}}$ and
 $\hat {\mathcal {C}}$ matrices in (3.4), has been widely studied. For example, Trefethen et al. (Reference Trefethen, Trefethen, Reddy and Driscoll1993, table 1) showed that
 ${\text {sup}}_{\omega \in \mathbb {R}}\|(\text {i}\omega \mathcal {I}-\hat {\mathcal {A}})^{-1}\|\sim Re^2$ for plane Couette flow and plane Poiseuille flow are respectively associated with wavenumber pairs
 $(k_x,k_z)=(0,1.18)$ and
 $(k_x,k_z)=(0,1.62)$. Here, the operator norm
 $\|\cdot \|$ is defined such that
 ${\text {sup}}_{{\omega \in \mathbb {R}}}\|\cdot \|$ is equivalent to the definition of
 $\|\cdot \|_{\infty }$ employed in (3.1). Kreiss et al. (Reference Kreiss, Lundbladh and Henningson1994) showed that the related quantity maximized over a range of
 $(k_x,k_z)$, i.e.
 \begin{equation} \underset{\mathbb{R}e[s]\geqslant0}{\text{max}}\|(s\mathcal{I}-\hat{\mathcal{A}})^{{-}1}\|\sim Re^2 \end{equation}
for plane Couette flow, where  $\mathbb {R}e[s]$ denotes the real part of the Laplace variable
 $s$. Jovanović (Reference Jovanović2004, theorem 11) analytically derived the same
 $\sim Re^2$ scaling for the special case of
 $\|\mathcal {H}\|_\infty$ restricted to
 $k_x=0$ for both plane Couette and Poiseuille flows.
Figure 8 plots the quantities in (4.1)–(4.2) as a function of Reynolds number  $(Re\in [300,4000])$ for plane Couette flow and plane Poiseuille flow. The upper bound of
 $Re=4000$ was selected to remain below the known linear stability limit for plane Poiseuille flow of
 $Re\simeq 5772$ (Orszag Reference Orszag1971). As expected, all of these quantities increase with Reynolds number and the values of
 $\|\mathcal {H}_{{\nabla }}\|_{\infty }^M$ are larger than those of
 $\|\mathcal {H}_{{\nabla }}\|_{\mu }^M$. We obtain a Reynolds number scaling of each quantity by fitting the lines in figure 8 to
 $c_0Re^{\eta }$, where
 $c_0$ is a constant scalar and
 $\eta$ is the corresponding scaling exponent. The results show that
 $\|\mathcal {H}\|_{\infty }^M$ and
 $\|\mathcal {H}_{{\nabla }}\|_{\infty }^M$ scale as
 $\sim Re^2$ in the range
 $Re\in [300,4000]$ for both plane Couette and plane Poiseuille flows. This scaling is consistent with the results in Trefethen et al. (Reference Trefethen, Trefethen, Reddy and Driscoll1993) for the frequency response operator with identity operators for
 $\hat {\mathcal {C}}$ and
 $\hat {\mathcal {B}}$ as well as the related quantity in Kreiss et al. (Reference Kreiss, Lundbladh and Henningson1994). The fact that the scaling of this quantity for the modified frequency response operator
 $\mathcal {H}_{{\nabla }}$ is the same as that of
 $\mathcal {H}$ suggests that adding an unstructured uncertainty in the feedback loop to represent the nonlinear interactions does not change the Reynolds number scaling.
The Reynolds number dependence of  $\|\mathcal {H}_{{\nabla }}\|_{\mu }^M$ (black triangle);
 $\|\mathcal {H}\|_{\infty }^M$ (red circle);
 $\|\mathcal {H}_{{\nabla }}\|_{\infty }^M$ (blue star);
 $\|\mathcal {H}_{{\nabla }}\|_{\mu }(1,1)$ (black square). (a) Plane Couette flow with red crosses marking
 $\|\mathcal {H}_{{\nabla }}\|_{\mu }(0.19,0.58)$ and (b) plane Poiseuille flow with red crosses marking
 $\|\mathcal {H}_{{\nabla }}\|_{\mu }(0.69,1.56)$.

The quantity  $\|\mathcal {H}_{{\nabla }}\|_{\mu }^M$ in figure 8 instead shows scalings of
 $\sim Re^{1.1}$ over
 $Re\in [300,4000]$ for plane Couette flow and
 $\sim Re^{1.5}$ for plane Poiseuille flow in the range
 $Re\in [500,4000]$. The difference between the scaling of
 $\|\mathcal {H}_{{\nabla }}\|_{\mu }^M$ and the
 $\sim Re^2$ scaling associated with either
 $\|\mathcal {H}\|_{\infty }^M$ or
 $\|\mathcal {H}_{{\nabla }}\|_{\infty }^M$ again arises through the imposition of the componentwise structure of nonlinearity. As discussed in § 3.3, the reduced scaling is related to the smaller amplification in the input–output pathways
 $f_x\rightarrow u$,
 $f_y\rightarrow v$ and
 $f_z\rightarrow w$ and associated
 $f_x\rightarrow \boldsymbol {\nabla } u$,
 $f_y\rightarrow \boldsymbol {\nabla } v$ and
 $f_z\rightarrow \boldsymbol {\nabla } w$. The scaling for these input–output pathways can be evaluated directly through
 \begin{equation} \|\mathcal{H}_{{\nabla} ij}\|_{\infty}^{M}:=\underset{k_z,\,k_x}{\text{max}}\|\mathcal{H}_{{\nabla} ij}\|_{\infty}(k_x,k_z). \end{equation}
These quantities are plotted in figure 9 alongside  $\|\mathcal {H}_{{\nabla }}\|_{\mu }^M$. Performing a similar fit we find that both
 $\|\mathcal {H}_{{\nabla } ux}\|_{\infty }^M$ and
 $\|\mathcal {H}_{{\nabla } wz}\|_{\infty }^M$ scale as
 $\sim Re^{1.1}$ for plane Couette flow and
 $\sim Re^{1.5}$ for plane Poiseuille flow, which matches the scaling of
 $\|\mathcal {H}_{{\nabla }}\|_{\mu }^M$. On the other hand,
 $\|\mathcal {H}_{{\nabla } vy}\|_{\infty }^M$ is much smaller than these three quantities and scales as
 $\|\mathcal {H}_{{\nabla } vy}\|_{\infty }^M\sim Re$ for both plane Couette and Poiseuille flows.
The Reynolds number dependence of  $\|\mathcal {H}_{{\nabla }}\|_{\mu }^M$ (black triangle);
 $\|\mathcal {H}_{{\nabla } ux}\|_{\infty }^M$ (blue star);
 $\|\mathcal {H}_{{\nabla } vy}\|_{\infty }^M$ (magenta square);
 $\|\mathcal {H}_{{\nabla } wz}\|_{\infty }^M$ (red circle). (a) Plane Couette flow and (b) plane Poiseuille flow.

In order to understand the role of the oblique waves in this scaling, we also plot the quantity  $\|\mathcal {H}_{{\nabla }}\|_{\mu }(1,1)$ corresponding to the wavenumber pair associated with the oblique waves discussed in §§ 3.1 and 3.2 in figure 8. In both flows, these values are lower than and not exactly parallel with
 $\|\mathcal {H}_{{\nabla }}\|_{\mu }^M$, indicating that they are not associated with the peak amplification of
 $\|\mathcal {H}_{{\nabla }}\|_{\mu }$ in figures 4(a) and 5(a). However, they do seem to provide the majority of the contribution to
 $\|\mathcal {H}_{{\nabla }}\|_{\mu }^M$. This observation is consistent with figures 4(a) and 5(a), where
 $(k_x,k_z)=(1,1)$ is close to but different from the
 $(k_x^M,k_z^M)$ wavenumber pair that reaches the maximum value of
 $\|\mathcal {H}_{{\nabla }}\|_{\mu }(k_x,k_z)$ defined as
 \begin{equation} (k_x^M, k_z^M):=\underset{k_x,k_z}{\text{arg max }}\|\mathcal{H}_{{\nabla}}\|_{\mu}(k_x,k_z). \end{equation}
These wavenumber pairs are  $(k_x^M,k_z^M)=(0.19, 0.58)$ for plane Couette flow at
 $Re=358$ and
 $(k_x^M, k_z^M)=(0.69,1.56)$ for plane Poiseuille flow at
 $Re=690$. We also plot the Reynolds number dependence of
 $\|\mathcal {H}_{{\nabla }}\|_{\mu }(0.19,0.58)\sim Re$ for plane Couette flow and
 $\|\mathcal {H}_{{\nabla }}\|_{\mu }(0.69,1.56)\sim Re^{1.3}$ for plane Poiseuille flow as red cross markers in figure 8. Here, we observe that they overlap with
 $\|\mathcal {H}_{{\nabla }}\|_{\mu }^M$ at low Reynolds numbers, but deviate as the Reynolds number increases leading to a reduced
 $Re$ scaling compared with
 $\|\mathcal {H}_{{\nabla }}\|_{\mu }^M$. These results show that these oblique flow structures continue to show very high (close to the maximum overall amplification value) throughout the Reynolds number range. However, the wavenumber pair
 $(k_x^M, k_z^M)$ that reaches the maximum value over
 $\|\mathcal {H}_{{\nabla }}\|_{\mu }(k_x,k_z)$ depends on the Reynolds number.
The observed importance and analytical tractability of streamwise elongated structures have motivated previous analysis of the streamwise constant  $(k_x=0)$ component of the frequency response operator. In order to compare our analysis with these results, we also evaluate this behaviour by computing analogous quantities
 $$\begin{gather} \|\mathcal{H}_{{\nabla} }\|_{\mu}^{sc}:=\underset{k_z,\,k_x=10^{{-}4}}{\text{max}}\|\mathcal{H}_{{\nabla}}\|_{\mu}(k_x,k_z), \end{gather}$$
 $$\begin{gather}\|\mathcal{H}_{{\nabla} ij}\|_{\infty}^{sc}:=\underset{k_z,\,k_x=10^{{-}4}}{\text{max}}\|\mathcal{H}_{{\nabla} ij}\|_{\infty}(k_x,k_z), \end{gather}$$
which restricts the streamwise wavenumber to  $k_x=10^{-4}$ to approximate the streamwise constant modes. In figure 10, we replot
 $\|\mathcal {H}_{{\nabla } }\|_{\mu }^{M}$ alongside
 $\|\mathcal {H}_{{\nabla } }\|_{\mu }^{sc}$ (black triangle, dashed line), and observe that
 $\|\mathcal {H}_{{\nabla } }\|_{\mu }^{sc}\sim Re$ for both plane Couette and Poiseuille flows. Figure 10 also shows
 $\|\mathcal {H}_{{\nabla } ux}\|_{\infty }^{sc}$,
 $\|\mathcal {H}_{{\nabla } vy}\|_{\infty }^{sc}$ and
 $\|\mathcal {H}_{{\nabla } wz}\|_{\infty }^{sc}$. Here, we find that
 $\|\mathcal {H}_{{\nabla } }\|_{\mu }^{sc}$ overlaps with
 $\|\mathcal {H}_{{\nabla } ux}\|_{\infty }^{sc}$ and thus shows the same scaling
 $\sim Re$. These three input–output pathways
 $\|\mathcal {H}_{{\nabla } ij}\|_{\infty }^{sc}$ (
 $ij=ux,vy,wz$) scale as
 $\sim Re$ for both plane Couette and Poiseuille flows. This behaviour is consistent with the results in Jovanović (Reference Jovanović2004, theorem 11), which showed that
 $\|\mathcal {H}_{ij}\|_{\infty }\sim Re$ (
 $ij=ux,vy,wz$) when it is restricted to
 $k_x=0$ for both plane Couette and plane Poiseuille flows. The following theorem provides an analogous analytical
 $Re$ scaling for
 $\|\mathcal {H}_{{\nabla } ij}\|_{\infty }$ at
 $k_x=0$, i.e. the streamwise constant component.
Theorem 4.1 Given streamwise constant ( $k_x=0$) plane Couette flow or plane Poiseuille flow, each component of
 $\|\mathcal {H}_{{\nabla } ij}\|_{\infty }$ (
 $i=u,v,w$ and
 $j=x,y,z$) scales as
 \begin{align} \begin{bmatrix}
\|\mathcal{H}_{{\nabla} ux}\|_{\infty} &
\|\mathcal{H}_{{\nabla} uy}\|_{\infty} &
\|\mathcal{H}_{{\nabla} uz}\|_{\infty} \\
\|\mathcal{H}_{{\nabla} vx}\|_{\infty} &
\|\mathcal{H}_{{\nabla} vy}\|_{\infty} &
\|\mathcal{H}_{{\nabla} vz}\|_{\infty}\\
\|\mathcal{H}_{{\nabla} wx}\|_{\infty} &
\|\mathcal{H}_{{\nabla} wy}\|_{\infty} &
\|\mathcal{H}_{{\nabla} wz}\|_{\infty}\end{bmatrix} =\begin{bmatrix} Re\, h_{{\nabla}
ux}(k_z) & Re^2\, h_{{\nabla} uy}(k_z) & Re^2\, h_{{\nabla}
uz}(k_z) \\ 0 & Re\,h_{{\nabla} vy}(k_z) & Re\,h_{{\nabla}
vz}( k_z) \\ 0 & Re\, h_{{\nabla} wy}(k_z) & Re
\,h_{{\nabla} wz}(k_z) \end{bmatrix},
\end{align}
where functions  $h_{{\nabla } ij}(k_z)$ are independent of
 $Re$.
The Reynolds number dependence of  $\|\mathcal {H}_{{\nabla }}\|_{\mu }^M$ (black triangle, solid line);
 $\|\mathcal {H}_{{\nabla }}\|_{\mu }^{sc}$ (balck triangle, dashed line);
 $\|\mathcal {H}_{{\nabla } ux}\|_{\infty }^{sc}$ (blue star);
 $\|\mathcal {H}_{{\nabla } vy}\|_{\infty }^{sc}$ (magenta square);
 $\|\mathcal {H}_{{\nabla } wz}\|_{\infty }^{sc}$ (red circle). (a) Plane Couette flow and (b) plane Poiseuille flow.

The proof of theorem 4.1 in Appendix A.2 follows the procedure in Jovanović (Reference Jovanović2004), Jovanović & Bamieh (Reference Jovanović and Bamieh2005) and Jovanović (Reference Jovanović2021), which involves the change of variable  $\varOmega :=\omega Re$. Comparing scaling of this
 $\|\mathcal {H}_{{\nabla } ij}\|_{\infty }$ in theorem 4.1 with that of
 $\|\mathcal {H}_{ij}\|_{\infty }$ at
 $k_x=0$ in Jovanović (Reference Jovanović2004, theorem 11) shows that the modification of the operator to provide the output
 $\hat {\boldsymbol {\nabla }}\hat {u}$,
 $\hat {\boldsymbol {\nabla }}\hat {v}$ and
 $\hat {\boldsymbol {\nabla }}\hat {w}$ does not modify the Reynolds number scaling, which is expected since this operation amounts to a Reynolds-number-independent transformation of the system output.
Combining results in theorems 3.1 and 4.1, we have the following corollary 4.2 providing an analytical lower bound on  $\|\mathcal {H}_{{\nabla }}\|_{\mu }$ at
 $k_x=0$.
Corollary 4.2 Given streamwise constant ( $k_x=0$) plane Couette flow or plane Poiseuille flow,
 \begin{equation} \|\mathcal{H}_{{\nabla}}\|_{\mu}(0,k_z)\geqslant \text{max}[Re\, h_{{\nabla} ux }(k_z), Re\, h_{{\nabla} vy }(k_z),Re\, h_{{\nabla} wz }(k_z)], \end{equation}
where functions  $h_{{\nabla } ij}(k_z)$ with
 $ij=ux,vy,wz$ are independent of
 $Re$.
The previous numerical observations of  $\|\mathcal {H}_{{\nabla }}\|_\mu ^{sc}\sim Re$ in figure 10 for both plane Couette and plane Poiseuille flows are consistent with corollary 4.2. The reduced scaling exponent
 $\eta$ of the largest structured gain
 $\|\mathcal {H}_{{\nabla }}\|_{\mu }^M\sim Re^\eta$ observed here compared with
 ${\eta =2}$ for unstructured gain (Trefethen et al. Reference Trefethen, Trefethen, Reddy and Driscoll1993; Kreiss et al. Reference Kreiss, Lundbladh and Henningson1994; Jovanović Reference Jovanović2004) further highlights the importance of the componentwise structure of nonlinearity imposed in this framework, this structure is what appears to weaken the large amplification associated with the lift-up mechanism.
5. Conclusions and future work
This work proposes a structured input–output analysis that augments traditional analysis of the spatio-temporal frequency response of the LNS with structured uncertainty. The structure preserves the componentwise input–output structure of the nonlinearity in the NS equations. We then analyse the spatio-temporal response of the resulting feedback interconnection between the LNS equations and the structured forcing in terms of the structured singular value of the associated spatio-temporal frequency response operator.
We apply structured input–output analysis to transitional plane Couette and plane Poiseuille flows. Comparisons of the results with those of traditional analysis and an unstructured feedback interconnection indicate that the addition of a structured feedback interconnection enables a wider range of known dominant flow structures to be identified without the computational burden of nonlinear optimization or extensive simulations. More specifically, the results for transitional plane Couette flow reproduce the findings from DNS (Reddy et al. Reference Reddy, Schmid, Baggett and Henningson1998) and NLOP analysis (Rabin et al. Reference Rabin, Caulfield and Kerswell2012) in showing that oblique waves require less energy to induce transition than the streamwise elongated structures emphasized in traditional input–output analysis. In plane Poiseuille flow the results again predict the oblique wave structure as in DNS (Reddy et al. Reference Reddy, Schmid, Baggett and Henningson1998). They also highlight the importance of spatially localized structures with a streamwise wavelength larger than spanwise similar to the NLOP (Farano et al. Reference Farano, Cherubini, Robinet and De Palma2015). The framework also reproduces the oblique turbulent bands (Prigent et al. Reference Prigent, Grégoire, Chaté and Dauchot2003; Kanazawa Reference Kanazawa2018) that have been associated with transitioning flows with very large channel sizes ( ${\sim }O(100)$ times the channel half-height) in both experiments and DNS.
The agreement between the predictions from structured input–output analysis and observation in experiments, DNS and NLOP computations indicates that the structured feedback interconnection reproduces important nonlinear effects. Our analysis suggests that restricting the feedback pathways preserves the structure of the nonlinear mechanisms that weaken the streaks developed through the lift-up effect, in which cross-stream forcing amplifies streamwise streaks (Ellingsen & Palm Reference Ellingsen and Palm1975; Landahl Reference Landahl1975; Brandt Reference Brandt2014). The Reynolds number dependence observed in our studies further supports the notion that imposing a structured feedback interconnection based on certain input–output properties associated with the nonlinearity in the NS equations leads to a weakening of the amplification of streamwise elongated structures.
The results here suggest the promise of this computationally tractable approach and open up many directions for future work. Further refinement of the structured uncertainty may provide additional physical insight. This extension and the development of the associated computational tools are the subjects of ongoing work. The results here are associated with the maximum amplification over all frequencies but it may be also interesting to isolate each temporal frequency and examine the frequency that maximizes the amplification under this structured feedback interconnection. Another natural direction is an extension to pipe flow, where subcritical transition is also widely studied (e.g. Hof, Juel & Mullin Reference Hof, Juel and Mullin2003; Peixinho & Mullin Reference Peixinho and Mullin2007; Eckhardt et al. Reference Eckhardt, Schneider, Hof and Westerweel2007; Mellibovsky & Meseguer Reference Mellibovsky and Meseguer2009; Mullin Reference Mullin2011; Pringle & Kerswell Reference Pringle and Kerswell2010; Pringle, Willis & Kerswell Reference Pringle, Willis and Kerswell2012; Barkley Reference Barkley2016). Adaptations of this approach to the fully developed turbulent regime, where the resolvent framework and input–output analysis have provided important insights, are another direction of ongoing study.
Funding
The authors gratefully acknowledge support from the US National Science Foundation (NSF) through grant number CBET 1652244 and the Office of Naval Research (ONR) through grant number N00014-18-1-2534. C.L. greatly appreciates the support from the Chinese Scholarship Council.
Declaration of interests
The authors report no conflict of interest.
Appendix A. Proof of theorems 3.1 and 4.1
A.1. Proof of theorem 3.1
Proof. We define the following sets of uncertainty:
 $$\begin{gather} \hat{\boldsymbol{\mathsf{U}}}_{\varXi,ux}:=\left\{\text{diag}\left(-\hat{\boldsymbol{\mathsf{u}}}_{\xi}^{\text{T}},\boldsymbol{\mathsf{0}},\boldsymbol{\mathsf{0}}\right):-\hat{\boldsymbol{\mathsf{u}}}^{\text{T}}_{\xi}\in \mathbb{C}^{N_y\times 3N_y}\right\}, \end{gather}$$
 $$\begin{gather}\hat{\boldsymbol{\mathsf{U}}}_{\varXi,vy}:=\left\{\text{diag}\left(\boldsymbol{\mathsf{0}},-\hat{\boldsymbol{\mathsf{u}}}_{\xi}^{\text{T}},\boldsymbol{\mathsf{0}}\right):-\hat{\boldsymbol{\mathsf{u}}}^{\text{T}}_{\xi}\in \mathbb{C}^{N_y\times 3N_y}\right\}, \end{gather}$$
 $$\begin{gather}\hat{\boldsymbol{\mathsf{U}}}_{\varXi,wz}:=\left\{\text{diag}\left(\boldsymbol{\mathsf{0}},\boldsymbol{\mathsf{0}},-\hat{\boldsymbol{\mathsf{u}}}_{\xi}^{\text{T}}\right):-\hat{\boldsymbol{\mathsf{u}}}^{\text{T}}_{\xi}\in \mathbb{C}^{N_y\times 3N_y}\right\}. \end{gather}$$
Here,  $\boldsymbol{\mathsf{0}}\in \mathbb {C}^{N_y\times 3N_y}$ is a zero matrix with size
 $N_y\times 3N_y$. Then, using the definition of the structured singular value in definition 2.1, we have
 \begin{align} &\mu_{\hat{\boldsymbol{\mathsf{U}}}_{\varXi,ux}}\left[\boldsymbol{\mathsf{H}}_{{\nabla}}(k_x,k_z,\omega)\right]\nonumber\\ &\quad =\frac{1}{\text{min}\{\bar{\sigma}[\hat{\boldsymbol{\mathsf{u}}}_{\varXi,ux}]\,:\,\hat{\boldsymbol{\mathsf{u}}}_{\varXi,ux}\in \hat{\boldsymbol{\mathsf{U}}}_{\varXi,ux},\,\text{det}[\boldsymbol{\mathsf{I}}-\boldsymbol{\mathsf{H}}_{{\nabla}}(k_x,k_z,\omega)\hat{\boldsymbol{\mathsf{u}}}_{\varXi,ux}]=0\}} \end{align}
 \begin{align} &\quad =\frac{1}{\text{min}\{\bar{\sigma}[-\hat{\boldsymbol{\mathsf{u}}}^{\text{T}}_{\xi}]\,:\,-\hat{\boldsymbol{\mathsf{u}}}^{\text{T}}_{\xi}\in \mathbb{C}^{N_y\times 3N_y},\,\text{det}[\boldsymbol{\mathsf{I}}_{3N_y}-\boldsymbol{\mathsf{H}}_{{\nabla} ux}(k_x,k_z,\omega)(-\hat{\boldsymbol{\mathsf{u}}}^{\text{T}}_{\xi})]=0\}} \end{align}
 \begin{align} &\quad=\bar{\sigma}[\boldsymbol{\mathsf{H}}_{{\nabla} ux}(k_x,k_z,\omega)]. \end{align}
Here, the equality (A2a) is obtained by substituting the uncertainty set in (A1a) into definition 2.1. The equality (A2b) is obtained by performing block diagonal partition of terms inside of  $\text {det}[\cdot ]$ and employing zeros in the uncertainty set in (A1a). Here,
 $\boldsymbol{\mathsf{H}}_{{\nabla } ux}$ is the discretization of
 $\mathcal {H}_{{\nabla } ux}$ and
 $\boldsymbol{\mathsf{I}}_{3N_y}\in \mathbb {C}^{3N_y\times 3N_y}$ in (A2b) with size
 $(3N_y\times 3N_y)$, whereas
 $\boldsymbol{\mathsf{I}} \in \mathbb {C}^{9N_y\times 9N_y}$ in (A2a). The equality (A2c) uses the definition of unstructured singular value; see e.g. Zhou et al. (Reference Zhou, Doyle and Glover1996, equation (11.1)).
Similarly, we have
 $$\begin{gather}
\mu_{\hat{\boldsymbol{\mathsf{U}}}_{\varXi,vy}}
[\boldsymbol{\mathsf{H}}_{{\nabla}}(k_x,k_z,\omega)]=\bar{\sigma}[\boldsymbol{\mathsf{H}}_{{\nabla}
vy}(k_x,k_z,\omega)],
\end{gather}$$
 $$\begin{gather}\mu_{\hat{\boldsymbol{\mathsf{U}}}_{\varXi,wz}}
[\boldsymbol{\mathsf{H}}_{{\nabla}}(k_x,k_z,\omega)]=\bar{\sigma}[\boldsymbol{\mathsf{H}}_{{\nabla}
wz}(k_x,k_z,\omega)].
\end{gather}$$
Using the fact that  $\hat {\boldsymbol{\mathsf{U}}}_{\varXi }\supseteq \hat {\boldsymbol{\mathsf{U}}}_{\varXi ,ij}$ with
 $ij=ux,vy,wz$ and equalities in (A2)–(A3), we have
 \begin{equation}
\mu_{\hat{\boldsymbol{\mathsf{U}}}_{\varXi}}[\boldsymbol{\mathsf{H}}_{{\nabla}}(k_x,k_z,\omega)]
\geqslant\mu_{\hat{\boldsymbol{\mathsf{U}}}_{\varXi,ij}}[\boldsymbol{\mathsf{H}}_{{\nabla}}(k_x,k_z,\omega)]=\bar{\sigma}[\boldsymbol{\mathsf{H}}_{{\nabla}
ij}(k_x,k_z,\omega)]. \end{equation}
Applying the supreme operation  ${\text {sup}}_{\omega \in \mathbb {R}}[\cdot ]$ on (A4) and using the definitions of
 $\|\cdot \|_{\mu }$ and
 $\|\cdot \|_{\infty }$, we have
 \begin{equation} \|\mathcal{H}_{{\nabla} }\|_{\mu}\geqslant \|\mathcal{H}_{{\nabla} ux}\|_{\infty},\quad\|\mathcal{H}_{{\nabla} }\|_{\mu}\geqslant \|\mathcal{H}_{{\nabla} vy}\|_{\infty}, \quad \|\mathcal{H}_{{\nabla} }\|_{\mu}\geqslant \|\mathcal{H}_{{\nabla} wz}\|_{\infty}. \end{equation}
A.2. Proof of theorem 4.1
Proof. Under the streamwise constant  $k_x=0$ assumption for plane Couette flow or plane Poiseuille flow in theorem 4.1, the operators
 $\hat {\mathcal {A}}$,
 $\hat {\mathcal {B}}$ and
 $\hat {\mathcal {C}}$ can be simplified and decomposed as
 $$\begin{gather} \hat{\mathcal{A}}(k_x,k_z)=\begin{bmatrix} \frac{\hat{{\nabla}}^{{-}2}\hat{{\nabla}}^4}{Re} & 0 \\ -\text{i}k_zU' & \frac{\hat{{\nabla}}^2}{Re} \end{bmatrix}, \end{gather}$$
 $$\begin{gather}\mathcal{\hat{B}}(k_x,k_z)=\begin{bmatrix} 0 & -k_z^2\hat{{\nabla}}^{{-}2} & -\text{i}k_z\hat{{\nabla}}^{{-}2} \partial_y \\ \text{i}k_z & 0 & 0 \end{bmatrix}=:\begin{bmatrix} 0 & \hat{\mathcal{B}}_{y,1} & \hat{\mathcal{B}}_{z,1} \\ \mathcal{B}_{x,2} & 0 & 0 \end{bmatrix}, \end{gather}$$
 $$\begin{gather}\mathcal{\hat{C}}(k_x,k_z)=\begin{bmatrix} 0 & -\text{i}/k_z \\ \mathcal{I} & 0 \\ \text{i} \partial_y/k_z & 0 \end{bmatrix}=:\begin{bmatrix} 0 & \hat{\mathcal{C}}_{u,2} \\ \hat{\mathcal{C}}_{v,1} & 0 \\ \hat{\mathcal{C}}_{w,1} & 0 \end{bmatrix}. \end{gather}$$
Here, we employ a matrix inverse formula for the lower triangle block matrix:
 \begin{equation} \begin{bmatrix} L_{11} & 0 \\ L_{21} & L_{22} \end{bmatrix}^{{-}1}=\begin{bmatrix} L_{11}^{{-}1} & 0\\ -L_{22}^{{-}1}L_{21}L_{11}^{{-}1} & L_{22}^{{-}1} \end{bmatrix} \end{equation}
to compute  $(\text {i}\omega \mathcal {I}_{2\times 2}-\hat {\mathcal {A}})^{-1}$. Then, we employ a change of variable
 $\varOmega =\omega Re$ similar to Jovanović (Reference Jovanović2004), Jovanović & Bamieh (Reference Jovanović and Bamieh2005) and Jovanović (Reference Jovanović2021) to obtain
 $\mathcal {H}_{{\nabla } ij}$ with
 $i=u,v,w$, and
 $j=x,y,z$ as
 $$\begin{gather} \mathcal{H}_{{\nabla} ux}=\hat{\boldsymbol{\nabla}}\hat{\mathcal{C}}_{u,2}Re(\text{i}\varOmega \mathcal{I}-\hat{{\nabla}}^2)^{{-}1}\hat{\mathcal{B}}_{x,2}, \end{gather}$$
 $$\begin{gather}\mathcal{H}_{{\nabla} uy}=\hat{\boldsymbol{\nabla}}\hat{\mathcal{C}}_{u,2}Re(\text{i}\varOmega \mathcal{I}-\hat{{\nabla}}^2)^{{-}1}(-\text{i}k_zU')Re(\text{i}\varOmega \mathcal{I}-\hat{{\nabla}}^{{-}2}\hat{{\nabla}}^{4})^{{-}1} \hat{\mathcal{B}}_{y,1}, \end{gather}$$
 $$\begin{gather}\mathcal{H}_{{\nabla} uz}=\hat{\boldsymbol{\nabla}}\hat{\mathcal{C}}_{u,2}Re(\text{i}\varOmega \mathcal{I}-\hat{{\nabla}}^2)^{{-}1}(-\text{i}k_zU')Re(\text{i}\varOmega \mathcal{I}-\hat{{\nabla}}^{{-}2}\hat{{\nabla}}^{4})^{{-}1}\hat{\mathcal{B}}_{z,1}, \end{gather}$$
 $$\begin{gather}\mathcal{H}_{{\nabla} vx}=0, \end{gather}$$
 $$\begin{gather}\mathcal{H}_{{\nabla} vy}=\hat{\boldsymbol{\nabla}}\hat{\mathcal{C}}_{v,1}Re(\text{i}\varOmega \mathcal{I}-\hat{{\nabla}}^{{-}2}\hat{{\nabla}}^{4})^{{-}1} \hat{\mathcal{B}}_{y,1}, \end{gather}$$
 $$\begin{gather}\mathcal{H}_{{\nabla} vz}=\hat{\boldsymbol{\nabla}}\hat{\mathcal{C}}_{v,1}Re(\text{i}\varOmega \mathcal{I}-\hat{{\nabla}}^{{-}2}\hat{{\nabla}}^{4})^{{-}1} \hat{\mathcal{B}}_{z,1}, \end{gather}$$
 $$\begin{gather}\mathcal{H}_{{\nabla} wx}=0, \end{gather}$$
 $$\begin{gather}\mathcal{H}_{{\nabla} wy}=\hat{\boldsymbol{\nabla}}\hat{\mathcal{C}}_{w,1}Re (\text{i}\varOmega \mathcal{I}-\hat{{\nabla}}^{{-}2}\hat{{\nabla}}^{4})^{{-}1} \hat{\mathcal{B}}_{y,1}, \end{gather}$$
 $$\begin{gather}\mathcal{H}_{{\nabla} wz}=\hat{\boldsymbol{\nabla}}\hat{\mathcal{C}}_{w,1}Re (\text{i}\varOmega \mathcal{I}-\hat{{\nabla}}^{{-}2}\hat{{\nabla}}^{4})^{{-}1} \hat{\mathcal{B}}_{z,1}. \end{gather}$$
Applying the operation  $\|\cdot \|_{\infty }={\sup}_{{\omega \in \mathbb {R}}}\,\bar {\sigma }[\cdot ]= {\text {sup}}_{{\varOmega \in \mathbb {R}}}\,\bar {\sigma }[\cdot ]$, we have the scaling relation in theorem 4.1.