


Introduction
The study of ice-sheet mass balance is timely because of the practical importance to predictions of possible future sea-level rise (Reference Church and HoughtonChurch and others, 2001; ISMASS Committee, 2004; Reference WigleyWigley, 2005). Recently, significant advances in our understanding of the mass balance of the Antarctic ice sheet have been achieved. For example, rapid and substantial changes were detected in several sections of West Antarctica (e.g. Reference Conway, Catania, Raymond, Scambos, Engelhardt and GadesConway and others, 2002; Reference Joughin and TulaczykJoughin and Tulaczyk, 2002; Reference Payne, Vieli, Shepherd, Wingham and RignotPayne and others, 2004; Reference Scambos, Bohlander, Shuman and SkvarcaScambos and others, 2004; Reference Shepherd, Wingham and RignotShepherd and others, 2004; Reference ThomasThomas and others, 2004); ice-flow patterns in the interior of the Antarctic ice sheet are much more complex than previously thought (Reference JoughinJoughin and others, 1999; Reference Bamber, Vaughan and JoughinBamber and others, 2000; Reference Wu and JezekWu and Jezek, 2004); and substantial bottom melting is widespread near Antarctic ice-sheet grounding lines and sensitive to ocean warming (Reference Rignot and JacobsRignot and Jacobs, 2002; Reference Shepherd, Wingham and RignotShepherd and others, 2004). However, the current state of balance of the Antarctic ice sheet is still not well known. The latest Intergovernmental Panel on Climate Change estimate of the Antarctic contribution to 20th-century sea-level rise is –0.2 to 0.0 mm a−1 (Reference Church and HoughtonChurch and others, 2001). Subsequent estimates by the mass-budget method indicate the 20th-century Antarctic mass imbalance seems near to zero or slightly negative (Reference Rignot and ThomasRignot and Thomas, 2002; ISMASS Committee, 2004). Even the sign of the mass imbalance of the East Antarctic ice sheet cannot yet be determined, though it is assumed to be close to balance (Reference Rignot and ThomasRignot and Thomas, 2002). The most recent satellite radar altimetry measurements of elevation change from 1992 to 2003 indicate the East Antarctic ice-sheet interior north of 81.6˚ S increased in mass by 45 ±7Gta−1 (Reference Davis, Li, McConnell, Frey and HannaDavis and others, 2005).
The mass balance of an ice sheet includes two components, namely accumulation (input) and ice-flux discharge (output). The input component to ice-sheet mass balance is the net accumulation of snow at the surface, which is commonly obtained from ice-core stratigraphy and mass-balance stakes. Records of annual accumulation show large variability, both in space and in time, due to topographic effects, snow redistribution by wind action, and short-term fluctuations in snowfall due to climate variability (Reference Van der Veen and BolzanVan der Veen and Bolzan, 1999). The variability of annual accumulation over time and space is of particular interest for studying changes in the mass balance of the ice sheet. However, major gaps in our knowledge of the processes that determine the magnitude of the temporal and spatial variability prevent us from making best use of advances in technology and atmospheric models to produce a reliable estimate of current mass input, and prediction of its future trend (Reference Van der Veen and BolzanVan der Veen and Bolzan, 1999; ISMASS Committee, 2004).
Here we use GIS (Geographic Information System) to combine a variety of datasets derived from field measurements and modeling to (1) analyze the uncertainties and variability of annual accumulation rate of the higher-elevation region of the Lambert Glacier–Amery Ice Shelf system (hereafter, LAS) on different temporal and spatial scales, and (2) assess mass budgets of five sub-basins of the LAS at high elevations.
We use the Reference Fricker, Warner and AllisonFricker and others (2000) definition of the LAS, but the front of the Amery Ice Shelf is defined by the RAMP (RADARSAT-1 Antarctic Mapping Project) image mosaic (Reference JezekJezek, 1999). The LAS, located at 68.5–81˚ S, 40–95˚ E, is one of the largest glacier–ice-shelf systems in East Antarctica (Fig. 1), and an important drainage basin in terms of the overall mass balance of Antarctica (Reference Fricker, Warner and AllisonFricker and others, 2000). We define the higher-elevation region of the LAS to be above the ANARE (Australian National Antarctic Research Expeditions) LGB (Lambert Glacier basin) traverse route, which consists of five sub-basins, namely Lambert, Mellor and Fisher Glaciers, and drainages 9 and 11 (as geographically defined by Reference Giovinetto and BentleyGiovinetto and Bentley, 1985; Reference Giovinetto and ZwallyGiovinetto and Zwally, 2000) (Fig. 1). The boundaries of the LAS and its five sub-basins are defined by the Ohio State University digital elevation model (OSU DEM) (Reference Liu, Jezek and LiLiu and others, 1999), and flow stripes derived from the RAMP mosaic (Reference Wu and JezekWu and Jezek, 2004) in an Arc/Info environment, with a Lambert equal-area projection. The total area of the higher-elevation region of the LAS is 952 800 km2, about 8% of the total area of the grounded Antarctic ice sheet.
Map of the LAS, showing the location of the five sub-basins at high elevations (in grey), and the firn-core and GPS station sites used in this study. Points along the ANARE traverse indicate the locations of ice movement stations, starting with LGB00 near Mawson and extending counterclockwise around the basin to LGB72. Elevation contours are shown as dashed lines with a 1000 m interval.

In situ measurements have been carried out over the past five decades in the LAS region. Previous mass-balance studies, which indicated a largely (Reference AllisonAllison, 1979; Reference Bentley, Giovinetto, Weller, Wilson and SeverinBentley and Giovinetto, 1991) or at most a slightly (Reference McIntyreMcIntyre, 1985) positive mass imbalance in the interior drainage basin of the LAS, were briefly summarized by Reference Fricker, Warner and AllisonFricker and others (2000). The total integrated mass flux of 44 Gt a−1 orthogonal to the ANARE LGB line was derived from the observations along the LGB traverse line between LGB05 and LGB69 with an assumed surface velocity correction factor of 0.87 (Reference Fricker, Warner and AllisonFricker and others, 2000). A new grounding line for Lambert, Mellor and Fisher Glaciers was mapped using interferometric synthetic aperture radar (InSAR), which resulted in the mass-balance estimate for the three glaciers as a whole being close to balance (Reference RignotRignot, 2002). The spatial pattern of annual accumulation in the LAS was delineated with field measurements from the ANARE LGB traverses and the CHINARE (Chinese Antarctic Expedition) inland traverses (Reference Goodwin, Higham, Allison and RenGoodwin and others, 1994; Reference Higham, Craven, Ruddell and AllisonHigham and others, 1997; Reference Ren, Qin and AllisonRen and others, 1999; Reference QinQin and others, 2000). The temporal pattern revealed by shallow firn cores shows opposite trends of accumulation rate on the east and west sides of the LAS since the 1940s (Reference Xiao, Ren, Qin, Li, Sun and AllisonXiao and others, 2001), with the east (west) side having an increasing (decreasing) trend.
Datasets
The datasets used in this study include in situ measurements of ice thickness, velocity and surface snow accumulation collected along the ANARE and CHINARE traverses, annual accumulation rate reconstructions from four shallow firn cores, atmospheric model simulations, accumulation compilations and velocity ratio derived from a three-dimensional (3-D) thermomechanical model. For the purpose of data analysis and comparison, some data derived beyond the higher parts of the LAS are also used, and units for accumulation are in mma−1 of water equivalent.
The ANARE LGB traverse program took place over five austral summers between 1989/90 and 1994/95, and ice-thickness, velocity and surface accumulation data reports were made available (Reference Higham and CravenHigham and Craven, 1997; Reference Craven, Higham and BrocklesbyCraven and others, 2001; Reference KiernanKiernan, 2001). The CHINARE inland traverse program has been conducted in five summers since the 1996/97 field season. The first portion of the CHINARE traverse line overlaps the ANARE traverse (between Australian GPS (global positioning system) station LGB72 and LGB65 that corresponds to DT001 for CHINARE traverse numbering), or is close to (from LGB65 to LGB58) the ANARE traverse route (Fig. 1).
The ANARE route between Mawson and Davis stations approximately follows the 2500 m surface elevation contour for 2200 km around the interior of the LAS and neighboring regions (Fig. 1). Seventy-three ice-movement stations (LGB00-LGB72) were established along the route. The stations are typically positioned at 30 km intervals as shown in Figure 1. Across the Lambert graben, the stations have been positioned at intervals of 15 km in order to resolve the more detailed ice velocity in this region. At each station, surface ice-flow velocity magnitude and azimuth were derived from static GPS observations made in at least two separate years. The mean (2σ) precision of the GPS velocity results is 0.108ma−1. All but two of these ice-velocity determinations had an estimated accuracy of better than 1 ma−1, and about 60% had an estimated accuracy better than 0.3 m a−1 (Reference Fricker, Warner and AllisonFricker and others, 2000; Reference Manson, Coleman, Morgan and KingManson and others, 2000; Reference KiernanKiernan, 2001). Digitally recorded ice-thickness soundings were made approximately every 10m along the route and averaged over 2 km intervals. The resolution of the individual soundings is about 20 m, although in some short sections where no bottom echo was obtained, the radio-echo sounding (RES) measurements were interpolated with gravity data (Reference Craven, Higham and BrocklesbyCraven and others, 2001).
The annual accumulation rate was derived from stake measurements and surface snow density. Individual measurements were made on bamboo stakes spaced at 2 km intervals along both the ANARE and CHINARE traverse routes (Reference Higham and CravenHigham and Craven, 1997; Reference QinQin and others, 2000). The measurement accuracy for accumulation stakes is estimated to be ±20 mm absolute. Measurements of snow density with an accuracy estimated as ±5% are available for the whole 2000 km of the traverse route from LGB00 to LGB72 (Reference Higham and CravenHigham and Craven, 1997).
During the 1992 joint Australian-Chinese over-snow traverse on the west side of the LAS, two firn cores were drilled at MGA and LGB16 (Fig. 1). These two cores were dated stratigraphically using isotopic profiles, electrical conductivity measurements, stratigraphy and known accumulation rates (Table 1) (Reference Ren, Qin and AllisonRen and others, 1999). Between 1996 and 1998, a second pair of firn cores was recovered at DT001 and DT085 (Fig. 1). δ18O, chemical species (Cl−, Na+ and NO3–) and various stratigraphy features were used to cross-date these with a precision believed to be ±2 years for the upper 20 m (Reference QinQin and others, 2000), and ±3 years for DT001 as a whole (total 246 annual layers) (Table 1) (Reference WenWen and others, 2001; Reference Xiao, Ren, Qin, Li, Sun and AllisonXiao and others, 2001). The dating for the DT001 firn core was also validated by volcanic horizons (Reference ZhangZhang and others, 2002).
Summary of the four firn cores

Atmospheric model simulations include two datasets:
-
1. Mean annual 60 km resolution Antarctic snowdrift transport (DST) for 3 years (July 1996-June 1999), which is estimated by the Reference Budd, Dingle, Radok and RubinBudd and others (1966) equation from wind fields at 10 m above the surface. The wind fields are derived from Polar MM5, a version of the fifth-generation Pennsylvania State University/US National Center for Atmospheric Research Mesoscale Model optimized for use over ice sheets (Reference Bromwich, Guo, Bai and ChenBromwich and others, 2004).
-
2. Two years (September 2001-August 2003) of 30 km resolution Antarctic precipitation data from the Antarctic Mesoscale Prediction System (AMPS), a real-time forecasting system that supports the US Antarctic Program and which employs Polar MM5 (Reference Powers, Monaghan, Cayette, Bromwich, Kuo and ManningPowers and others, 2003). This is the highest-resolution modeled precipitation dataset currently available for the LAS.
Surface accumulation datasets include the compilations by Reference Vaughan, Bamber, Giovinetto, Russell and CooperVaughan and others (1999) and Giovinetto (Reference Giovinetto and ZwallyGiovinetto and Zwally (2000), modified, Giovinetto) (hereafter, referred to as the Vaughan and Giovinetto compilations respectively). In the same manner as Reference Joughin and TulaczykJoughin and Tulaczyk (2002) and Reference RignotRignot (2002), we estimated integrated accumulation using the average of these two accumulation compilations that were based on essentially the same source data using different analysis and interpolation criteria (Reference Giovinetto and ZwallyGiovinetto and Zwally, 2000).
Velocity ratio, defined as column-averaged velocity divided by surface velocity, is derived from a model simulation of the Antarctic ice sheet with a 3-D thermo-mechanical ice-sheet model that takes into account basal sliding and a variable temperature with depth (Reference HuybrechtsHuybrechts, 2002). The calculation was performed on a high-resolution grid (10 km horizontal resolution, 30 layers in the vertical) for steady-state present-day conditions using the BEDMAP geometric datasets (Reference Lythe and VaughanLythe and others, 2001). Typical values of the velocity ratio are around 0.9 for cold interior ice frozen to bedrock, but close to 1 in outlet glaciers and areas at pressure melting where basal sliding makes up a substantial fraction of the column-averaged velocity, i.e. much higher values than the 0.8 value obtained for isothermal ice deforming under Glen’s flow law in the absence of basal sliding.
Results and Discussion
Temporal and spatial variability of firn-core accumulation records
The temporal and spatial fluctuation in accumulation is commonly evaluated by the standard deviation (a). Temporal variabilities, expressed by the coefficient of variation (CV), i.e. the ratio of the standard deviation to the mean (Reference Anklin, Bales, Mosley-Thompson and SteffenAnklin and others, 1998; Reference Bales, Mosley-Thompson and McConnellBales and others, 2001b), are 32.7%, 40.2%, 32.0% and 29.3% of the annual mean accumulation for the DT001, DT085, LGB65 and MGA firn cores respectively (Table 1). The average CV of the four cores is 33.6%, which is a little higher than that observed for three intermediate-depth ice cores from Dronning Maud Land, East Antarctica. These cores have a typical year-to-year variation of about 30% (Reference SommerSommer and others, 2000).
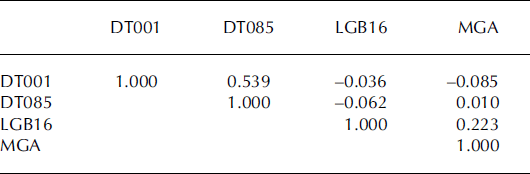
For overlapping years, the annually resolved accumulation rates show no correlation within the four cores. Application of a five-point triangular filter with weights 1, 2, 3, 2, 1 removes some local small-scale spatial variability (Fig. 2). After filtering, the accumulation records of two cores on the east side of the LAS are better correlated (R = 0.539, R 2 = 0.291, significance >99.9%), while the two cores on the west side are weakly correlated (R = 0.223, R 2 = 0.050, significance 93%). The accumulation rates show no correlation between the east-side and west-side cores (Table 2). These correlation patterns may result from the complexity of the climatic regime in the LAS and the geographic locations of the firn cores. First, the trends of accumulation rates over the last five decades are different between the east and west sides of the LAS. The accumulation rates of DT001 and DT085 (on the east side of the LAS) have similar increasing trends from 1940 to the mid-1990s, with accumulation minima in the 1960s, while MGA and LGB16 (on the west side) display decreasing trends (Reference WenWen and others, 2001; Reference Xiao, Ren, Qin, Li, Sun and AllisonXiao and others, 2001). This suggests that there are differences in decadal trends in atmospheric forcing on either side of the LAS. Second, the intermediate correlation between DT001 and DT085 may be largely because they are only 167 km apart and have similar elevations and average accumulation rates, while the weak correlation between MGA and LGB16 may be because they are much further apart (476 km) and have large differences in their elevations and accumulation rates (Table 1). In addition, despite their similar downward trends, the LGB16 core record represents a more inland climate regime than the MGA firn core, which lies near the coast.
Accumulation rate records (smoothed by a five-point triangular filter) of the four firn cores from the east (σ) (DT001, solid line; DT085, dashed line) and the west side (b) (LGB16, solid line; MGA, dashed line) of the LAS.

Summary of correlation coefficients of the accumulation rates between firn cores calculated with five-point triangular filtered data
The larger-scale topographic relief has an important influence on long-term (i.e. decadal mean) accumulation rates. In contrast, smaller surface features, such as sastrugi, are transient, with typically short lifespans of the order of 1 year or less, and contribute to variability in point measurements of accumulation. All of these signals are combined in the measured data. To reliably retrieve climatically significant changes in accumulation rate, averages over longer periods are needed (Reference Van der Veen and BolzanVan der Veen and Bolzan, 1999; Reference Van der Veen, Mosley-Thompson, Gow and MarkVan der Veen and others, 1999; Reference Mosley-ThompsonMosley-Thompson and others 2001). For example, Reference Mosley-ThompsonMosley-Thompson and others (2001) analyzed a suite of spatially distributed cores collected under the Program for Arctic Regional Climate Assessment (PARCA) to assess local to regional variability of annual accumulation rates over the Greenland ice sheet. They concluded that, to reduce glaciological noise, a 20 year running mean should be applied where the annual accumulation rate is <250mm, and a 10year running mean where the annual accumulation rate exceeds 250mm. To assess the variability relative to the long-term mean, we calculate the standard deviation and range of the accumulation rate of the DT001 core with different averaging intervals (Table 3). If no running mean is applied to the 246 year time series, a CV of ±32.7% of the annual mean results. If a 10year running mean is applied, the CV drops off to ±10%, and using 30 year or 50 year running means results in a CV close to ±5%. The corresponding ranges of the minimum and maximum have the same trend. The results listed in Table 3 indicate that the CV and range and mean drop off quickly between the annual accumulation and the 10year running mean, and then decrease slowly thereafter. Taking the 10 year running mean greatly reduces the uncertainty relative to the long-term mean, but the 30 year running mean may best approximate the information about the regional trend in accumulation in this region.
Statistical summary of DT001 core accumulation rate in different averaging intervals

In summary, accumulation trends on either side of the LAS are of opposite sign, indicating the complexity of climate variability just within this limited region. Interannual variability of accumulation is in excess of 30% of the annual mean, but averaging over time periods of 10years or more yields a more stable estimate of accumulation that is useful for retrieving climatically significant changes in accumulation rate.
Spatial and temporal variability of stake measurements
Annual accumulation rates derived from mass-balance stakes along the traverses are highly variable (e.g. Fig. 3). It is necessary to average the single-point measurements with a certain number of neighbor stake measurements to obtain a mean accumulation rate which can approximately represent the local accumulation signal. Several studies report different averaging intervals to obtain the mean measurements along both the ANARE and CHINARE traverses. For example, Reference Goodwin, Higham, Allison and RenGoodwin and others (1994, fig. 2) used the 10 km mean accumulation rate measurements (five-stake averages) along the traverse route; Reference Higham, Craven, Ruddell and AllisonHigham and others (1997, fig. 2) smoothed the accumulation rates over 30 km intervals (15-stake averages); Reference Ren, Qin and AllisonRen and others (1999, fig. 2) used a 21-stake running average; and Reference QinQin and others (2000, fig. 6) adopted a seven-stake smoothing mean. Considering the range of spatial smoothing employed by previous studies, in the following paragraph we examine several averaging intervals to determine which will better remove the noise caused by microrelief and blowing snow, and thus provide the optimum local accumulation signal from stake measurements.
The distribution of annual accumulation from stake measurements in 1994 along ANARE LGB traverse route from LT078 to LT926 (Reference Higham and CravenHigham and Craven, 1997), together with the accumulation from the Reference Vaughan, Bamber, Giovinetto, Russell and CooperVaughan and others (1999) (bold line) and Giovinetto (Reference Giovinetto and ZwallyGiovinetto and Zwally (2000), modified, Giovinetto) (dotted line) compilations.

The accumulation rate measurements in 1994 along the ANARE LGB traverse from LT078 to LT926 (from the west to the east margin of the LAS) are used to address this question. However, we do not know the long-term annual mean accumulation rate for each stake measurement, which is needed for evaluating the standard deviation. To counter this, we interpolate the Vaughan and Giovinetto compilations onto a 5 km cell-size grid using kriging, and then accumulation values are retrieved for each stake (Fig. 3). Discerned by eye in Figure 3, the profile plotted using the Vaughan dataset seems to match the accumulation variation better than the Giovinetto data. This may be due to a map of accumulation rate (MBz) produced using the firn emissivity method by combining the radiative transfer equation with a grain-growth function being used as background field to control the contouring of sparse data in the Vaughan compilation (Reference Vaughan, Bamber, Giovinetto, Russell and CooperVaughan and others, 1999). Thus the Vaughan compilation is used as a proxy of the average annual accumulation rate for the stake measurements along the traverse route. If the accumulation measurements at each stake can be assumed to have a common variance (Reference Freund and WilsonFreund and Wilson, 2003), the a and CV, listed in Table 4, can be obtained by


where yis
and yid
are the in situ accumulation measurement and the annual accumulation from Vaughan’s compilation at the ith stake,  is the total number of the stakes, and n -
1 is the degrees of freedom.
Statistical summary of accumulation rate along the ANARE LGB traverse route from LT078 to LT926*

Table 4 shows that the result of increased smoothing on the standard deviation of the accumulation rate derived from stake measurements is similar to that obtained from smoothing the annual layers of the DT001 firn core (Table 3). The 15-point or 21-point running means remove most of the high-frequency spatial variation, and thus are more representative of the mean local accumulation conditions than the 5-point or 7-point averages.
Although the spatial noise is removed by multi-point averaging, the temporal variations remain. Figure 4 shows the 15-point average accumulation rate in 1998 (by CHINARE) and in 1994 (by ANARE) along the portion of the traverse from LGB72 to LT794 (Reference Higham and CravenHigham and Craven, 1997) on the east side of the LAS. Most of the average values for 1998 are much larger (by one-third or more) than those for 1994. The stake measurements from the ANARE traverses from 1990 to 1994 also indicate interannual variability (from the 15-point mean) of up to 50% in the LAS areas of relatively low accumulation (Reference Higham and CravenHigham and Craven, 1997). This indicates that caution should be exercised when using stake records of only 1 year to compile or estimate the accumulation, because of their high variability. Indeed, the uncertainty of a recent accumulation map over the Greenland ice sheet developed by Reference Bales, McConnell, Mosley-Thompson and CsathόBales and others (2001a) decreased substantially in comparison with previous compilations due to the exclusion of all single-year measurements and the addition of a number of longer-term accumulation records.
The distribution of the 15-point averaged accumulation rate in 1998 (thick line, by CHINARE) and in 1994 (thin line, by ANARE) from LGB72 to LT794 (LGB59–LGB60).

In summary, the annual accumulation rates along the ANARE traverse show high-frequency spatial variability. It is found that 15- and 21-point averages provide the best representation of the mean local accumulation rate along the traverse route; however, the single-year record employed here is subject to strong interannual variability.
Impact of drift-snow transportation on the accumulation redistribution
Although the effects of drift-snow transport (DST) are an implicit part of accumulation measurements, and thus do not directly factor in to our mass-budget calculations, we recognize the importance of DST on erosion and deposition in the LAS as well as on the determination of ice-core drilling sites along a traverse, and thus we briefly examine the spatial variability of DST here. Figure 5a shows annual mean erosion/deposition of DST estimated from the surface wind fields simulated by Polar MM5 (Reference Bromwich, Guo, Bai and ChenBromwich and others, 2004), per the algorithm of Reference Budd, Dingle, Radok and RubinBudd and others (1966). The model output is 60 km resolution, and thus these data reflect the large-scale topographic influence on the accumulation redistribution. Figure 5b shows the percentage ratio between the DST and precipitation from Polar MM5/AMPS. From Figure 5 several features can be observed. First, the model predicts erosion in a large area between Lambert and Mellor drainages and deposition on both the east and west sides of the LAS at high elevations. Second, the maximum erosion and deposition areas are along the Australian LGB traverse route. The maximum erosion region between GPS stations LGB32 and LGB37 (Fig. 1) corresponds to the transect with low accumulation rate dipping to around 20 mma−1 (Reference Higham and CravenHigham and Craven, 1997). Strong katabatic winds (an annual mean wind speed of 11.3 ms−1 has been measured by an automatic weather station at GPS station LGB35) play an important role in the snowfall redistribution, and cause the strongly glazed surface-wind crusts characteristic of the area (Reference Higham, Craven, Ruddell and AllisonHigham and others, 1997; Reference Craven and AllisonCraven and Allison, 1998). Third, the absolute values of erosion/ deposition by blowing snow over the higher-elevation parts of the LAS are much smaller than those along the coast (<50mma−1), and the corresponding divergence/convergence patterns of the DST are also simpler (Reference Bromwich, Guo, Bai and ChenBromwich and others, 2004). However, because of the cold, dry climate associated with the high surface elevation south of the LGB traverse, the spatial variability of erosion/deposition of snow by the wind has a noticeable impact on the surface mass balance (Fig. 5b), which is similar to results reported previously by Reference Van den BroekeVan den Broeke and others (1999) in Dronning Maud Land.
Mean annual divergence/convergence of DST (mm a−1 w.e.) (σ) and the percentage of the DST/precipitation (b). The positive indicates erosion, and the negative, deposition. The 60 km Polar MM5 DST dataset and the 30 km AMPS precipitation dataset were interpolated onto 5 km cell-size grid and overlaid to generate (b) in an Arc/Info environment.

Mass budgets
The mass budgets of the five sub-basins of the LAS at high elevations are estimated using the same methods as Reference Thomas, Csathό, Gogineni, Jezek and KuivinenThomas and others (1998, Reference Thomas2000), and Reference Joughin and TulaczykJoughin and Tulaczyk (2002). The ice-discharge flux (F) through a gate is

where H is the ice thickness, U is the surface-ice velocity, w is the distance across the gate, K is a correction factor applied to convert the velocity to its equivalent value normal to the gate, K = sin (Φ), Φ is the angle between the gate and the ice-flow direction, and R is the velocity ratio.
The angles between velocities and the gate line are defined by the orientation of the smaller angle between velocities and the gate line. Ice velocities were interpolated between adjacent GPS stations assuming a linear change in speed and direction between the two measured values (Reference Thomas, Csathό, Gogineni, Jezek and KuivinenThomas and others, 1998). The product of these interpolated values with the corresponding values of ice thickness and distance (Δw) of the segment between two ice-thickness measurements was then integrated across the gate. Equation (3) can be transformed into

where i is 1th, …, n - 1th ice-thickness measurements.
Table 5 gives values of w, average surface-ice velocity  , average ice thickness
 , average angle
 between flow direction and the gate, and average velocity ratio
 and F for each of the gates within the LAS along the Australian LGB traverse (Fig. 1). The ice velocity and its angle with the gate, which vary substantially along the route, are the major factors affecting the variability of the ice fluxes for each gate.
Values for GPS gates

For the diverging flows, i.e. if the angle (Φf) between the flow directions of two adjacent GPS stations plus the smaller angle (Φs) of the two angles between the flow directions and the gate is larger than 908, the angle between the flow directions and the gate should be interpolated as


where j is 1th, …, mth ice-thickness measurements.
The Φ values (Table 5) for gates 1 (LAS margin-LGB06), 36 (LGB40-LGB41), 47 (LGB51-LGB52), 51 (LGB55-LGB56) and 56 (LGB60-LGB61) are averaged from Φ j that is calculated by Equations (5) and (6). These values are larger than the averages of the two angles between the GPS flow directions and the gate.
Table 6 lists the ice flux of each drainage basin of the LAS at high elevations, which is computed as the integral of F across the LGB traverse line within each drainage. The total integrated mass flux of 48.0 Gta–1 orthogonal to the ANARE traverse within the LAS is 4Gta–1 larger than that calculated by Reference Fricker, Warner and AllisonFricker and others (2000). That is mainly due to the range of velocity ratios in this study, 0.90−0.98, higher than the 0.87 used by Reference Fricker, Warner and AllisonFricker and others (2000) because of the concentration of vertical shearing near to the bottom and/or the substantial fraction of basal sliding predicted by the 3-D ice-sheet model. The errors involved in calculating the total ice discharge include errors in measurements of ice velocity and its direction, ice thickness and the assumed velocity ratio between surface and column-averaged ice velocities. We use a value of 5% for the total error in calculated ice-discharge flux, which is consistent with the error analysis by Reference Thomas, Csathό, Gogineni, Jezek and KuivinenThomas and others (1998).
Discharge and accumulation fluxes for the LAS at high elevations
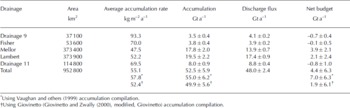
The total accumulation for each sub-basin is equal to its area multiplied by the annual accumulation rate from the mean of the Vaughan and Giovinetto compilations averaged over the area with the application of GIS techniques. The accumulation totals for the two compilations differ by ∼10%, which is indicative of the variability introduced by regridding (Reference Joughin and TulaczykJoughin and Tulaczyk, 2002). Thus we use a value of 10% for the error in the catchment-wide accumulation totals, and the catchment area error is assumed to be 5%.
The difference between the accumulation (input) and discharge (output) gives the mass budget for the five sub-basins. The results with uncertainties are given in Table 6. Our results indicate that drainage 9 has a negative imbalance of −0.7±0.4Gta−1, Lambert and Mellor Glaciers have a positive imbalance of 3.9 ±2.1 and 2.1 ±2.4Gta–1 respectively, and Fisher Glacier and drainage 11 are approximately in balance. These results indicate the glaciers may have different mass-balance behavior at high elevations. The higher-elevation region as a whole has a positive imbalance of 4.4±6.3Gta–1, which is consistent with an up-to-date radar altimetry assessment that shows thickening over this region for the period 1992-2003 (Reference Davis, Li, McConnell, Frey and HannaDavis and others, 2005).
Conclusions
In this paper, we have presented an analysis of the temporal and spatial variability of the accumulation and mass budgets over the higher-elevation regions of the LAS. Accumulation trends on either side of the LAS are of opposite sign, indicating the complexity of climate variability within our study region, which comprises about 8% of the surface area of the grounded Antarctic ice sheet. Interannual variability of accumulation is >30% of the annual mean. Taking a 10 year running mean greatly reduces the uncertainty relative to the long-term mean, but a 30 year running mean may better approximate the information about the regional trend in accumulation. The annual accumulation rates along the ANARE traverse show considerable high-frequency spatial variability. It is found that 15- and 21-point averages provide the best representation of the mean local accumulation rate along the traverse route; however, the single-year record employed here is subject to strong interannual variability. The atmospheric model simulations show that the spatial pattern of erosion/deposition of snow by the wind has a noticeable impact on the surface mass balance because of the cold, dry climate associated with the high surface elevation south of the LGB traverse.
We find drainage 9 has a negative imbalance of −0.7±0.4Gta–1, Lambert and Mellor Glaciers have a positive imbalance of 3.9±2.1 and 2.1 ±2.4Gta–1 respectively, and Fisher Glacier and drainage 11 are approximately in balance. These results indicate the glaciers may have different mass-balance behavior at high elevations. The higher-elevation region as a whole has a positive imbalance of 4.4±6.3Gta–1. It is noteworthy that despite the large uncertainty attached to our result, other studies corroborate our finding of a thickening in this region. Based on a dH/dt of 2.1 ± 0.3 cm a−1 in the grounded LAS (basin B-C) from Reference Davis, Li, McConnell, Frey and HannaDavis and others (2005) supporting online material, it can be deduced that an overall thickening trend in the basin from 1992 to 2003 is 9.0 ± 1.3 Gta−1. Put in terms of sea-level change, assuming 360 Gt is equivalent to 1 mm of global sea level (Reference JacobsJacobs, 1992), our thickening of 4.4 ± 6.3 Gta−1 upstream of the ANARE traverse line corresponds to the uptake of an additional 0.012 ±0.018 mm a−1 global ocean equivalent.
Acknowledgements
This work is supported by the National Natural Science Foundation of China (grants No. 4047128 and 40476005), the Shu Guang Project (grant No. 05SG46), the US National Aeronautics and Space Administration (NASA) Polar Oceans and Ice Sheets Program and NASA Headquarters under the Earth System Science Fellowship Grant (NGT5-30533). We thank M. Giovinetto and D. Vaughan for providing us with accumulation compilations, especially M. Giovinetto who provided a newly modified accumulation compilation. Some of the data used in this paper were obtained from the Australian Antarctic Data Centre (IDN Node AMD/AU), a part of the Australian Antarctic Division (Commonwealth of Australia). The data are described in the metadata records ‘Radio-echo sounding (RES) ice thickness data: LGB traverses 1990–95’ Allison, I. (1999) and ‘Ice sheet surface velocity data: LGB traverses 1989–95’ Allison, I. (1999). The authors are grateful to the two anonymous referees for their valuable comments which led to great improvements in this paper.



