Introduction: Protected areas management and the scale of public goods
The movement to create systems of national parks as protectors of the natural heritage of a people or nation began during the second half of the nineteenth century in the USA, Australia, and New Zealand, spreading throughout the world through the efforts of individual nations, international collaborations, and non-governmental organizations (Leiftmann, Reference Leiftmann1998). In the United States, Yosemite (in California) was transformed into a National Park in 1864 and Yellowstone (in Wyoming) was established in 1872. In Australia, Port Hacking was declared a National Park in 1879 (Beal, Reference Beal1996). Since then interest in conservation and environmental protection of natural lands has grown steadily. Classifying and managing nature reserves have also evolved since that time. Subsequent economic research on protected area management has emerged fairly recently in the United States and still more recently in the developing world.
Early efforts at establishing protected areas were largely in the developed world and were inward-looking; communities, states, and nations protected their scarce or unique natural heritage due to the demands and for the benefit of their people. Yosemite and Rocky Mountain National Parks were originally established due to their uniqueness in the United States and to benefit Americans; these are national level public goods and each American has equal standing in its preservation. City, county, and state parks, protected areas, and forests follow in kind; they are public goods of more limited scale and the people found within the managing jurisdiction have standing regarding their establishment and management. It is generally argued that the scale of management, and therefore standing and responsibility for management costs, ought to match the scale of the public good.
However, even early efforts to protect lands in their native state met with local opposition due to classic issues of concentrated costs and diffuse benefits. In the United States, for example, efforts to establish the National Park Service were supported in the eastern United States, where most of the people were, and opposed in the western states, where most of the lands targeted for protection were found. More recent efforts, driven, perhaps, by environmental non-governmental organizations, opportunities for debt-for-nature swaps through international lending institutions, or potential economic benefits of ecological tourism, are increasingly found in developing nations and are not necessarily in line with the preferences or needs of local people. For example, ongoing discussions among prominent international environmental non-governmental organizations (e.g., The Nature Conservancy, Conservation International) hold that the Brazilian Pantanal is a globally ecologically unique cradle of biological diversity and should be, therefore, protected for the benefit of current and future people worldwide, regardless of the welfare of the 90 thousand people who make their lives there. Small benefits to 6 billion people easily trump large costs to 90 thousand. Perversely, flawed benefit–cost analyses of dredging projects in the region made a similar argument, but, by giving standing to the 30 million people in the Paraguay-Parana River watershed, have found justification for environmental destruction rather than preservation.
In the parlance of social benefit–cost analysis, establishing who has standing (or property rights) goes a long way toward determining whether the benefits of protection will outweigh the costs of forgone opportunity. An understanding of the net benefit implications of ascribing standing to direct stakeholders versus indirect stakeholders versus diffuse (those economically but not financially affected by the resource) stakeholders in establishing and managing a public good of local, regional, national, or global scale provides opportunity to explore policy alternatives to reach a variety of potential optimal natural resource management objectives.
Ecotourism and protected area management
Ecological tourism is gaining interest both internationally and locally due to its potential to protect unique local, regional, national, or international biological diversity and provide economic benefits to local people, particularly in the developing world. Ecotourism has the potential to provide a means for international values for biological conservation to be meaningfully revealed at the resource management level where the direct incentives for conservation are often most diffuse or confounded.
One issue of persistent concern is the distinct management objectives of various stakeholder groups. Like all economic development options, the benefits and costs of ecotourism development may not be equally distributed among stakeholders and the objectives of the relevant stakeholders may be at cross purposes. Tourists maximize their utility from visiting the sanctuary based on the characteristics of their trip and their own preferences and constraints. Profit maximization is the main concern for landowners and managers. National social welfare maximization through resource use and/or protection is the principal responsibility of the national government in the management of natural areas. Local leaders and gateway communities, on the other hand, are concerned with maximizing the local community economic impact of tourist spending.
Application to the Monarch Butterfly Biosphere Reserve
Conceptual approach
Conflicting scales and objectives of management are found in the Biosphere Reserve of the Monarch Butterfly, located in Michoacan, Mexico, but are clearly not unique to this location. Here, we take the Monarch Butterfly Biosphere Reserve as our illustrative case of a globally valuable public good where ecotourism is a principal driver of local economic development. For relative simplicity, we ascribe standing to four principle groups: the quasi-private landowners (direct stakeholders), the tourists who visit the sanctuary (direct beneficiaries), the gateway communities providing many tourism services to visitors (indirect stakeholders), and the broader national and global population who do not intend to visit the sanctuary, but consider its ecological value positively (diffuse stakeholders).
The general objective of this paper is to estimate the economic performance of the monarch butterfly sanctuary under different potential management strategies. The optimal entrance fee, the most commonly available direct policy lever in visitor management, is analyzed in relation to the likely natural resource management and economic objectives of the four focal groups. Potential economic policies to entice local management changes in order to generate globally or regionally optimal economic welfare are then explored. Potential entry fee strategies are evaluated based upon the potential for weak Pareto, or Kaldor, welfare improvements among the identified stakeholder groups. Within this context, a Kaldor improvement is defined as a change that is either a Pareto improvement (no ‘losers’ and at least one ‘winner’) or such that the ‘winners’ from the change could, hypothetically, compensate the ‘losers’ and still be better off.
Empirical approach
The analysis is driven by estimated changes in visitor behavior. This empirical analysis will: (a) estimate the non-consumptive use value of the sanctuary of the monarch butterfly using combined revealed and stated preference information, (b) measure economic benefits to landowners of the sanctuary when entrance fees are able to change, and (c) measure the economic impact on gateway communities from visitors to the sanctuary. Optimal pricing strategies, based upon the potential Pareto criterion, will then be derived and their implications described for visitors and the three principal categories of stakeholders: landowners, gateway communities, and the nation at large.
In order to achieve the aforementioned objectives, several economic tools are sensible to use. The demand for recreation for viewing monarch butterflies at the sanctuary can be measured by travel cost and contingent behavior techniques. The results of these estimations can be used to derive measures of consumer welfare. An analysis of economic benefits accruing to landowners due to different entrance fee schemes will illustrate the profit/revenue maximizing outcome from the point of view of landowners. The implications of that pricing scheme for spending on gateway communities can be estimated using an export, or economic, base analysis. This analysis allows us to calculate an income multiplier, which represents a key element for calculating economic impact in local communities. Finally, several management strategies and policy options can be explored under the reallocation of property rights among the three focal stakeholder groups.
Ejidos and the Monarch Butterfly Biosphere Reserve
The Special Biosphere Reserve of the monarch butterfly is located in the vicinity of ten municipalities, but only five ejidos (landowners) surround the buffer zones of the most important sanctuary open to visitors. Five sanctuaries have been established in the Reserve, but only two of the sanctuary areas are open to tourists: ‘El Campanario’ and ‘Sierra Chincua’. Both open sanctuaries are located between the two gateway communities of Angangueo and Ocampo. The ‘Sierra Chincua’ sanctuary was opened to visitors on 10 December 1996. The sanctuary ‘El Campanario’ has been open to tourism since 1980, and it is the primary destination for visitors. The sanctuary ‘El Campanario’ is located in the ejido ‘El Rosario’. Although the Mexican federal government controls the sanctuary, since the sanctuary is on ejido land, the ejiditarios (member of the ejidos) have pre-emptive rights.
Article 27 of Mexico's constitution allows the federal government of the United Mexican States to create agrarian lands for the benefit of its citizens. With its constitutional inception in 1917, Mexico began the process to provide farmers a beneficiary interest in land owned by the government. Entitled under the agrarian law, these government parcels, known as ‘ejidos’, are recorded in the national agrarian registry in Mexico City. The ejiditarios can live, farm, homestead, and construct dwellings on the property. Under the agrarian law previous to the 1992 agrarian reform, the ejiditarios could not sell, lease, subdivide, joint venture, contribute, mortgage or otherwise encumber the property. In essence, they had the use and benefit of the land but they did not have the title to it. In 1992, the Mexican congress passed legislation opening the way for the privatization of communally controlled ejido land. The Monarch Butterfly Sanctuary is somewhat unique as a Biosphere Reserve as it is found on an ejido rather than strictly public lands and is, therefore, subject to potentially different management incentives than are most Biosphere Reserves in Mexico and worldwide.
Modeling visitor expenditures and sensitivity
Tourism demand has commonly been modeled using one of several travel cost revealed preference approaches. The use of the zonal travel cost models for measuring recreation demand has been heavily criticized (Cameron and Travedi, Reference Cameron and Travedi1986; Kirman, Reference Kirman1992; Stoker, Reference Stoker1993). One particular concern is the trip generation function. That is, recreationists are classified according to their zone of origin. In order to have a reasonable sample size, the zones of origins may need to be quite small, in which case travel costs may not behave well in the statistical model. Another concern with zonal models is that some of the independent variables may need to be aggregated across the zones' inhabitants, which may increase the error or decrease the likelihood of finding significant features. Ultimately, this point raises the question about whether a zonal model is compatible with an individual utility-maximization approach (Stoker, Reference Stoker1993).
For example, a problem of using zonal models is that there is no correlation between distance and price since the same distance can be traveled at a great variety of costs. As an example of this problem, the survey conducted in the 2001–2002 season at the Monarch Sanctuary found people traveling from the same site had different spending patterns for the same purpose. Thus, it makes sense to use recently developed techniques for measuring recreation demand.
A conceptual innovation used by Cameron (Reference Cameron1992) in order to avoid the criticisms of the traditional zonal cost method was to develop a combination of the two methods' data (travel cost and contingent valuation methods) in the production of a single new data set, or contingent behavior method. The travel cost data capture current behavior, while the contingent valuation data supply information about the likely behavior under specific scenarios. A model can be developed using the information of a travel cost set and a contingent valuation set by imposing restrictions in the cross-equation parameters without losing consistency in the utility functions specified.
Contingent valuation (CVM) surveys often involve a series of dichotomous responses. For example, questions such as ‘Do you currently visit location X?’, ‘Would you visit if the quality were higher?’, ‘Would you visit if costs were higher?’, are common features of CV surveys. The first response is an actual behavioral response, while the other two are contingent visitation and valuation, respectively (Loomis, Reference Loomis1997). When combining dichotomous choice responses to stated and actual behavior questions, the appropriate model depends on several factors. Alberini et al. (Reference Alberini, Kanninen and Carson1994) noted that a random effects/error component model may be appropriate for analyzing multiple dichotomous-choice responses at different bid levels for the same program. Loomis (Reference Loomis1997) suggests that the random probit model is useful where the same person responds to a series of dichotomous questions regarding current visitation, intended visitation, and WTP. This approach is particularly relevant when the site is visited at most once per year (e.g., the Monarch Butterfly Sanctuary).
Hanneman's (Reference Hanneman1984) formulation of the discrete choice CVM problem can be recast as a visit/no visit decision of current trip costs and higher trip costs under a utility difference framework. Consider first the decision to actually visit the site. Let utility of individual i (Ui) be defined as the sum of deterministic (Vi) and random components (∈i) where ∈i is an independently and identically distributed random variable with zero mean that reflects components of the utility function unobservable to an analyst. If the individual does not make the trip, the deterministic part of utility is Vi 0 (Yi) assuming weak complementarity (Hanneman, Reference Hanneman1989). That is, site quality does not matter when the site is not visited. If we observed the individual at the recreation site, then it must be the case that the utility difference must satisfy

This utility difference is driven by the observable trip choice and hence may be considered revealed preference information. If we add the contingent visitation behavior question at a higher travel cost and obtain a positive response, we can infer that the utility difference must also satisfy

If the response is no, then

The empirical model has four observations per individual. The first observation is the actual travel cost visitation decision. The model specification is represented as follows

where Zi = 1 if the person does visit the site and zero otherwise, TC is the average travel cost to the site with contingent behavior scenarios for travel costs, I represents the average income from visitors, and DC is an index number measuring the perception of people's congestion. DCB is a dummy for stated preference information, and DCB(TC) is another dummy for revealed information. θi is the unobservable characteristic specific to each individual, and ωit is the transitory error across individuals. Finally, welfare measures from visitors are derived from these models as

Data collection for economic valuation of the sanctuary
An entrance fee is the most commonly employed incentive-based policy instrument to restrict or to encourage protected area visitation and manage visitor driven environmental impacts. The ejiditarios charged an entrance fee of 15 pesos ($1.50 US) for the 2000–2001 season per visitor-day. Visitors were surveyed regarding their predicted behavior in the face of a policy that would impose higher entrance fees. Specifically, visitors were asked (in Spanish) whether they would visit if the entrance fee to the sanctuary were $2.50, $5.00, $10.00, or $25 per visitor-day.
An entry fee is charged per visitor-day at the sanctuary and higher entrance fees should imply less visitation and less environmental impact. Depending on whether the relevant portion of the demand for visitation is more or less sensitive to entry fee changes, total revenues derived from higher entry fees may increase (inelastic demand), decrease (elastic) or remain the same (unitary elasticity).
Since the entrance fee is only one part of the revealed value of the sanctuary to the visitor, the travel cost valuation method requires information about other direct and implicit costs of visitation, including time spent and distance traveled as well as questions regarding site quality and demographic characteristics of visitors. Joint models are based on the premise that questions must focus on hypothetical behavior rather than hypothetical prices. Therefore, a question intended to discover contingent behavior was included in the survey. This question asked visitors if they would have visited the sanctuary if their total costs were 25 per cent, 50 per cent, and 100 per cent higher than their estimated current travel cost. A previous question about the total expenses of the visitors' trip was also included.
A total of 450 questionnaires were administered during all weekends in February and March of the year 2002. Less than 5 per cent refused to answer the survey. From the total of 450 questionnaires, 407 were used in the analysis, which contained complete information on the travel cost and contingent behavior questions.
Economic implications for gateway communities: base data and analysis
Use of an export base analysis allows us to incorporate the perspective of businesses in gateway communities to the protected areas, whose objectives are not necessarily considered in either local or national policy decisions regarding protected area management. Local economic activities affected by tourism visits can be divided among commonly understood economic sectors by G-code. All G-codes of economic activities related to industrial, commercial, and service sectors were taken from the 1998 Economic Census of Mexico. Agricultural activities are measured in a different census for a different year in Mexico and they are not included in the study.
Here again, a survey process was implemented to collect primary data for measuring total sales and jobs in local communities. The intention of the survey was to gather specific information about annual sales in local businesses as well as the percentage of the sales due to tourists. Information was also collected about the number of employees year round, and additional employees during the high tourist season. Sixty-five surveys were attempted within the 2001–2002 year with six refusals. A total of 59 surveys were used in the analysis, or a 90 per cent response rate. These estimates are conservative because it was not possible to obtain information on agricultural and construction sectors due to the unavailability of the local people for giving information about these sub-sectors.
Direct economic value of the Monarch Butterfly Biosphere Reserve: travel cost and contingent behavior survey results
Descriptive information
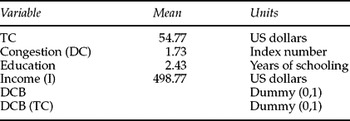
Table 1 describes the variables and units used in the specified models. Survey results indicate that the average actual travel cost per respondent was US$54.77. The absolute travel cost variable was constructed taking into consideration cost per visitor and our contingent behavior scenarios, asking for changing visitation at different ranges of admission fees, from $2.50 up to $25. The relative cost variable includes general travel cost increases other than admission fee changes. Both the absolute and relative cost variables are measured in 2003 US dollars. The congestion variable was initially established as an index from 1 to 10, measuring people's perception of congestion. However, better estimates were obtained by compressing the index into a dichotomous choice variable, where 1 represents a low perception of congestion (up to 4 on a 1 to 10 scale) and 2 represents a moderate to high perception of congestion (from 5 to 10 on the 1 to 10 scale). Education represents the years of schooling of the interviewed people. The income variable was specified in five different ranges of monthly salary. DCB represents a dummy variable coded as 1 for actual response and 0 for intended responses and DCBTC represents a dummy variable coded as 0 for actual response and 1 for intended responses. The average respondent was a 42-year old male who had completed high school and whose average monthly income was US$498.77 (table 1).
Variables and units

Empirical results
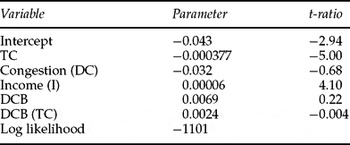
Table 2 presents regression results from the model for estimating visitation to the monarch butterfly sanctuary. All of the signs of the estimated coefficients are as expected and the log likelihood test indicates the significance of the modeled relationship. The own-price coefficient is negative and significant; when entrance fees increase, visitation declines. The income coefficient is positive and significant, reflecting the importance of income in influencing visitors' decisions. No other socio-economic variables were statistically significant in earlier versions of the model. The congestion coefficient is negatively signed as expected, but it was found to be not significantly different from zero, which precludes us from making any inference about this variable. Therefore, there is no measured congestion effect on visitation. The dummy variables for stated and revealed behavior were not statistically significant.
Coefficients estimates for the probit model (entrance fee)

Value to tourists
Hanneman's (1989) formula was used for calculating the consumer surplus. The value of the consumer surplus per person was found at US$82.20 and was derived from the model using the entrance fee variable. Using a 4 per cent discount rate, the net present value of tourism visits to the sanctuary was calculated at US$200 million, representing the non-consumptive use value of the Monarch Butterfly Biosphere Reserve. Since there is little agreement on the correct discount rate for valuing natural resources, a sensitivity analysis of the present value of tourism visits to the sanctuary is presented under different discount rates (table 3).
Estimated present value of the Monarch Butterfly Sanctuary under different discount rates

Value to landowners
If demand is inelastic to changes in entry fees, as has been often hypothesized in the literature, then landowners could obtain more revenue when charging higher entrance fees. Our empirical estimate of the demand function and the own-price elasticity allows us to analyze how the revenue of the site can be maximized from the perspective of the landowners.
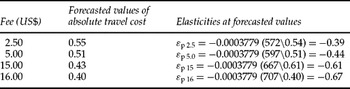
According to the estimated demand function for the entrance fee variable and the current entrance fee of $1.50, the sanctuary is being operated with an own-price elasticity of −0.37, which means that the sanctuary is being managed within the inelastic range of the demand curve where the total revenue is increased with changes in price (table 4). Therefore, the sanctuary's revenue would increase if higher entrance fees were charged.
Forecasted values and predicted elasticities for the absolute cost model under different fees

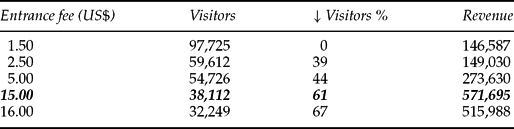
Because the site only captures the entrance fee, and other sources of income were not available, the total revenue of the Reserve is given by: R = (entrance fee) * (visitors). Given the park visitation demand relationship and the calculation of elasticities at each different fee level reported above, the revenue-maximizing fees of the sanctuary can be calculated (table 5).
Monarch Butterfly Sanctuary revenues under different fees
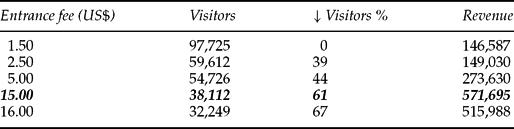
Table 5 shows that landowners obtain $146,587 in annual revenue when they charge an admission fee of $1.50, since the number of visitors for the 2001–2002 season was estimated at 97,725. If landowners charged a $5.00 entrance fee, they would make $273,630 from 54,726 visitors, an almost three-fold increase in revenues from a more than three-fold increase in entrance fees. When charging a $15.00 fee they would make $571,695 per year from visitors, but a $16.00 fee would raise only $515,988 annually, generating less revenue than a $15.00 dollar fee. The variable costs of operating and maintaining the Reserve, borne by the ejiditarios, are also likely increasing in visitation, but are not estimated here. Thus, the optimal fee from the landowners' perspective is $15.00 dollars per person, some ten times the current entry fee.
The national or international perspective
The model also predicts a 61 per cent reduction in visitation would take place at a $15.00 fee. Lower visitation at higher entrance fees generates the greatest benefit to landowners. It is also likely to provide a superior solution from the national perspective, due to lesser human impact on the biological diversity under protection at the sanctuary. From a national and international perspective, where non-use rather than non-consumptive use value is likely to be most pervasive, visitation approaching zero with fees approaching practical infinity are likely to be optimal despite the loss of consumer surplus from lost non-consumptive use value, estimated in the $100 millions that would result from such a policy.
Community economic implications: results from the export base analysis
Descriptive information
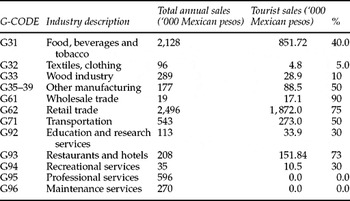
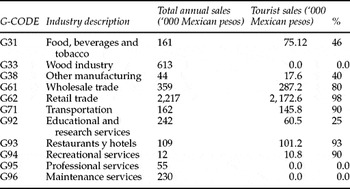
The gateway community is driven to maximize local revenues through the maximization of local visitation. The size of this potential impact is estimated through our efforts at an export base analysis of the two principal gateway communities to the Monarch Butterfly Biosphere Reserve. With the information obtained from the surveys, two sales matrices were constructed (tables 6 and 7).
Matrix of sales in Angangueo, Michoacán

Matrix of sales in Ocampo, Michoacán

From table 6 we conclude that tourist spending in the region has a strong influence in several sub-sectors. In the food, beverages, and tobacco sub-sector, tourism spending represents a reported 40 per cent of the total sales. Tourist spending represents 90 per cent of the wholesale trade sub-sector. Restaurants and hotels, not surprisingly, are also influenced strongly; tourism represents 73 per cent of the spending in this sub-sector.
For the sales matrix in Ocampo (table 7), almost the same pattern of tourist spending as in Angangueo is observed. The food, beverages and tobacco sub-sector represents 46 per cent of the total sales directly attributable to tourists. In the wholesale trade sub-sector, tourism accounts for 80 per cent of the sales. In the transport sub-sector, tourism is responsible for 90 per cent of the spending. This is explained because many of the visitors hire public transportation that goes from Ocampo to the sanctuary. The retail trade and restaurant and hotels sub-sectors could be over-represented since many small shops and food shops along the road from Ocampo to the sanctuary were surveyed and were included in the survey process. Professional and maintenance services did not register direct tourist sales during that season.
The sales multiplier was obtained by dividing the total annual sales by the sales generated from tourist spending reported by local businesses in the survey conducted in the region of study. Total annual sales were 11.18 million pesos and tourism spending was 6.2 million pesos in both communities. The sales multiplier, therefore, was 1.8. That means that for every peso spent by tourists, 0.8 pesos were additionally spent directly into the local communities.
Community economic impacts
While economic impact analysis can get quite complicated, the basic procedure is quite simple and is represented as follows

Using this formula, we calculate the economic impact on local communities under two scenarios of entrance fee to the sanctuary. At the current US$1.50 entrance fee, visitors were estimated at 97,725 and the average expenditure per person was calculated at US$ 26.50. Thus

If landowners imposed the revenue-maximizing fee as admission for visiting the sanctuary (that is, US$15.00), a reduction on visitation of 61 per cent would take place, resulting in a total economic impact of

So, the direct annual loss for local businesses would be around US$3 million, if this increase in admission fee took place.
Implications of pricing schemes across stakeholder groups: Room for negotiation?
Landowners' strategy
Having outlined the principal results from the specified models of this paper, the likely distribution of benefits and losses under different management strategy options can be described. First, we consider if landowners are given standing at the exclusion of all others since they currently hold property rights for the land; that is, the boundaries of analysis lie at the gates to the Reserve. Due to the restriction not to exploit their lands for any other economic use but recreation, landowners seek to maximize revenue from visitor's fees. This objective is reached when landowners impose $15.00 as an entrance fee and total annual revenue increases from $146,587 to $571,695. This strategy reduces total economic welfare from US$8.01 million to US$3.12 million. This option also decreases visitation, affecting local communities as direct tourist spending falls from US$4.6 million to US$1.8 million.
National/international strategy
Alternatively, the boundaries of analysis can be expanded to the national or international scale, providing standing to all Mexicans or to all people of the world in arguing that the Biosphere Reserve is a unique ecological treasure of global importance. The Mexican federal government's strategy is potentially distinct from the local landowners. The federal government may be motivated to enhance environmental preservation of the sanctuary as its responsibility to protect the nation's unique natural heritage on behalf of the citizenry and, potentially, beyond. This objective could be reached by suspending visitation to the sanctuary. The landowners might expect compensation equal to the net present value of expected earnings from tourism visits, or somewhere between $146,587 and $571,695 per year discounted over time. Or, alternatively, equal to the present value of the non-consumptive use value of the ecosystem services they are providing through their stewardship, estimated in this study (US$200 million). In this case, the non-consumptive use value of current and future visitors would be lost as would the economic benefits of tourism to gateway communities, between $1 and $4 million annually, depending on our entry fee assumptions. The global/national size of the non-use values (bequest and/or existence) must be sufficient to outweigh these potential local losses in order to economically justify such a policy. Methods for the winners to compensate the losers could come in the form of direct payments, tax credits, investment incentives, or other locally appropriate approaches.
Alternatively, if the government objective were to provide maximum non-consumptive use value (through visitation), instead of greatest non-use value (through environmental protection), then the management strategy should allow the greatest possible number of visitors, or zero entrance fee, since we found no congestion effect of increased visitation. However, this strategy could be financially unsustainable and the quality of the butterfly habitat could suffer due to overuse and a lack of local incentives for managing the resource toward national objectives. Local communities would benefit substantially (at least in the short term) from this second strategy, however.
Gateway communities' strategy
Assuming that local communities hold the rights to benefit from visitors to the sanctuary over the landowners, the objective of local governments would be to maximize local economic impact and the management strategy should let the current admission fee operate at the same level (or potentially lower, though there may be issues with monitoring and enforcement should the landowner incentives become too weak). Local businesses would benefit by US$4.6 million per year. Under this scheme landowners are the biggest losers by an amount of US$425,108 per year. However, an income-redistribution option for managing the sanctuary would allow local businesses to compensate landowners for stewardship of the sanctuary, leaving landowners no worse off, and local businesses better off than if the landowners established the pricing policy. Local businesses should compensate landowners up to the point at which landowners would have maximized revenue (that is, US$425,108 per year). In this way, landowners would be indifferent to charging a higher fee and not reducing the number of visitors to the sanctuary, therefore maximizing regional welfare. Under this scheme, local businesses' total revenue would decrease by US$425,108 dollars, making about US$4 million, and still benefiting by almost US$2.2 million over the optimal landowner solution.
Conclusions
Natural amenities are increasingly recognized as an important driver of rural economic development, particularly in developing countries. Tourism is the most common vehicle by which local stakeholders can capitalize on their unique natural endowments. Economic development that protects natural amenities provides incentives for local people that are often compatible with broader national or international objectives. However, the optimal protected area entry fee pricing strategy for direct stakeholders may be quite different from that of the broader members of a local gateway community, which also may be quite distinct from national or international priorities for protected area management. Optimal pricing strategies, calculated from the perspectives of these various stakeholders, can help to inform the protected area policy environment and raise opportunities for collaboration on protected area management that result in win-win–win resolutions for all relevant stakeholders.
The relative concentration and distribution of the benefits and costs of the protection of natural resources, the appropriate scale of management of the resource base, and the determination of just whose values count are essential to effective and equitable management of the globe's scarce and unique ecosystems. We hope that our illustration of these important policy issues as applied to the Monarch Butterfly Biosphere Reserve in Michoacan, Mexico provides insights into the types of analytical tools that should be employed and the varieties of potential solutions that might exist in this area of inquiry.