Introduction
The past two millennia are of particular interest to the understanding of the Earth’s climate system because, apart from the human-induced rise in greenhouse gas concentrations, the boundary conditions of the climate system have not changed dramatically. During this period, the Northern Hemisphere (NH) experienced three main climate anomalies, namely the Medieval Climate Anomaly (MCA; 1050–650 yr bp), the Little Ice Age (LIA; 500–100 yr bp) and the recent temperature increase (Twentieth-Century Warming, TCW) (Mann et al. Reference Mann, Zhang, Rutherford, Bradley, Hughes, Shindell, Ammann, Faluvegi and Ni2009). In the Southern Hemisphere (SH) high latitudes, these climate anomalies appear to be either absent from palaeoclimate records or their relative intensities and timings are regionally inconsistent (Verleyen et al. Reference Verleyen, Hodgson and Sabbe2011).
In the NH, the MCA started with a rate of temperature increase which exceeded that of the modern late-20th century (1961–90 AD) in some regions, but remained below the most recent global temperature rise (from 1990 AD onwards; Mann et al. Reference Mann, Zhang, Rutherford, Bradley, Hughes, Shindell, Ammann, Faluvegi and Ni2009). It has been observed in palaeoclimate reconstructions from the North Atlantic region, Southern Greenland, the Eurasian Arctic and parts of North America (Mann et al. Reference Mann, Zhang, Rutherford, Bradley, Hughes, Shindell, Ammann, Faluvegi and Ni2009). Evidence for an event coeval with the MCA in Antarctica, or even in the SH, seems to be rather limited and far from unequivocal (Bentley et al. Reference Bentley, Hodgson, Smith, Cofaigh, Domack, Larter, Roberts, Brachfeld, Leventer, Hjort, Hillenbrand and Evans2009, Verleyen et al. Reference Verleyen, Hodgson and Sabbe2011). In the Antarctic Peninsula (AP), there is some evidence of a warm event coeval with the MCA, but these reconstructions are mostly limited to marine records (Bentley et al. Reference Bentley, Hodgson, Smith, Cofaigh, Domack, Larter, Roberts, Brachfeld, Leventer, Hjort, Hillenbrand and Evans2009 and references therein). In most continental ice cores, there is no evidence for a well-defined temperature rise during or following the NH MCA (Masson et al. Reference Masson, Vimeux, Jouzel, Morgan, Delmotte, Ciais, Hammer, Johnsen, Lipenkov, Mosley-Thompson, Petit, Steig, Stievenard and Vaikmae2000). In addition, there is no or only limited palaeoenvironmental evidence along the Antarctic coastline for an event equivalent to the NH MCA (Bentley et al. Reference Bentley, Hodgson, Smith, Cofaigh, Domack, Larter, Roberts, Brachfeld, Leventer, Hjort, Hillenbrand and Evans2009, Verleyen et al. Reference Verleyen, Hodgson and Sabbe2011).
The LIA is observed in almost all NH records and culminated between 500 and 100 yr bp when NH summer temperatures dropped significantly below the mean of the second half of the 20th century (Matthews & Briffa Reference Matthews and Briffa2005). As with the MCA, the LIA is regarded as a NH phenomenon with only limited evidence in certain places in Antarctica for a climate anomaly with similar features and timing to the LIA (Bertler et al. Reference Bertler, Mayewski and Carter2011, Verleyen et al. Reference Verleyen, Hodgson and Sabbe2011). A mild ‘LIA’ event has been reported from the Vestfold Hills, as a period of lower evaporation between c. 200 and 150 yr bp (Roberts et al. Reference Roberts, van Ommen, McMinn, Morgan and Roberts2001). In the McMurdo Dry Valleys, the Wilson Piedmont Glacier was more extensive in some areas between 400 and 100 yr bp than today (Hall & Denton Reference Hall and Denton2002). However, the magnitude of this change was less than the glacier advances recorded in the NH during the LIA (Hall & Denton Reference Hall and Denton2002), and no other glacier advances have been reported simultaneously across the Antarctic continent at the same time. Lake sediment (e.g. Roberts et al. Reference Roberts, van Ommen, McMinn, Morgan and Roberts2001), ice core and marine sediment core evidence (e.g. Bertler et al. Reference Bertler, Mayewski and Carter2011) are thus equivocal, as recorded cold palaeoclimate anomalies of the last 2000 years appear to be rather mild, short in duration and occurred only at a local scale.
Globally, the TCW is most pronounced in the Arctic and the AP. On the AP, temperatures have increased at >0.1°C per decade during the past 50 years, whereas in the Arctic a modest temperature increase near the start of the 20th century has been followed by a sharp increase over the past 30 years (Turner et al. Reference Turner, Overland and Walsh2007). In East Antarctica (EA), the climate shows complex temperature patterns, with cooling in some regions, but the continent-wide average is slightly positive (Steig et al. Reference Steig, Schneider, Rutherford, Mann, Comiso and Shindell2009). Trends associated with Continental Antarctica are less clear although a precipitation anomaly is present in the Law Dome ice core near the coast of Wilkes Land, with snow accumulation during the past few decades exceeding the natural variability of the past 750 years (van Ommen & Morgan Reference Van Ommen and Morgan2010). On the AP, recent studies have revealed that a gradual warming interrupted Neoglacial cooling c. 600 years ago (Sterken et al. Reference Sterken, Roberts, Hodgson, Vyverman, Balbo, Sabbe, Moreton and Verleyen2012) followed by accelerated warming in the last 100 years (Mulvaney et al. Reference Mulvaney, Abram, Hindmarsh, Arrowsmith, Fleet, Triest, Sime, Alemany and Foord2012).
It is still not certain whether the observed differences in the timing and amplitude of climate anomalies between hemispheres during the past two millennia are real or rather related to the overall lack of comparable well-dated palaeoclimate reconstructions from the SH (Mann et al. Reference Mann, Zhang, Rutherford, Bradley, Hughes, Shindell, Ammann, Faluvegi and Ni2009, Verleyen et al. Reference Verleyen, Hodgson and Sabbe2011). Antarctic ice cores from the continental plateau are often unable to fully resolve climates of the past two millennia, being better suited to track past atmospheric composition and temperature variability over glacial-interglacial cycles. Coastal ice cores are often more sensitive to small-scale climate anomalies, but are relatively rare because coastal ice sheets are dynamic. A valuable alternative is lake sediment records.
In EA, lake sediments record quantitative changes in the moisture balance which can be reconstructed using diatom-based inference models. The moisture balance, and therefore salinity and specific conductance, in East Antarctic lakes is a complex balance between inputs of meltwater, from multi-year snow banks and glaciers in the catchment area, and precipitation and outputs including evaporation and sublimation. The latter are affected by both increasing temperature and wind strength. Conversely, decreased wind speeds and lower temperatures lead to lower evaporation and sublimation rates, positively affecting the moisture balance (Verleyen et al. Reference Verleyen, Hodgson and Gibson2012). However, this relationship is complicated in regions where (katabatic) winds transport snow from the interior to coastal regions. Primary production in polar lakes is, in turn, a function of surface air temperatures. Increased air temperatures generally result in higher water temperatures and an increase in the number of ice-free days (Quayle et al. Reference Quayle, Peck, Peat, Ellis-Evans and Harrigan2002). Furthermore, soil development on newly exposed ice-free ground in lake catchments can result in increased nutrient export leading to a further increase in lake primary production. These multiple changes have been shown to be amplified in Maritime Antarctic lakes and have resulted in an extreme ecological response to the recent temperature changes (Quayle et al. Reference Quayle, Peck, Peat, Ellis-Evans and Harrigan2002). Proxy data for lake primary production, such as organic matter accumulation and fossil pigment concentrations, have been shown to be sensitive tools for reconstructing past temperature variability, and have provided detailed records of the MCA and the LIA in, for instance, the Canadian Arctic (MacDonald et al. Reference MacDonald, Porinchu, Rolland, Kremenetsky and Kaufman2009). In Antarctica, proxies for lake primary production have enabled the detection of millennial-scale Holocene warm periods (Verleyen et al. Reference Verleyen, Hodgson and Sabbe2011, Sterken et al. Reference Sterken, Roberts, Hodgson, Vyverman, Balbo, Sabbe, Moreton and Verleyen2012) and short-term temperature excursions during the Early Holocene but, so far, there is limited evidence for the MCA and LIA in lake sediment cores from the Antarctic margin (Verleyen et al. Reference Verleyen, Hodgson and Sabbe2011).
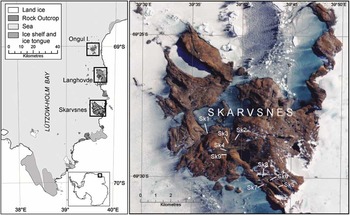
The aim of this study was to investigate palaeoenvironmental changes occurring during the past two millennia in Skarvsnes, Lützow Holm Bay (EA, 69°00'S, 39°35'E; Fig. 1) using a high-resolution, well-dated palaeolimnological approach. Fluxes of fossil pigments and total carbon (TC) were used to reconstruct temperature-related changes in lake primary production. This was combined with the flux of absolute diatom counts to infer past diatom production. Past changes in the moisture balance were quantitatively reconstructed using a newly developed diatom-based transfer function.
Map of Lützow Holm Bay, East Antarctica with boxes showing the four study areas (the East and West Ongul Islands, Langhovde and Skarvsnes) along with a detailed satellite image of Skarvsnes, the main study region. Study lakes on Skarvsnes (on which the transfer function is based) are indicated with codes Sk1–9. Mago Ike is indicated as Sk1. For a detailed map of the Ongul Islands and Langhovde (with indication of the study lakes included in the transfer function), see Figs S1 and S2 in the supplemental material. Inset shows the position of the Lützow Holm Bay region relative to the Antarctic continent.

Site description
Several ice-free areas and islands are present along Syowa Coast in Lützow Holm Bay. These include the East and West Ongul Islands (Fig. S1 found at http://dx.doi.org/10.1017/S0954102014000029) and the two main peninsulas Langhovde (Fig. S2 found at http://dx.doi.org/10.1017/S0954102014000029) and Skarvsnes (Fig. 1). Lakes range from hypersaline and dry lake beds in low-altitude areas in Skarvsnes and on the eastern part of Langhovde to freshwater lakes in other areas. Low-altitude lakes have been isolated from the ocean following postglacial isostatic uplift and subsequently became hypersaline due to evaporation or diluted as a result of meltwater inputs from snow banks in their catchment areas. These lakes, called isolation basins, contain both marine and lacustrine sediments.
Mago Ike (Sk1; 69°28.450'S, 39°36.674'E) is an isolation basin situated at 1.5 m above sea level (a.s.l.) on Kizahasi Beach in Skarvsnes (Fig. 1) and is seasonally ice-free. The lake is characterized by a maximum depth of 5.8 m, a pH of 8.95 and a specific conductance of 0.48 mS cm-1. During the time of sampling, the water column was completely mixed and the lake was fed by a small meltwater stream. Mago Ike was specifically chosen for this study on account of its high sediment accumulation rate during the past two millennia, which enabled the transition from marine–lacustrine sediments and post-isolation palaeoenvironmental changes to be studied at a higher temporal resolution than is available in other small Antarctic lakes (e.g. Sterken et al. Reference Sterken, Roberts, Hodgson, Vyverman, Balbo, Sabbe, Moreton and Verleyen2012).
Methods
Transfer function and calibration dataset
Surface sediments and water chemistry data were collected from 27 lakes in Lützow Holm Bay. Surface sediments generally consisted of benthic microbial mats were collected from the deepest part of the lakes with a UWITEC gravity corer and from the littoral zones by manual sampling. Samples were stored at -20°C. Limnological data included measurements of water column specific conductance, pH, oxidation-reduction potential (ORP) and lake water depth. These parameters were measured using a YSI 600 water-quality meter. Water samples for analyses of major ions (Mg, K, Ca, Fe, Na, SO4, Al), nutrients (silicate, NH4-N, total nitrogen (TN), NO3-N, PO4-P), total organic carbon (TOC) and dissolved organic carbon (DOC) were collected in acid-washed Nalgene bottles and frozen prior to analysis. Methods are described in more detail in Verleyen et al. (Reference Verleyen, Hodgson and Gibson2012).
Sediment coring, lithostratigraphic, geophysical and geochemical analysis
Fieldwork took place in January 2007. Sediments were collected at the deepest part of the lake using a UWITEC gravity corer for the upper 57 cm of the sediments and a Livingstone corer for the deeper sediments, with an overlap of at least 20 cm between four successive drives to a total of 254 cm.
Before splitting, the Livingstone cores were scanned with a GEOTEK multi-sensor core logger measuring gamma ray density (GRD) and magnetic susceptibility (MS) in 0.2-cm steps. MS was used to correlate different overlapping sections of the sediment cores, whereas GRD was used as a parameter to calculate the mass accumulation rate (MAR) (Street-Perrot et al. Reference Street-Perrot, Barker, Swain, Ficken, Wooller, Olago and Huang2007). Macroscopic descriptions included sediment texture (qualitative grain size, sorting, etc.) and structure (laminations, grading, etc.).
Concentrations of TC and TN were carried out using a Flash 2000 Organic Elemental Analyzer (subsamples taken at maximum 8-cm intervals). These measurements were carried out by dry combustion at high temperature (left furnace: 950°C, right furnace: 840°C) followed by separation and detection of the gaseous products. The data were processed using the Eager Xperience software. Reproducibility and reliability of the analyses were tested using standards of sulphanilamide.
Chronology
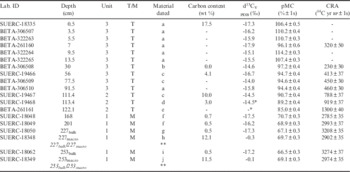
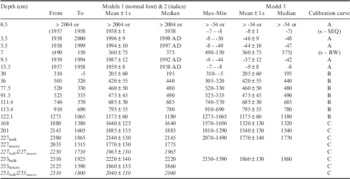
Nineteen samples from the Mago Ike sediment cores were dated using AMS 14C by the UK Natural Environment Research Council (NERC) Radiocarbon Laboratory and/or the Beta Analytic Radiocarbon Dating Laboratory. The results are reported as conventional radiocarbon years bp with two-sigma (2σ) standard deviation errors. Absolute percentage of modern carbon (pMC) data were corrected according to 13C/12C isotopic ratios from measured pMC, where a ‘modern’ pMC value is defined as 100% (AD 1950) and the ‘present-day’ pMC value is defined as 107.5% (AD 2010). Calibration of 14C ages was carried out in OXCAL v4.1 (Bronk Ramsey Reference Bronk Ramsey2009). The pMC values from samples at 0.5, 3.5, 5.5, 9.5 and 13.5 cm depth, which returned a ‘modern’ radiocarbon age, were calibrated in CALIBomb using the SH1 compilation of SH datasets (Hua & Barbetti Reference Hua and Barbetti2004; Calibration curve A; Tables I & II). Freshwater samples were calibrated using the SHCal04 14C SH atmosphere dataset (McCormac et al. Reference McCormac, Hogg, Blackwell, Buck, Higham and Reimer2004; Calibration curve B; Tables I & II). In the marine-influenced sections of the core, the Marine09 calibration curve (100% marine) was used (Reimer et al. Reference Reimer, Baillie and Bard2009). The Antarctic marine reservoir effect for this locality was constrained by using a ΔR value of 720±100 years based on 1120±100 years minus the global marine reservoir of 400 years (Calibration curve C; Tables I & II). This value is recommended as a regional correction for the Lützow Holm Bay region; the error of ±100 years was calculated from original radiocarbon data in Yoshida & Moriwaki (Reference Yoshida and Moriwaki1979).
Radiocarbon dates, publication codes and the nature of material dated for the Mago Ike sediment cores.

Carbon content is not routinely measured by BETA analytical.
T=terrestrial, M=marine, CRA=Conventional Radiocarbon Age. *=estimated value due to small sample, **=R_combine (Model run 2).
Material dated: a=medium laminated microbial mat, b=fine-medium laminated mat transition, c=finely laminated microbial mat, d=grey clay with fine sand, some organics, e=grey clay with fine sand, f=bulk grey clay with fine sand, g=sandy-silt bulk matrix, no macros, h=sponge spicules, i=sandy-clay bulk matrix, no macros, j=carbonate shells. Unit 1-2-3 refers to the lithological units in Fig. 3a.
Calibrated age ranges and the inferred date using the age–depth model of the Mago Ike sediment cores.

Data within parentheses are considered least probable or as outliers. Out-of-sequence data, marked as x-SEQ, or ages where reworking of sediment appears likely, marked as x-RW, were both excluded from the age-depth model.
Model runs 1–3: for detailed information, see the Supplemental material (Protocol S1).
All marine ages were calibrated using a ∆R value of 720±100 (Yoshida & Moriwaki Reference Yoshida and Moriwaki1979) (Fig. 5). Models 1, 2 and 3: OXCAL 95.4% calibration data.
Radiocarbon age data are reported as conventional radiocarbon years bp (14C yr bp)±1σ, and as 2σ (95.4%) calibrated age ranges, mean±1σ and median calibrated ages (cal yr bp relative to AD 1950) (Tables I & II). Calibrated ages are rounded to the nearest 5 years where measured radiocarbon age errors were less than ±50 14C years, and to the nearest 10 years where measured radiocarbon age errors were greater than ±50 14C years.
The most probable age–depth sequence of calibrated ages was determined in OXCAL v4.1 using 95.4%, 2σ error calibration data and a standard Poisson distribution Bayesian age–depth deposition model, which was applied separately to terrestrial and marine sediments (flexibility, k, was set to 100, and Markov chain Monte Carlo set to 1000 k). Interpolated ages in the text were rounded to the nearest 10 years and derived from the ‘best-fit’ age of the CLAM v2.1 age–depth models (Blaauw Reference Blaauw2010).
Diatom analysis
Quantitative diatom analysis followed standard methods (Sabbe et al. Reference Sabbe, Verleyen, Hodgson, Vanhoutte and Vyverman2003). Diatoms were counted using a Zeiss Axiophot light microscope under oil immersion with at least 400 valves (> 2/3 intact or unmistakably the middle part of the raphe system) counted in each sample, except for 13 samples in the surface dataset in which diatom concentrations were too low. Ninety-seven samples were analysed from the core (subsamples taken at a maximum 4-cm interval) and 68 surface samples were analysed from regional lakes and ponds to develop the calibration dataset. Where possible, more than one sample was taken to ensure that the different habitats (e.g. littoral vs deep water) were included in the dataset. Chaetoceros resting spores were counted in addition to the diatom valves. Taxonomic identification was mainly based on Sabbe et al. (Reference Sabbe, Verleyen, Hodgson, Vanhoutte and Vyverman2003) for the lacustrine diatoms and Cremer et al. (Reference Cremer, Roberts, McMinn, Gore and Melles2003) for the marine diatoms.
Fossil pigment analysis
Fossil pigments were extracted and analysed following standard methods (Sterken et al. Reference Sterken, Roberts, Hodgson, Vyverman, Balbo, Sabbe, Moreton and Verleyen2012). The high performance liquid chromatography (HPLC) components included an Agilent 1100 HPLC, pump, auto-sampler, diode-array detector and Agilent Eclipse XDB-C8 column. The method uses three solvents, methanol (80%), ammonium acetate (20%) and acetonitrile (90%), and ethyl acetate. The system was calibrated using authentic pigment standards and compounds isolated from reference cultures (Jeffrey et al. Reference Jeffrey, Mantoura and Bjornland1997). The identification of the pigments was based on Jeffrey et al. (Reference Jeffrey, Mantoura and Bjornland1997) and pigments of unknown affinity were assigned as derivatives of the pigment with which they showed the closest match based on the retention time and the absorption spectrum, or as ‘unknown’. Concentrations of individual pigments in the samples were calculated using the response factors of standard pigments. The response factors of unknown carotenoids, dinoxanthin and neoxanthin were calculated as the mean of the response factors of the other carotenoids, and for unknown mixtures of carotenoids and chlorophylls (chls) a mean response factor for all carotenoids and chls was used. The abundance of individual pigments is reported as percentage of the total concentration of chls or carotenoids.
Statistical techniques and the construction of the diatom-based transfer function
Species and environmental variables (except pH) were log-(x+1)transformed, to reduce the influence of dominant taxa and to reduce or remove skewness in the data. Ordinations were performed using CANOCO 4.5 for Windows (ter Braak & Šmilauer Reference Ter Braak and Šmilauer2002). Before statistical analysis, detection of outliers/unusual samples was accomplished by running a correspondence analysis (CA) of the species data. A detrended correspondence analysis (DCA) was used to determine the length of gradient and identify whether unimodal or linear models were suitable for further analyses (ter Braak & Šmilauer Reference Ter Braak and Šmilauer2002). The length of gradient equalled 5.0. Therefore, the unimodal method canonical correspondence analysis (CCA) was used to select those variables explaining the largest amount of variation in the species data (ter Braak & Šmilauer Reference Ter Braak and Šmilauer2002). The significance (P≤0.05) of each variable was assessed with forward selection using an unrestricted Monte Carlo permutation test involving 999 permutations. Subsequently, a CCA was performed with the environmental variable of interest as the only explanatory variable in order to calculate the ratio of the eigenvalue for the first (constrained) axis to the eigenvalue for the second (unconstrained) axis, which is an indication of the importance of that variable in explaining the variance in the species data (ter Braak & Šmilauer Reference Ter Braak and Šmilauer2002).
Weighted averaging-partial least squares (WA-PLS) was applied using the C2 software package (Juggins Reference Juggins2003). This was chosen over simple weighted averaging (WA) as it generally outperforms WA over long compositional gradients (3–22 standard deviation units), and when there is a secondary gradient the root-mean-square error of prediction (RMSEP) may be reduced by 50% (Birks Reference Birks1998). The final model was selected based on the lowest prediction error (RMSEP) and highest jack-knifed r². To be considered as ‘useful’, a component should give a reduction in RMSEP of more than 5% compared to WA (Birks Reference Birks1998). Sample-specific errors of reconstructed specific conductance were calculated using C2 with 999 bootstrapped cycles.
Proxy data which are potentially influenced by variable sedimentation rates (SRs) and large changes in the proportion of organic, siliciclastic and biogenic components are represented as fluxes (Street-Perrot et al. Reference Street-Perrot, Barker, Swain, Ficken, Wooller, Olago and Huang2007). The dry mass accumulation rate (MAR) (g cm-² yr-1) was calculated as the multiplication of the dry bulk density (DBD; g cm-3) and the SR (cm yr-1). Gamma ray density (GRD) was converted to DBD using a dry weight percentage of the samples. The flux of each proxy was calculated as the multiplication of the MAR and the concentration by weight at that depth. The diatom and pigment stratigraphy was divided into zones using a constrained cluster analysis (CONISS) and plotted using Tilia and Tilia Graph View (TGView Version 2.0.2., Illinois State Museum, Springfield, IL, USA). The significance of the zones was assessed using a broken-stick model in the Rioja package for R (Juggins 2012, http://cran.r-project.org/package=rioja, accessed April 2012).
Results
Transfer function development
Initially, a total of 41 diatom species, including marine diatoms, were identified in the calibration dataset. Occasional marine diatoms and taxa occurring with a maximum relative abundance of 0.5% in at least one sample or occurring in less than five samples were removed.
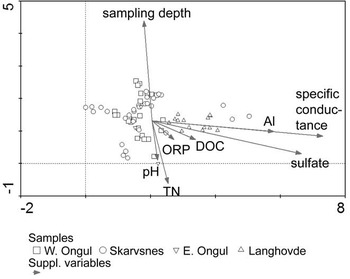
All samples were retained in the analysis, as no outliers were detected in a DCA of the species data (Fig. 2). A CCA with forward selection and Monte Carlo permutation tests revealed that the variance in diatom composition was significantly (P≤0.05) explained by sulfate, sampling depth, pH, aluminium, TN, DOC, ORP and specific conductance. The most significant variable was specific conductance (Fig. 2). The ratio of the eigenvalue of the first axis (0.475) to the eigenvalue of the second axis (0.388) indicated that this was a suitable variable for creating a transfer function.
Detrended correspondence analysis (DCA) scatter plot of the Lützow Holm Bay samples, with the significant variables plotted as supplementary variables.

The specific conductance transfer function was constructed without two littoral samples from lake La7 (Langhovde) whose WA residuals exceeded the standard deviation of specific conductance. The WA-PLS with two components showed an increase in apparent r² of 6.77%, an increase in jack-knifed r² of 6.76% and a decrease in RMSEP of 13.5% compared with the WA-PLS model with one component, hence this model was selected. Jack-knifed r² and apparent r² were both high in the transfer function, 0.85 and 0.90, respectively, and RMSEP was relatively low (0.10 mS cm-1) (see Table S1 for a comparison with data obtained from the literature found at http://dx.doi.org/10.1017/S0954102014000029). The WA optima and tolerances of the lacustrine species for specific conductance are summarized in Table S2 (http://dx.doi.org/10.1017/S0954102014000029). The residual trend of the retained samples used for the WA-PLS2 transfer function, indicates that values below c. 1 and between c. 3.5 and 5 mS cm-1 are slightly overestimated, whereas values between c. 1 and 3.5 mS cm-1 are somewhat underestimated (Fig. S3 http://dx.doi.org/10.1017/S0954102014000029). A plot of the observed vs predicted specific conductance for all samples indicated a close agreement between inferred and measured specific conductance with no apparent outliers (Fig. S4 http://dx.doi.org/10.1017/S0954102014000029).
Lithostratigraphic, geophysical and geochemical analysis
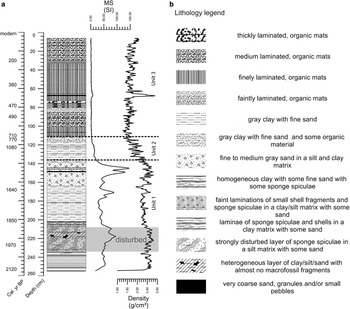
The Livingstone sediment cores indicated three main stratigraphic units based on their geophysical and sedimentological characteristics (Fig. 3). For the upper 6 cm of the sediments, retrieved with the UWITEC gravity corer, no geophysical or geochemical data are available.
a. Diagram of the lithology, magnetic susceptibility (MS; SI) and Gamma Ray Density (density; GRD) (g cm-3) of the Mago Ike Livingstone sediment cores. Calibrated radiocarbon dates are indicated. b. Legend of the lithology of the Mago Ike sediment cores.

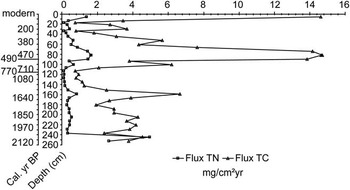
Unit 1 (254–136 cm, c. 2120–1420 cal yr bp) consisted of mud (silty clay) laminations with some sand, marine shell fragments and sponge spicules. Between 237–208 cm, there were no laminations and the sediment comprised a heterogeneous and possibly disturbed mixture of sand, clay and silt with only broken sponge spicules and very rare shell fragments. Between 202–136 cm, there were a number of discrete levels of coarse sand or small pebbles. This unit had the highest GRD and MS compared to the rest of the core with notable peaks linked to the presence of coarse sand laminations or small pebbles. The TN flux remained relatively low in this unit, except for two higher values in the bottom of the core (at 253 and 245 cm) (Fig. 4). The TC flux fluctuated and was relatively high, probably related to the presence of shell fragments.
Total carbon (TC) and total nitrogen (TN) fluxes (mg cm-² yr-1) throughout the Mago Ike sediment cores.

Unit 2 (136–111 cm, c. 1420–710 cal yr bp) was characterized by a strong decrease in MS and a steady decrease in GRD. Lacustrine microbial-mat remains occured for the first time in this unit. The TC and TN fluxes were both very low throughout this unit.
Unit 3 (111–6 cm, c. 710 cal yr bp–recent) consisted of laminated lacustrine microbial mats with varying degrees of lamina thickness. GRD and MS were at their lowest in the core with the exception of c. 66 cm depth, where a pebble was present. The TC and TN fluxes were relatively high and variable with peaks between 90–75 cm and at 6 cm.
Radiometric dating
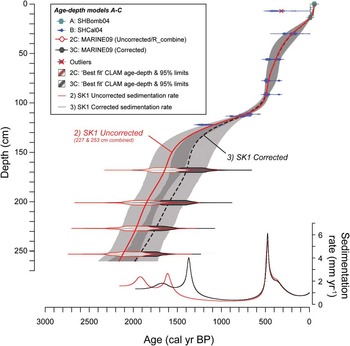
Radiocarbon dating of the cores showed that the ages, with the exception of BETA-261160 at 7 cm depth, were in stratigraphic order (Tables I & II, Fig. 5). Since classical and Bayesian age–depth modelling approaches produced broadly similar results, for simplicity, we present the classical age–depth modelling results undertaken in CLAM v2.1 (Fig. 5, Tables I & II). Furthermore, CLAM also enabled us to produce continuous whole core marine-terrestrial age–depth sequence models.
Stratigraphic age–depth plot undertaken in CLAM v2.1 (Blaauw Reference Blaauw2010). Calibrated radiocarbon ages and Models 2 and 3 are as defined in Tables I & II and Protocol S1 in the supplemental material. Data not included in the age–depth model are indicated by a red cross.

Calibration of ‘post-bomb’ samples, traditionally defined as ‘modern’, suggests that the top 13 cm of sediments were either deposited very rapidly between 1957 and 1959 AD, or deposition occurred more gradually between 1957 and 2005 AD (Tables I & II). We considered the second scenario to be more probable, firstly because the sediment sequence is repeatedly laminated, possibly representing several years of ice-covered/ice-free conditions, and secondly because both the sequence of calibrated and modelled modern-surface ages from 1957 to 2004 AD are broadly in line with modern-day sedimentation rates and adequately reproduce the date the cores were extracted. Sample BETA-261160 at 7 cm was excluded from the age–depth model as this was the uppermost sample taken from the Livingstone core, which meant that it was potentially water-washed during extraction, and could have been contaminated by older carbon. Moreover, this sample had a radiocarbon age that was non-sequential, and bracketed by ‘modern’ radiocarbon ages which were obtained from a UWITEC surface core that had been sectioned at 0.5-cm intervals, bagged and frozen in the field. Therefore, the UWITEC samples were better suited for radiocarbon dating of this section of the core compared with the surface of the Livingstone core (sample BETA-261160).
The other terrestrial dates were all retained, producing a straightforward age profile that increases with depth without age-reversals. Radiocarbon ages from the marine-influenced section of the core showed a potential offset between bulk and macrofossil ages. Measured radiocarbon ages of the two macrofossil samples were both c. 300 14C years younger than radiocarbon ages of the bulk sediment matrix from which they were extracted. To test the effect of this offset on the timing of isolation, we undertook three calibration model runs in OXCAL and in CLAM (Tables I & II, Fig. 5): Model 1 (based on ‘as-measured’ radiocarbon data), Model 2 (bulk and macrofossil ‘as-measured’ radiocarbon ages combined into a single calibrated age range) and Model 3 (an additional 300±100 14C years offset applied to all bulk sediment ‘as-measured’ radiocarbon age data before calibration). Details on this analysis can be found in the supplemental material found at http://dx.doi.org/10.1017/S0954102014000029 (Protocol S1).
A bulk-macrofossil age offset could not be entirely ruled out. Therefore, we retained both Model 2 as a maximum possible age–depth sequence and Model 3 as a minimum possible age–depth sequence (Fig. 5). Model 3 could be considered more reliable, but it would require significantly more data from the region to unequivocally determine the existence and scale of the bulk sediment age offset. Therefore, in this paper, Model 2 median calibrated ages were used.
Microfossil analysis and reconstructed lake-water specific conductance
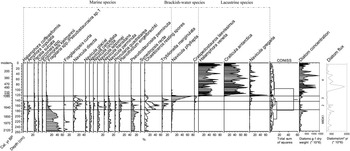
A total of 112 diatom taxa were identified, of which 25 taxa are plotted in Fig. 6. These taxa occurred with a minimum abundance of 2% in at least three samples. All lacustrine species are currently present in the extant diatom flora of the Lützow Holm Bay region. Based on a broken-stick and CONISS cluster analysis, four distinct diatom zones were identified, namely MIDA1–4 (Mago Ike Diatom Analysis).
Diatom stratigraphy of the Mago Ike sediments. Zoning (MIDA1–4; Mago Ike Diatom Analysis) is based on a broken-stick and CONISS cluster analysis. Species data are expressed as relative abundances. Sea ice indicator species are indicated with cross-hatching lines and open water indicator species with left-diagonal lines. Marine, brackish-water and lacustrine diatom species are indicated with brackets. The species listed as lacustrine are also present in the diatom flora of the Lützow Holm Bay region. Diatom concentration is expressed as the number of diatoms g-1 dry weight. Diatom flux is expressed in the number of valves cm-²yr-1. Calibrated radiocarbon dates are indicated.

Zone MIDA1 (254–175 cm, c. 2120–1680 cal yr bp) is dominated by marine taxa, including unknown Fragilaria species (Fig. S5 http://dx.doi.org/10.1017/S0954102014000029), Chaetoceros resting spores, Pseudostaurosira perminuta (Grunow) Sabbe & Wyverman and Navicula directa (Wm. Smith) Ralfs. The most abundant species is an unknown Fragilaria species. Fragilariopsis curta (van Heurck) Hustedt, N. directa and Chaetoceros resting spores all occur at relatively low densities. The diatom concentration (number of diatoms g-1 dry weight) is relatively low throughout this zone, with a peak at 180.6 cm. The diatom flux is similarly relatively low and variable.
Zone MIDA2 (175–143 cm, c. 1680–1500 cal yr bp) is composed of the same marine community as the previous zone, but N. directa, Chaetoceros resting spores and Tryblionella marginulata (Grunow) Mann increase in abundance while the concentration of the unknown Fragilaria species decreases. Chaetoceros resting spores become the most dominant species of the diatom community. The diatom concentration remains relatively low. The diatom flux is comparable to the previous zone.
Zone MIDA3 (143–123 cm, c. 1500–1120 cal yr bp) is characterized by a decrease in the relative abundance and the subsequent disappearance of marine taxa, and an increase in the brackish-water species N. phyllepta Kützing, which becomes the most abundant species. The diatom concentration slightly increases near the end of this zone, while the diatom flux is very low throughout.
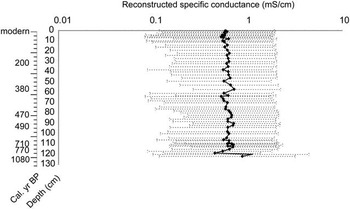
Zone MIDA4 (123–0 cm, c. 1120 cal yr bp; recent) is dominated by fluctuating abundances of freshwater taxa, including Halamphora veneta (Kützing) Levkov, Craticula antarctica Van de Vijver & Sabbe and occasional spikes of N. gregaria Donkin. Diatom concentration and flux rapidly increase at the beginning of this zone (from c. 92 cm), and remain relatively high and very variable. Three zones with a higher diatom concentration occur between 92.5 and 82.5 cm (with peaks at 92.5, 88.5 and 82.5 cm), between 46.3 and 43.6 cm, and to a lesser extent in the recent sediments from 4 cm upwards. The diatom flux is high between 92 and 84 cm and then shows an overall decrease towards the upper part of the core. Diatom-inferred specific conductance in the lacustrine section of the core reaches a maximum value of 1.13 mS cm-1 at 120 cm after which it rapidly decreases to 0.45 mS cm-1 at 119 cm (Fig. 7). Above 119 cm, specific conductance ranges between 0.52 and 0.72 mS cm-1. The fluctuations of inferred specific conductance are small and fall within the error of the model.
Diatom-based inferred specific conductance throughout the lacustrine sediments of Mago Ike (mS cm-1). Uncertainty ranges are the sample-specific errors.

Fossil pigment analysis
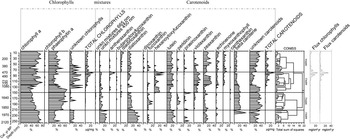
Based on the broken-stick model and CONISS cluster analysis, four distinct pigment zones were identified, namely MIPA1–4 (Mago Ike Pigment Analysis) (Fig. 8). Only pigments occurring in a minimum of three samples were plotted on the figure, meaning that chl c2 and neoxanthin were not included.
Stratigraphy of fossil pigments in the Mago Ike sediments. Zoning (MIPA1–4; Mago Ike Pigment Analysis) is based on a broken-stick and CONISS cluster analysis. The abundance of individual pigments is reported as percentages to total chlorophylls (chls) or carotenoids (%). Total chls and total carotenoids are reported in µg mg-1 and plotted with an exaggeration factor of 20 to increase the visibility of the graph. The flux of carotenoids and chls is expressed in mg cm-² yr-1. Calibrated radiocarbon dates are indicated.

Zone MIPA1 (254–210 cm, c. 2120–1890 cal yr bp) is characterized by very low concentrations and fluxes of total carotenoids and total chls. Chlorophyll a and phaeophytin a (a chl a derivative) dominate the chls, whereas the most abundant carotenoids are diatoxanthin (present in diatoms, dinophytes and chrysophytes), lutein (green algae and red seaweeds) and unknown carotenoids.
Zone MIPA2 (210–149 cm, c. 1890–1550 cal yr bp) is characterized by a decrease in chl a and an increase in phaeophytin a. The most abundant carotenoids are β-carotene (green algae, chromophyte algae and some phototrophic bacteria), which appears at 221 cm, and unknown carotenoids. Diatoxanthin and lutein decrease in abundance. Total chls and total carotenoids, and their fluxes, remain low.
Zone MIPA3 (149–74 cm, c. 1550–450 cal yr bp) is characterized by relatively high total chl and total carotenoid concentrations. The chl and carotenoid fluxes are relatively low in the beginning of this zone, then become relatively high from 105 cm upwards. Peaks in fluxes are observed between 90 and 71 cm. Phaeophytin a decreases in abundance whereas the concentration of chl a increases. Unknown chls also increase in abundance. The most abundant carotenoids are lutein, violaxanthin (green algae, euglenophytes and brown seaweeds), zeaxanthin (cyanobacteria, green algae and possibly mosses), β-carotene and unknown carotenoids. Zeaxanthin reaches high abundances between 122 and 90 cm.
Zone MIPA4 (74–6 cm, c. 450 cal yr bp–recent) is characterized by relatively lower concentrations of total chls and total carotenoids. Chlorophyll and carotenoid fluxes are relatively low, but show slightly increasing values from 14 cm upwards. Chlorophyll a and phaeophytin a remain the most abundant chls. Unknown carotenoids are the most abundant carotenoids, followed by lutein, zeaxanthin and diatoxanthin.
Discussion
Ecological changes and lake evolution
The distinct stratigraphic zones in the cores based on diatom (Fig. 6), pigment (Fig. 8) and lithostratigraphic (Fig. 3) analyses correspond to a shift from marine to lacustrine conditions with a clear transition zone in between. These changes are related to lake formation as a result of isostatic uplift of the basin and coincident relative sea level fall. These zones provide information on coastal oceanographic conditions in Skarvsnes between c. 2120 and 1500 cal yr bp (253–143 cm), and on limnological conditions from c. 1500 cal yr bp onwards (143–0 cm).
Changes in the proxies of the marine zone most probably reflect ecological changes associated with isostatic uplift, such as a decreasing sea water depth and related differences in sea-ice dynamics and light regimes, rather than climate variability. Conditions were characterized by seasonal open water and sea ice coverage during the majority of the year, which is similar to those observed today and in coastal marine sediment cores elsewhere in EA during this time interval (Verleyen et al. Reference Verleyen, Hodgson and Sabbe2011). The most striking changes in the marine diatom record are the increase in Chaetoceros resting spores and N. directa, and the decrease in an unknown Fragilaria species (Figs 6 and S5). The increase in Chaetoceros resting spores points to seasonal stratification of the water column (Crosta et al. Reference Crosta, Sturm, Armand and Pichon2004) due to the melting of sea ice and/or the inflow of meltwater from the nearby terrestrial environment. The ecological significance of the decrease in Fragilaria sp. during the marine stage is not entirely clear as no detailed auto-ecological data are available for this taxon. However, it is possible that it is an open water marine species, declining when the site became isolated from the ocean. This is further supported by a decrease in the abundance of Paralia sulcata (Ehrenberg) Cleve, a tychoplanktonic species. Furthermore, along with the benthic taxon N. directa, other benthic species start to increase, such as Halamphora coffeaeformis (Agardh) Levkov and Amphora copulata (Kützing) Schoeman & Archibald. This might indicate a higher availability of light due to the uplift of the basin from the ocean and hence decreasing water depth, an important structuring factor in Antarctic benthic diatom communities (Cunningham & McMinn Reference Cunningham and McMinn2004).
All proxies analysed point to the isolation of Mago Ike from the ocean between c. 1500 and 1120 cal yr bp (143–123 cm). The rapid increase in total chls and total carotenoids indicates a quick colonization of the lake by cyanobacteria, diatoms and green algae following isolation (Fig. 8). The microbial turnover following lake isolation is similar to patterns observed from other Antarctic regions, such as the Larsemann Hills (Verleyen et al. Reference Verleyen, Hodgson, Sabbe, Vanhoutte and Vyverman2004), and is characterized by an increase in brackish-water diatom species (N. phyllepta, Craspedostauros laevissimus (West & West) Sabbe and T. marginulata; Fig. 6), a rapid increase in cyanobacteria-derived pigments, the appearance of diatom- and green algae-related pigments (Fig. 8), and the subsequent establishment of a freshwater diatom community (Fig. 6). A sudden decrease in MS and GRD (Fig. 3) coincided with these changes and points to changes in sediment composition, provenance and delivery. While the sediments in the marine part of the cores probably contained ice-rafted debris from icebergs, which might have originated elsewhere, the lacustrine sediments are composed of wind-blown material and local debris from the catchment area transported by the inflow stream.
After the early succession phase (c. 1120 cal yr bp; 123 cm), well-developed microbial mats colonized the lake and dominated primary production as indicated by the pigment composition, which is composed of marker pigments of cyanobacteria (zeaxanthin, echinenone and myxoxanthophyll; Fig. 8). Green algae (lutein, violaxanthin, β-carotene and antheraxanthin) and diatoms (fucoxanthin and diatoxanthin) probably occurred as co-dominants. The higher nitrogen values (Fig. 4) are also consistent with the relatively high abundance of nitrogen-fixing cyanobacteria, which commonly occur in East Antarctic lakes (Verleyen et al. Reference Verleyen, Sabbe, Hodgson, Grubisic, Taton, Cousin, Wilmotte, De Wever, van der Gucht and Vyverman2010) and are largely absent in the Southern Ocean. Specific conductance only slightly fluctuated during the lacustrine phase and was highest just after lake isolation when lake water remained temporarily enriched with marine salts derived from the Southern Ocean (Fig. 7). This points to a relatively rapid transition from brackish-water to freshwater conditions as a result of the positive moisture balance. After this transition phase, changes in the moisture balance are relatively small. This is probably related to the relatively dilute nature of Mago Ike; shallow, brackish to saline lakes respond quickly to changes in the precipitation–evaporation/sublimation balance (Verleyen et al. Reference Verleyen, Hodgson and Sabbe2011), while freshwater lakes are less sensitive.
Palaeoclimate reconstruction
Changes in proxies for primary production in the lacustrine sediments such as an increased flux of total chls, total carotenoids (90–71 cm) (Fig. 8), diatoms (92–84 cm) (Fig. 6), and TC and TN (90–75 cm) (Fig. 4) can be attributed to a slightly warmer period in Skarvsnes between c. 490 and 440 cal yr bp (92–71 cm). This warmer period has only a very short duration and does not coincide with the NH MCA time interval (1050–650 yr bp). Therefore, an MCA event in Skarvsnes appears to be absent, which is similar to a range of other proxy records in the SH (Bentley et al. Reference Bentley, Hodgson, Smith, Cofaigh, Domack, Larter, Roberts, Brachfeld, Leventer, Hjort, Hillenbrand and Evans2009). On the AP, records of an event only broadly similar in timing to the MCA, and of a shorter duration, are mainly restricted to marine records (Bentley et al. Reference Bentley, Hodgson, Smith, Cofaigh, Domack, Larter, Roberts, Brachfeld, Leventer, Hjort, Hillenbrand and Evans2009). These include, for instance, a higher MS between 700 and 500 cal yr bp interpreted as a signal of warmer surface water temperatures in eastern Bransfield Bay. However, this was only one of several events, all of comparable amplitude and duration, suggesting intrinsically unstable climatic conditions during the Late-Holocene in Bransfield Bay (Khim et al. Reference Khim, Yoon, Kang and Bahk2002). Exposed terrestrial material indicated that the ice edge was at, or even behind, its present position at Anvers Island between 970–700 yr bp. This appears to have had a regional expression in the western and northern AP (Hall et al. Reference Hall, Koffman and Denton2010 and references therein). However, in most continental ice cores, there is no clear evidence for a well-defined temperature rise corresponding to the NH MCA (Masson et al. Reference Masson, Vimeux, Jouzel, Morgan, Delmotte, Ciais, Hammer, Johnsen, Lipenkov, Mosley-Thompson, Petit, Steig, Stievenard and Vaikmae2000), although some records show a warm period which immediately post-dates the NH MCA. For example the deuterium excess record from the Law Dome ice core exhibits higher values corresponding to warmer conditions, between 650–450 yr bp, followed by a decreasing trend until 100 yr bp (Masson et al. Reference Masson, Vimeux, Jouzel, Morgan, Delmotte, Ciais, Hammer, Johnsen, Lipenkov, Mosley-Thompson, Petit, Steig, Stievenard and Vaikmae2000). This was confirmed by model simulations where the surface temperature in the Southern Ocean appears to be higher between 650–500 yr bp by at least 0.17°C compared to the mean over the period 1000–200 yr bp in all simulations (Goosse et al. Reference Goosse, Braida, Crosta, Mairesse, Masson-Delmotte, Mathiot, Neukom, Oerter, Philippon, Renssen, Stenni, van Ommen and Verleyen2012). The proposed lag mechanism between the NH and SH records involves the formation of slightly warmer North Atlantic deep water when slightly milder conditions prevailed at the NH high-latitudes, followed by a centennial transport and upwelling in the Southern Ocean. A newer version of the LOVECLIM model weakens this result, and this lagged warmer period is less clear in the new simulations. This is attributed to the smaller solar forcing applied, which led to weaker temperature changes in the North Atlantic (Goosse et al. Reference Goosse, Braida, Crosta, Mairesse, Masson-Delmotte, Mathiot, Neukom, Oerter, Philippon, Renssen, Stenni, van Ommen and Verleyen2012). Moreover, this warm event appeared to be model-dependent as it was not found using the MPI-RSM-E2 model (Goosse et al. Reference Goosse, Braida, Crosta, Mairesse, Masson-Delmotte, Mathiot, Neukom, Oerter, Philippon, Renssen, Stenni, van Ommen and Verleyen2012), so its occurrence must be questioned.
A lagged warm period between 810–663 yr bp (i.e. only corresponding to the last 150 years of the MCA) has been interpreted from a McMurdo Dry Valleys ice core and has been linked to warmer summers accompanied by increased snow accumulation and higher sea surface temperatures in the Ross Sea region (Bertler et al. Reference Bertler, Mayewski and Carter2011). A synthesis of 11 ice cores revealed relatively warmer conditions before 1000 yr bp, but not during the past 1000 years when cooler conditions prevailed (PAGES 2k Consortium 2013). Lake sediment evidence for an MCA event in Antarctica is similarly either absent or unconvincing. Studies from both EA (e.g. Pup Lagoon in the Larsemann Hills (Verleyen et al. Reference Verleyen, Hodgson and Sabbe2011)) and the AP (e.g. Lake Beak 1 on Beak Island (Sterken et al. Reference Sterken, Roberts, Hodgson, Vyverman, Balbo, Sabbe, Moreton and Verleyen2012)) do not show any evidence for an MCA event. Only a small number of studies include evidence of warmer and wetter conditions during the past 1000 years. For example, wetter conditions were inferred in Lake Fryxell (Taylor Valley) after 1000 BP, indicating an increased meltwater supply to the lake, attributed to an increase in the number of snowless days and/or higher summer temperatures (Wagner et al. Reference Wagner, Melles, Doran, Kenig, Forman, Pierau and Allen2006). Collectively, the absence of a warm period coinciding with the NH MCA signal is thus in agreement with other East Antarctic studies (Verleyen et al. Reference Verleyen, Hodgson and Sabbe2011, Goosse et al. Reference Goosse, Braida, Crosta, Mairesse, Masson-Delmotte, Mathiot, Neukom, Oerter, Philippon, Renssen, Stenni, van Ommen and Verleyen2012).
Fluxes of fossil pigments (Fig. 8), TC, TN (Fig. 4) and diatoms (Fig. 6) show an overall decrease between c. 440 cal yr bp and the recent sediments (71–14 cm) and a slight increase again between 14 cm and the surface. These relatively low concentrations are comparable to those recorded in the period before 490–440 cal yr bp, and the therefore clear, well-defined LIA cooling observed between 500–100 cal yr bp in the NH, appears to be absent in this part of Antarctica. This is consistent with the absence of an LIA analogue in Antarctica (Verleyen et al. Reference Verleyen, Hodgson and Sabbe2011). Overall, there is no consistent palaeoclimate signal between records, even when these are from nearby localities. An ice core record from the Victoria Valley lower glacier (McMurdo Dry Valleys) indicates colder summers and decreased snow accumulation between 662–143 yr bp (Bertler et al. Reference Bertler, Mayewski and Carter2011). However, in a summary of 11 ice cores overall colder conditions were inferred from 1000 yr bp onwards compared with the preceding 1000 years, but an LIA could not be observed (PAGES 2k Consortium 2013). Furthermore, in agreement with our records, most lake sediment evidence from both EA (Verleyen et al. Reference Verleyen, Hodgson and Sabbe2011) and the AP (e.g. Sterken et al. Reference Sterken, Roberts, Hodgson, Vyverman, Balbo, Sabbe, Moreton and Verleyen2012) indicate the absence of an LIA in Antarctica. One exception is a mild, short cold event recorded in the Vestfold Hills, as evidenced by a period of lower evaporation between c. 200–150 yr bp (Roberts et al. Reference Roberts, van Ommen, McMinn, Morgan and Roberts2001). However, this cannot be regarded as an LIA analogue due to the very short duration of this event and its relatively recent occurrence. The same applies for the marine environment, as in the vast majority of the records there is no analogue for the LIA or the chronologies are too poorly resolved for a direct comparison. Only in the MS record from Bransfield Basin was an excursion suggested to co-occur with the LIA (Khim et al. Reference Khim, Yoon, Kang and Bahk2002). However, this was just one of a series of climatic events, all comparable in duration and amplitude. It is thus becoming evident that a number of studies have probably imposed NH climate anomalies onto Antarctic palaeoclimate records or that regional differences dominate over Antarctic-wide trends in temperature variability.
In the recent sediments, increased chl, carotenoid (Fig. 8), TC and TN fluxes (Fig. 4) were observed, although smaller than the peaks evidenced between c. 490–440 cal yr bp. This might be related to taphonomical issues rather than an increase in lake primary production. In summary, there is no direct evidence for a response of the lake to recent TCW. This is consistent with weather station data from the region and generally elsewhere in EA, which revealed no significant trend in temperature during the past decennia (Sato & Hirasawa Reference Sato and Hirasawa2007, Steig et al. Reference Steig, Schneider, Rutherford, Mann, Comiso and Shindell2009). This observation clearly contrasts with records from the AP, where there is clear evidence for an effect of the recent TCW trend on lacustrine ecosystems (Quayle et al. Reference Quayle, Peck, Peat, Ellis-Evans and Harrigan2002, Sterken et al. Reference Sterken, Roberts, Hodgson, Vyverman, Balbo, Sabbe, Moreton and Verleyen2012).
Conclusions
A shift from marine to lacustrine conditions with a clear transition zone in between is inferred from all the proxies analysed in Mago Ike, Skarvsnes, Lützow Holm Bay, EA. Between c. 2120–1500 cal yr bp, seasonally open water conditions occurred in this region of the Southern Ocean, comparable to other East Antarctic coastal regions during that time window and the present-day situation. The lake became isolated from the ocean around c. 1500 cal yr bp due to isostatic uplift, and freshwater conditions occurred from c. 1120 cal yr bp onwards. From c. 1120 cal yr BP proxies in the lake sediment record are considered highly sensitive to regional temperature changes.
Our multi-proxy evidence suggests that both the MCA and LIA are absent in Skarvsnes. Only a brief period of slightly increased primary production occurred between c. 490–440 cal yr bp, clearly post-dating the NH MCA and shorter in duration. It is therefore becoming clear that a number of studies have force-fitted NH climate anomalies onto Antarctic palaeoclimate events, as few of the latter are consistent in timing, duration and magnitude with their NH counterparts. There is no evidence of a recent climate anomaly in our record consistent with the TCW, which is in agreement with instrumental observations which have revealed only a relatively modest warming in EA.
Acknowledgements
This research was funded by the Belspo project ‘Holocene climate variability and ecosystem change in coastal East and Maritime Antarctica’ (HOLANT) and the British Antarctic Survey ‘Chemistry and Past Climate programme’. IT was funded by the Institute for the Promotion of Innovation by Science and Technology in Flanders. EV and KH were funded by the Fund for Scientific Research Flanders. Dirk Vangansbeke is thanked for the help with the CN analyses, Ilse Daveloose for the pigment analyses, Renaat Dasseville for the SEM-photos, Peter Fretwell for making the maps, Bart van de Vijver for his help with the diatom identification, Ann-Eline Debeer for making the slides, and Bart Aelterman for his help with the CLAM software. The Department of Geography, Durham University is thanked for access to sediment core analytical facilities. Two anonymous reviewers are thanked for their valuable comments on an earlier version of the paper. This work contributed to the PAGES Antarctica2k programme.