INTRODUCTION
Cropping systems contain a diverse multi-species weed flora including several species that cross-breed with and/or are descended from crops. Most prominent among the latter in Europe is weed beet, an annual weedy form of the genus Beta, i.e. Beta vulgaris ssp. vulgaris (Hornsey & Arnold Reference Hornsey and Arnold1979), the progeny of accidentally flowering sugar beet crop plants (B. vulgaris). These kinds of weeds are often very harmful because their emergence and reproduction cycle are very similar to that of their parent crop. Moreover, they cannot be managed with herbicides because of their genetic proximity to the crop. To avoid the generation of new weed beet populations, breeders have been attempting to produce new sugar beet varieties that are less prone to accidental bolting (see http://www.itbfr.org, verified 14 Jan 2011). However, existing weed beet populations will persist and must be managed in subsequent beet crops with non-chemical cultural techniques, e.g. stale seed bed techniques, inter-row hoeing and manual weeding.
Previous studies developed a model to synthesize and quantify the effects of cropping systems on weed beet dynamics (GENESYS-BEET; Sester et al. Reference Sester, Dürr, Darmency and Colbach2007, Reference Sester, Tricault, Darmency and Colbach2008) and this model was used to propose guidelines for weed management, based on sensitivity analyses to cultural techniques and species life-traits (Tricault et al. Reference Tricault, Darmency and Colbach2009; Colbach et al. Reference Colbach, Darmency and Tricault2010). However, the advice based on these prospective simulations was developed for a crop-progeny weed and is not necessarily valid for a ‘real’, crop-independent weed. Indeed, weed beet can emerge from the soil seed bank and infest fields long after any sugar beet has been grown, i.e. independently of any interaction with sugar beet, with an intrinsic demography life-cycle, exactly as other weed species. Moreover, weed beet is part of a more diverse weed flora that does not necessarily react to cultural control in the same way as weed beet does.
To account for species and farming practices diversity, models such as the GENESYS-Beet model are valuable tools. Numerous weed dynamics models have been developed in the past (Colbach & Debaeke Reference Colbach and Debaeke1998; Holst et al. Reference Holst, Rasmussen and Bastiaans2007). Two distinct approaches have been used: either simple model structures simulating several weed species or complex model structures focusing on cropping system×environment interactions but limited to a single, albeit frequent and harmful species. The latter approach was the basis for the GENESYS-BEET model used in previous weed beet studies (Sester et al. Reference Sester, Dürr, Darmency and Colbach2007, Reference Sester, Tricault, Darmency and Colbach2008), with an additional model for seed bank replenishment from crop seed production.
The objective of the present paper was two-fold: to assess (1) how dynamics of a crop-independent weed beet differ from the behaviour of a crop-dependent type and (2) how dynamics of a crop-independent weed are affected by changes in the life-traits characterizing the weed species. To reach this goal, the sub-model for seed bank replenishment via crop seed production was deleted from the GENESYS-BEET model. The simplified model was then used for a global sensitivity analysis, based on Monte Carlo simulations where all life-trait parameters were made to vary randomly and simultaneously (Saltelli et al. Reference Saltelli, Chan and Scott2000), while input variables were chosen deterministically to create three contrasting cropping systems with different risk levels of weed infestation by varying the frequency of sugar beet crops, sowing and harvest dates, characteristics and frequencies of tillage and weeding operations, etc. This procedure has already been used in a previous GENESYS sensitivity analysis (Colbach et al. Reference Colbach, Darmency and Tricault2010) as well as with another cropping system×environment model (Colbach et al. Reference Colbach, Molinari and Clermont-Dauphin2004) and is useful for ranking parameters in interaction with cropping systems. The results of the new sensitivity analysis are compared with the previous analysis including crop seed production (Colbach et al. Reference Colbach, Darmency and Tricault2010) to evaluate the contribution of crop dependency. Final plant densities, the relationships between successive life stages and the crucial stage of emergence (Forcella et al. Reference Forcella, Benech-Arnold, Sanchez and Ghersa2000) were all analysed in order to better understand the effect of species life-traits on dynamics. Life-traits are considered here in a very broad sense, as any parameter describing seed or plant behaviour, and thus comprise even those parameters measured on populations rather than on individuals as in the definition by Violle et al. (Reference Violle, Navas, Vile, Kazakou, Fortunel, Hummel and Garnier2007).
MATERIALS AND METHODS
The simulation model GENESYS-BEET
The GENESYS-BEET model was initially developed to assess accidental gene flow from sugar beet crops to weed beet populations, via pollen flow and seed production by accidentally bolting crop plants (i.e. growing a reproductive stem with flowers and viable seeds) or regrowth from unharvested sugar beet roots (‘groundkeepers’). In the present study, these processes were disregarded and only weed population dynamics at the field scale were simulated. The model was described in detail by Sester et al. (Reference Sester, Dürr, Darmency and Colbach2007, Reference Sester, Tricault, Darmency and Colbach2008) and only the main points will be presented in the current paper. At the field scale, the model uses the following input variables:
1. The crop grown in each cropping year on the simulated field, choosing between sugar beet, winter cereals, spring cereals, maize, pea and three types of non-arable cropping (defined subsequently in the present paper as set aside), i.e. sown (with an annual forage species such as clover), unsown (1-year fallow) and perennial (usually a pasture).
2. The cultural techniques for each crop, i.e. tillage, sowing and harvesting dates, herbicides, mechanical weeding and cutting. Manual bolter-weeding (hand-pulling) is only applied in sugar beet.
3. The daily weather data over the simulated period consisting of rainfall, mean, minimum and maximum temperatures as well as mean soil temperatures and water potential in successive 10-mm-thick soil layers from 0 to 300 mm depth (the maximum depth of tillage operations).
4. The initial seed bank of the field, with seed densities in each soil layer, distinguishing the seeds shed during the latest seed rain (hence ‘young’ seeds) from older seeds as well as seeds previously exposed to light while imbibed from unexposed seeds because they show different dormancy patterns (Sester et al. Reference Sester, Dürr, Darmency and Colbach2006).
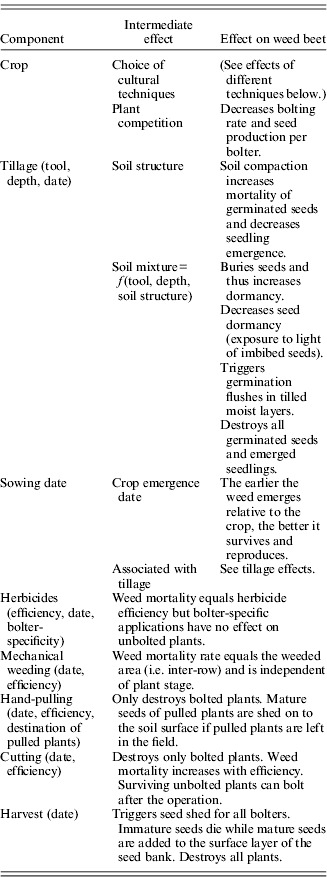
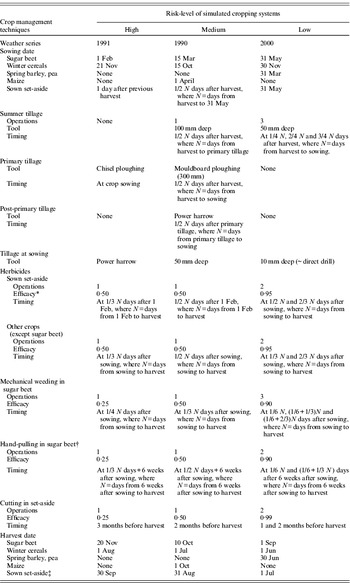
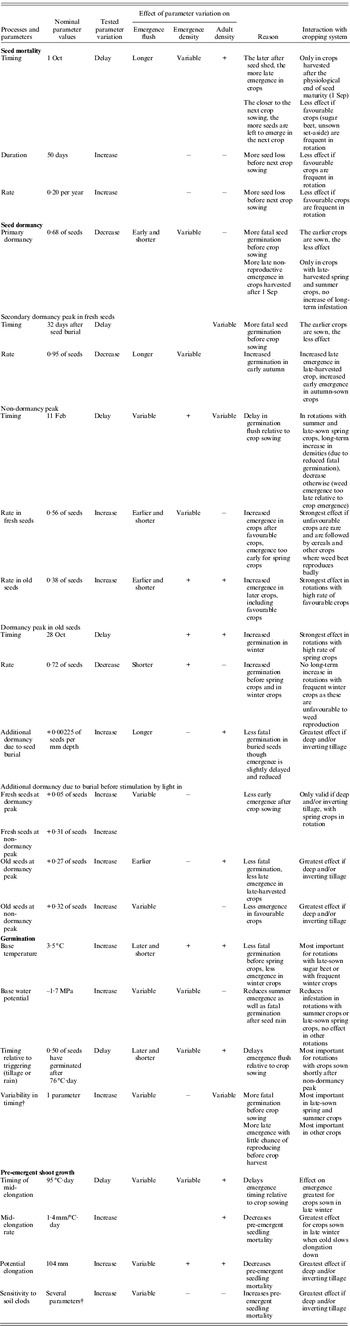
The model operates on a daily time-step with life-stage densities (number of individuals/m2) as state variables. Transitions between successive life-stages (viable, dormant and germinating seeds, seedlings, bolters, flowering and seed producing plants and their flower and seed production) are driven by air temperature, soil temperature and moisture, with parameter values specific to the different types of seeds (dormant v. non-dormant, young v. old). Management techniques may both trigger developmental processes (e.g. germination flush after tillage) and change the vertical distribution of seeds in the soil (e.g. mouldboard ploughing) or cause mortality at stage-specific rates. Weed beet survival and reproduction are reduced by plant competition at crop-specific rates. The effects of cropping system components are summarized in Table 1, while Table 2 lists possible crop management techniques and their range of variation. The life-traits and their nominal values are given in Tables 3 and 4.
Effects of the cropping system components on the stages of the weed beet life cycle simulated in the GENESYS model (based on Sester et al. Reference Sester, Dürr, Darmency and Colbach2007, Reference Sester, Tricault, Darmency and Colbach2008)

Crop management techniques used in the three contrasting cropping systems (adapted from Colbach et al. Reference Colbach, Darmency and Tricault2010)

Weather data was taken from Dijon, France (47°20′N, 5°2′E).
* Efficacy indicates the proportion of plants destroyed by the operation.
† All hand-pulled bolters are left in the field to maximize risks.
‡ ‘Harvest’ of set-aside corresponds to its destruction by a last cutting or by a tillage operation.
Effect of weed traits on weed emergence and density, its reasons and possible interactions with cropping system components. Nominal values of GENESYS parameters and synthesis of the effects of their variations on weed beet emergence in sugar beet crops and long-term bolter dynamics (results of linear regressions (2) and (4) analysing emergence dates and densities as well as bolter densities as a function of life-traits in each cropping system). See supplementary information for further details (available at http://journals.cambridge.org/ags)


*Variability in timing is described by the shape parameter of the Weibull equation for cumulated germination with time.
† Parameters include the proportional seedling mortality due to obstruction by soil clods in fine earth, its increase with soil compaction, and the increase in sensitivity with burial depth in fine earth, intermediate and compacted soil structures.
* Bolting and flowering progress are described by the date (in thermal time since emergence) of the first bolted or flowering plant, the time necessary to reach 0·50 of bolted or flowering plants, and a shape parameters correlated to the variability in bolting or flowering dates in the weed population. In addition, flowering progress on individual plants is described by the time (in thermal time since flowering started on the plan) necessary for 0·50 flowers to open and the variability in opening time (shape parameter of Weibull equation). See supplementary information for further details (available at http://journals.cambridge.org/ags).
† Actual bolting and flowering rates=maximum rate/(1+a·densityb) with density=weed beets/m2 at rosette stage. See supplementary information for further details.
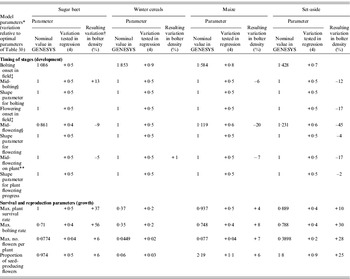
Nominal values of the parameters controlling crop–weed competition in GENESYS and effects of their variations on bolter densities (results of linear regression (4) analysing bolter densities as a function of life-traits) in the case of the medium-risk cropping system

* Competition parameters are multiplicative factors applied to optimal weed parameters (without crop–weed competition) to obtain actual values in different crops. For instance, the nominal bolting rate in sugar beet is 0·934×0·71=0·6631.
† Relative variations are calculated from regression coefficients δip of Eqn (4) as 10δ·v, where v is the tested parameter variation. Empty cases indicate non-significant coefficients.
‡ Date (in thermal time since emergence) when the first weed beet bolts (flowers) in the field.
§ Date (in thermal time since emergence) when 0·5 of the weed plants have bolted (flowered).
** Date (in thermal time since flowering onset on the plant) when 0·50 of the flowers have opened on the plant.
The main output variables are, for each simulated year, the number of emerged weed beet seedlings, bolters and seed bank left after harvest.
Analysis steps
Weed emergence timing and success in crops is crucial because these processes determine the subsequent probabilities for reproductive success, in interaction with weed management decisions (Forcella et al. Reference Forcella, Benech-Arnold, Sanchez and Ghersa2000). Hence, the first step focused on emergence in the crop most favourable to weed beet, i.e. sugar beet. The simulation plan combined three factors: (1) the initial seed bank present at simulation onset (seven levels; see later for the description of the levels), (2) the management of sugar beet (three levels) and (3) the model parameter set (with 20 000 levels), all leading to a total of 420 000 simulations. Simulations lasted 1 year, from the harvest of the previous crop to the harvest of the simulated sugar beet. The analysed output variables were the cumulated seedling emergence from crop sowing to harvest as well as the dates when 0·10, 0·50 and 0·90, respectively, of total emergence were reached.
The second step analysed the long-term behaviour of the weed populations and was identical to the analysis carried out for the crop-dependent weed beet (Colbach et al. Reference Colbach, Darmency and Tricault2010). The simulation plan combined two factors: (1) the cropping system (three levels) and (2) the model parameter set (with 50 000 levels), leading to a total of 150 000 simulations. Simulations lasted for 20 years, which exceeds the minimum time advised by Tricault et al. (Reference Tricault, Darmency and Colbach2009) to eliminate the effect of the initial seed bank characteristics. The last year was always cultivated with a sugar beet; plant, bolter and seed bank densities present at the harvest of the last year were kept for analysis.
Description of simulation factors
Initial seed bank
In step 1, the seven different seed banks consisted of a total of 100 seeds/m2. The first seed bank comprised of only young seeds (originating from the last seed rain) located on the soil surface. The next three seed banks were a 50–50 mixture of young and old seeds (from older seed rains); the former were always located on soil surface, while the latter were located either in the top 100 mm of the soil, distributed throughout the 300 mm soil considered in the model or buried in the bottom 100 mm, respectively. The last three seed banks consisted of only old seeds, again with either a top, homogenous or bottom vertical profile, mimicking seed distributions generated by different tillage strategies. In step 2, the initial seed bank consisted of 1000 young seeds/m2 on the soil surface, which is approximately the seed production of a single weed beet plant in sugar beet (Sester et al. Reference Sester, Delanoy, Colbach and Darmency2004).
Management strategies and cropping systems
The annual sugar beet management strategies of step 1 and the multi-year cropping systems of step 2 were determined from the sensitivity analysis of GENESYS-Beet to cropping system variables (Tricault et al. Reference Tricault, Darmency and Colbach2009), aiming at different levels of weed emergence and bolters. They have already been used successfully for a sensitivity analysis of gene flow to life-traits (Colbach et al. Reference Colbach, Darmency and Tricault2010). The first cropping system (hence ‘high-risk’ system) was based on a crop succession with a large-row spring crop every 2 years, alternating with winter cereals and sown set-aside. To simplify, sugar beet was used for the large-row crop though potato would have had the same effect on weed beet emergence, growth and development in the simulations. The second rotation (‘medium-risk’) was a 6-year rotation of sugar beet/winter wheat/maize/winter wheat/sown set-aside/winter wheat. In the last rotation (‘low-risk’), sugar beet was only grown during the first 2 years to favour the creation of an initial weed beet population, and then again 18 years later during the last simulated year. In between, there was a 4-year rotation of spring pea/winter wheat/spring barley/winter wheat, except that at the 3rd and the 15th year, a sown set-aside replaced the planned pea crop. The crop management techniques depended on crops and cropping systems (Table 2). For instance, sowing dates were early in the high-risk system, to increase weed beet emergence after crop sowing, while the opposite strategy was used to the low-risk system. The values chosen for the high- and low-risk systems were often quite extreme in order to obtain contrasting cropping conditions so that shifts in life-trait influences were easier to detect. In addition, these extreme cases permit assessment of inadequate farming practices, badly timed operations because of weather or work overload, etc.
Model parameter sets
Tables 3 and 4 list the model parameters for weed beet life-traits and their nominal values in GENESYS-BEET. For each of the parameter sets (20 000 in step 1 and 50 000 in step 2) in the simulations, all 140 parameter values were chosen randomly, with uniform probability. For dates, the range was from nominal value −30 days to nominal value +30 days. For all other parameters the range was from 0·5×nominal value to 1·5×nominal value. Various logical constraints had to be respected. For instance, mid-bolting had to be later than bolting onset, flowering onset later than bolting onset, etc. In addition, seed dormancy had to be higher in darkness v. light or seedling mortality higher in compact v. fine-earth structure. Moreover, proportions were always in the range of 0·00–1·00. If the value chosen from (0·5×nominal value; 1·5×nominal value) exceeded 1·00, the value 1·00 was used for the simulation.
Statistical analyses
Emergence dates and densities of the annual simulations of step 1 were analysed with a linear regression:

where φ i were regression coefficients, cropping system and initial seed bank were qualitative variables with three and seven levels, respectively. Only significant explanative variables were kept in the final model, using PROC REG of SAS (SAS Institute Inc. 1999–2000) with the backwards option and P=0·05. The backwards option results in the stepwise elimination of terms not significant at the chosen P-level from the main effects model including all terms. Output variables were also analysed separately for each cropping system to focus on interactions between cropping systems and weed traits, using the previous regression without the cropping system factor:

The output variables of the multi-year simulations of step (2) were analysed as follows:

Output variable20 was the density of total plants, bolters or viable seed bank found at the crop (sugar beet) harvest of the 20th year of the simulation. φ i were regression coefficients and cropping system was a qualitative variable with three levels. Again, only explanative variables significant at P=0·05 were kept in the final model. The output variables were also analysed separately for each cropping system (cs) to focus on interactions between cropping systems and weed traits:

In another series of analyses, an additional explanative variable, previous stage20, was added to regression (3) to identify the traits influencing the relationships between key life-stages:

For each analysed output variable, previous stage20 was the density of the previous life-stage. When analysing plants20, previous stage20 was the density of seed bank of year 19; when analysing bolters20, previous stage20 was plants20; when analysing seed bank20, previous stage20 was bolters20. This analysis quantifies the correlation between successive stages and the residual weight of the cropping system and life-traits. In all regressions, densities were log 10-transformed before analysis.
RESULTS
Simulated densities
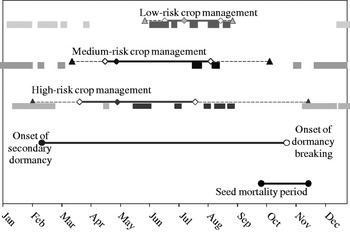
The annual step 1 simulations show that weed emergence was earliest and longest in the sugar beet with high-risk management and latest and shortest in the case of low-risk management (Fig. 1). The high-risk management was the only situation where the crop was sown before the appearance of secondary dormancy. The later the crop sowing, the lower the probability of encountering temperatures too low for germination and the higher the probability of encountering soil dryness making germination impossible.
Emergence timing of weed beet in sugar beet relative to seed mortality and dormancy cycles in annual simulations with GENESYS for three contrasting cropping systems. Triangles indicate crop sowing and harvesting dates; diamonds indicate onset, mid and end of emergence (dates when 0·10, 0·50 and 0·90 of seedlings have emerged, respectively). Squares show periods where germination was impossible because of low temperature (light squares, mean daily soil temperature <3·5°C) or insufficient water potential (dark squares, mean daily soil water potential <−1·7 MPa); example of top 10 mm soil layer. Note that soil conditions vary with weather series used for each cropping system.

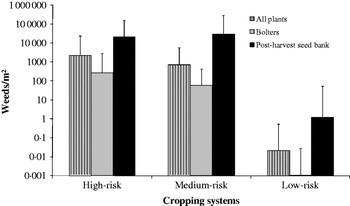
Plants, bolter and seed bank densities observed at the 20th year of the step 2 simulations varied with the cropping system (Fig. 2). They were always highest in the high-risk cropping system, slightly lower in the medium- and lowest in the low-risk system. In the high-risk system, these densities were c. 10% lower than those observed in the crop-dependent weed dynamics analysis, with a higher difference for plants v. bolters. In the medium-risk system differences were only c. 5% whereas, in the low-risk system, densities were similar.
Weed infestation (plants or seeds/m2) in sugar beet after 20 years of simulation with GENESYS for the three contrasting cropping systems. Mean and standard deviation of 50 000 simulations per cropping system.

Relative contribution of the various simulation factors
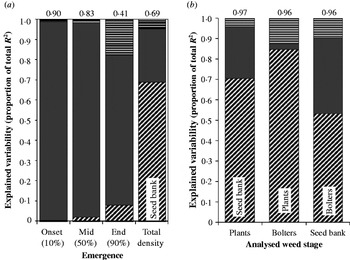
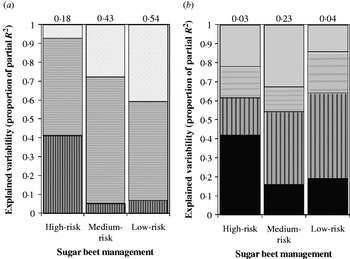
Weed emergence timing in the annual simulations mostly depended on crop management, with an effect decreasing with time, i.e. crop management explained 0·98, 0·96 and 0·74 of total R 2 for emergence onset, mid-emergence and emergence end, respectively (Fig. 3a). Simultaneously, the contribution of both initial seed bank characteristics (seed age and depth) and weed life-traits increased. Total emergence was mostly related to initial seed bank, while crop management only explained 0·25 of the total R 2 and life-traits less than 0·05.
Contribution of previous weed life-stage (diagonal stripes), cropping system (no stripes) and weed life-traits (horizontal stripes) to explaining the variability in dates of onset, mid and end of weed emergence as well as in density (a), and the variability in weed densities at different stages simulated by GENESYS (b). Percentage of total R 2 of linear regressions (1) and (5), and total R 2 (on top of bars).

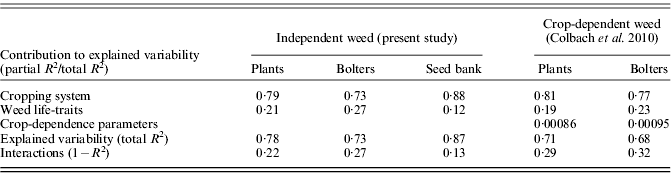
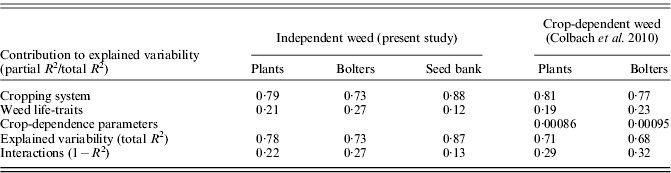
The variations in weed beet densities were mostly explained by the cropping system, i.e. the cropping system explained 0·79, 0·73 and 0·88 of total R 2 for plant, bolter and seed bank densities, respectively (Table 5). The cropping system contribution was thus lower than in the previous study integrating crop-dependence (Colbach et al. Reference Colbach, Darmency and Tricault2010). Conversely, the contribution of weed life-traits was higher in the present crop-independent study, particularly for bolters (0·27 v. 0·23, see Table 5). Moreover, unexplained variability (which was solely due to interactions between simulations factors in these two studies) decreased when disregarding crop dependence.
Variability in weed densities explained by simulation factors in the present study and in the literature (adapted from Colbach et al. Reference Colbach, Darmency and Tricault2010). Relative partial R2 (proportion of total R2) and total R2 from linear regression (3) analysing weed densities as a function of cropping system and life-traits
Relationship between successive weed stages
When the previous weed stage was added as an additional variable for explaining weed output (in regression (5)), the contribution of the various simulation factors dropped considerably. A 0·70 of the variability in plant density was explained by the soil seed bank, 0·25 by the cropping system and only 0·04 by weed traits (Fig. 3b). The dependence of bolter densities on the previous stage, i.e. plant densities, was even greater but with a larger trait contribution; the importance of the cropping system was tiny. The situation for the seed bank was different, with a higher cropping system contribution to the detriment of the effect of the previous stage.
Relative contribution of the various life-trait categories
The relative contribution of the different life-trait categories (proportion of partial R 2 for life-traits of linear regression (4)) varied with the analysed output variable and the cropping system. In the high-risk cropping system of the annual step 1 simulations, emergence onset almost entirely depended on germination and dormancy parameters (listed in Table 3a) and a little on pre-emergence growth parameters (Fig. 4a). The contribution of the latter increased with the decreasing risk level of cropping systems to the detriment of dormancy parameters. Seed survival parameters were without effect. The contribution of the different trait categories was more equal when looking at emergence density. The comparison of the three cropping systems was not possible because of the low partial R 2 of traits in the high- and low-risk systems.
Contributions, simulated by GENESYS, of life-trait categories (from top to bottom: pre-emergent growth and survival, germination, dormancy, seed mortality) to explaining the variability in (a) dates of mid-emergence timing and (b) density (percentage of partial R 2 for life-traits of linear regression (2) on vertical axis and partial R 2 for weed life-traits on top of bars).

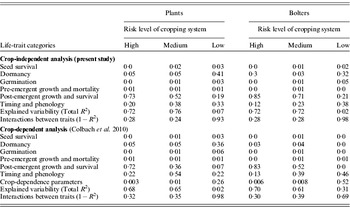
In the multi-year simulation, the relative contribution of the different life-trait categories varied with the risk level of the cropping system, with similar rankings for the analysed variables (Table 6). In the high-risk cropping system, post-emergence life-traits were responsible for almost the entire trait contribution. The contribution of the post-emergent growth and survival parameters decreased in the medium and, particularly, in the low-risk systems. Conversely, the contribution of post-emergence timing and phenology parameters increased even more with the decreasing risk level of the cropping system. Pre-emergence parameters had little impact, except for dormancy parameters in the low-risk system. The contribution of interactions between traits was c. 0·25 in the high- and medium-risk systems and explained almost all the variability in plant and bolter densities in the low-risk system. The results for seed bank densities (results not shown) were similar to those for plant and bolter densities.
Variability in weed densities explained by different categories of life-traits in the present study and in the literature (adapted from Colbach et al. Reference Colbach, Darmency and Tricault2010). Relative partial (proportion of total R2) and total R2 of linear regression (4) analysing weed densities as a function of life-traits in each cropping system

The present results obtained when analysing crop-independent weed beet were similar to those obtained in the previous study (Colbach et al. Reference Colbach, Darmency and Tricault2010) with crop-related weed beet (Table 6). The main differences were the higher weight in the crop-dependence analysis of the post-emergence timing parameters in the low-risk system and of the interactions between traits. The other difference was the near absence of any pre-emergence trait effects for bolters in the low-risk system. Indeed, almost the entire bolter population observed in the current sugar beet consisted of bolted crop plants, despite the presence of a few indigenous weed seedlings for which pre-emergence parameters played a large role, just as in the crop-independent analysis.
Effect of weed traits on weed emergence and dynamics
Table 3 synthesizes the effects of model processes and parameters on weed dynamics in the present, crop-independent analysis, explains the reason for the observed variations and gives the possible interactions with cropping system components. It is based on the results of linear regressions (1) and (4); these regressions were used to quantify the effects of a variation (usually a 50% increase for values, or a month delay for dates) in parameter values on the analysed output. For instance, in GENESYS-BEET, seed mortality starts on 1 October and lasts for 50 days (nominal values). If this onset of the mortality period is delayed by 1 month, weed bolter densities at the analysed crop harvest increase, while the density of emerged seeds varies with the cropping system. Indeed, if sugar beet is harvested after the end of physiological maturity (1 September), delaying the onset of the mortality period leaves more fresh seeds to emerge before crop harvest. However, seed mortality processes are less important in rotations where crops favourable to weed emergence and reproduction (i.e. sugar beet) are frequent, as in the high-risk cropping system.
Most of the trait effects were foreseeable, though not their relative effects. For instance, the quantification of the variations in densities (see supplementary information for further details (available at http://journals.cambridge.org/ags)) showed that bolting success seemed to be more important than either earlier (i.e. plant survival rate) or later rates (i.e. flower and seed production). This was also the only process to interact selectively with cultural techniques, i.e. bolters can be killed without unbolted plants being affected but there is no operation destroying unbolted plants, flowers or seeds without also eliminating bolters.
The comparison of the present result with the previous crop-dependent weed analysis showed that weed traits usually presented the same effect on weed dynamics in both studies. It again appeared that pre-emergence traits (dormancy rates, phytochrome stimulation by light, etc.) influenced densities less in the crop-dependence study (Colbach et al. Reference Colbach, Darmency and Tricault2010), where the weed population partially descended from the crop, via groundkeepers (which do not present any pre-emergent processes) or accidental crop bolters (regularly introduced into the rotation via sugar beet crops).
The particular case of crop–weed competition traits
The parameter values in Table 3b describe weed growth and development in optimal conditions, i.e. bare ground. In other crops, seven of these parameters are corrected by a multiplicative parameter (Table 4). For instance, the maximum bolting rate in bare ground is 0·934 (Table 3b); in sugar beet, this parameter is multiplied by 0·71 to obtain an actual rate of 0·663 (Sester et al. Reference Sester, Dürr, Darmency and Colbach2007). For the present sensitivity analysis, the six remaining timing parameters were also multiplied by a corrective parameter, using 1 as nominal value (Table 4), to check whether these parameters are potentially important for other species (and to check whether their initial non-inclusion in GENESYS is acceptable).
In the present sensitivity analysis, variations in these relative coefficients (13 per crop) only explained 0·06, 0, 0·01 and 0·07 of total R 2 in the medium-risk system for sugar beet, cereals, maize and set-aside, respectively, compared to the 0·85 of total R 2 (Eqn 4) explained by the optimal post-emergent parameters in Table 3b. These values are similar to those obtained in the crop-dependence study (Colbach et al. Reference Colbach, Darmency and Tricault2010), except for sugar beet where crop–weed competition parameters had slightly more impact in the present study. The analysis of the variations in bolter densities due to increases in competition parameters moreover showed that models need to pay more attention to bolting and flowering dates in sugar beet and set-aside, i.e. the two crops where weed beet reproduces well. Indeed, in these two crops several relative timing parameters produced significant variations in bolter densities in all three cropping systems (Table 4, electronic annexes) though they are currently not included in GENESYS.
The effect of the relative parameters was similar to the optimal competition parameters, i.e. an increase in the relative parameters for the timing of bolting and flowering decreased GENESYS bolter output and, except in winter cereals where reproduction is hardly possible, any increase in the relative coefficients for survival and reproduction increased bolter densities (Table 4). There were however a few differences. For instance, delaying bolting in sugar beet increased bolters because more bolters avoided the only bolter-specific operation, i.e. hand-pulling.
Interaction with crop management and cropping systems
Most of the interactions between cropping systems and weed traits are listed in Table 3. The magnitude of the changes in emergence and bolters varied greatly between cropping systems (see supplementary information available at http://journals.cambridge.org/ags). Generally, the higher the seedling and bolter densities in a system, the larger the variations. The magnitude of variation in emergence timing and density was similar for low- and medium-risk systems and highest for the high-risk system. Variations in bolter densities were lower than 1% in the low-risk system; they were much higher and similar on the two other systems.
Differences in magnitude and in effects between cropping systems could be related to differences in crop rotations and management. For instance, seed mortality parameters were less significant in the high-risk system with its frequent sugar beet crops favourable to weed seed production (Table 3a). The logic behind the observed variations was the same irrespective of the cropping system. For instance, any parameter variation increasing early emergence after crop sowing increased both in-crop emergence and long-term bolter densities. As sowing dates varied between cropping systems, the effect of parameters can thus decrease (e.g. base temperature for germination) or even change (e.g. onset date of dormancy appearance) with the cropping system.
Overall, parameters determining the timing of events, either relative to operations in a crop or to favourable crops in the rotation, appeared to be crucial and often more important than those determining their success. For instance, parameters determining dormancy cycles and germination timing relative to sugar beet crop sowing produced greater variations in bolter densities than parameters determining emergence success. Similarly, in the low-risk system where crops favourable to weed emergence and reproduction are rare, any parameters reducing seed bank depletion (i.e. lower seed mortality and higher dormancy) favoured long-term dynamics because it left seeds for later favourable crops.
DISCUSSION
Can weed beet be considered as a typical spring weed?
The ranking of parameters and processes determined in the present study can help to determine practical advice for controlling weeds in cropping systems, by understanding the processes responsible for their dynamics (Bhowmik Reference Bhowmik1997). Many of the present conclusions have already been demonstrated in previous sensitivity analyses to cropping system variables (Tricault et al. Reference Tricault, Darmency and Colbach2009) and life-traits of a crop-dependent weed (Colbach et al. Reference Colbach, Darmency and Tricault2010) and remain valid for a crop-independent weed, e.g. decrease the frequency of favourable crops in rotations and, more generally, diversify the rotation.
The present analysis increases understanding of the reason for weed-favouring effects of sugar beet frequency. As this effect was observed both in the present crop-independent and in the previous crop-dependent analysis, the reason is not a weed input from the crop parent via groundkeepers and seed production from accidental bolters, except for rotations with very rare sugar beet (as in the low-risk cropping system) where this crop then is responsible for the creation of a new bolter population. Otherwise, the favourable nature of a crop is mostly due to the synchronicity of emergence and reproduction of the weed and the crop, as shown by the increased contribution of any parameters determining the timing of weed stages relative to sugar beet sowing, weed control operations and crop harvest in the crop-independence v. the crop-dependence study. Moreover, the present analysis showed bolter densities to be highly correlated to plant densities, with only a small crop management effect, whereas plant densities were less correlated to seed bank densities, with a larger cropping system effect. The possibilities for controlling the advent of mature plants once the seedlings have emerged are therefore small compared to the options for limiting emergence. The importance of emergence timing is consistent with observations by Fried et al. (Reference Fried, Norton and Reboud2008) who reported dominant weed species to be those with a dormancy cycle modelled on the crop cycle.
Consequently, control of crop-independent weed species should focus even more on optimizing the timing of cultural operations (crop sowing dates, weeding operations and harvest) relative to weed-dormancy cycles, soil conditions favourable to germination and phenology (e.g. sow when seeds are dormant, treat at the end of the major emergence flush, delay hand-pulling until the end of the bolter flush). This major difference should be kept in mind when adapting the advice produced by Tricault et al. (Reference Tricault, Darmency and Colbach2009) for weed beet control to crop-independent weed species. The importance of operation timing also reinforces the advantage of a diversified rotation as the latter increases the range of possible dates for cultural techniques such as tillage, sowing, herbicide applications or harvesting.
The contribution of the various life-traits varied with the cropping system and thus also the type of potential weed populations and species occurring in these systems. In the low-risk cropping system, interactions between life-traits strongly affected mature weed densities and much more than in the crop-dependent analysis (Colbach et al. Reference Colbach, Darmency and Tricault2010), where a large proportion of these individuals resulted from accidental crop bolters. Without the input from the crop, a judicious combination of individual traits was crucial for passing through the numerous filters created by the cultural techniques, whereas optimizing traits individually did not increase weed densities significantly in the present study. This is consistent with field observations showing that even a trait as dominant as herbicide resistance is insufficient to ensure large weed densities if factors other than herbicides are unfavourable, e.g. densities of herbicide-resistant Alopecurus myosuroides Huds. remained low in rotations with frequent spring crops, mouldboard ploughing and late sowing (Chauvel et al. Reference Chauvel, Guillemin and Colbach2009). In these conditions, one or even several unsuccessful weed control operations would not be disastrous since control operations were frequent and populations possessing all the necessary requirements for success would be rare. However, if a plant of these highly adapted populations was present, conditions for reproducing would be optimal because no other populations would be there to compete for space, water and nutrients. A similar observation has been reported when looking at the genetic diversity within a population of Chenopodium album over the years which was highest when selective filters were rare, i.e. when herbicide selection pressure was low and favourable crops were frequent (Gasquez et al. Reference Gasquez, Mouemar, Bouvard, Matejicek and Barralis1984). Similarly, in the present study, interactions between traits were unimportant in the high-risk system with frequent sugar beet crops. In this condition, even single favourable weed traits had a tremendous effect on weed infestation. In such a situation, to fail the particular control operation aiming at this trait would have disastrous consequences. Overall weed infestations were logically much more frequent as filters resulting from cultural techniques were rarer and less complementary.
The analysis of the seed bank density found after the last sugar beet harvest pointed to another important feature of weed management, i.e. the necessity of long-term control. Indeed, only half of the variability in seed bank density could be explained by the latest bolter population, indicating that older infestations also contribute to a large part of the seed bank found after the latest seed rain. This will not be new to any weed scientist (e.g. Clements et al. Reference Clements, Weise and Swanton1994; Teasdale et al. Reference Teasdale, Mangum, Radhakrishnan and Cavigelli2004), but extension services still tend to consider weed control only as a function of the actual crop and its predecessor instead of also accounting for past crops.
In conclusion, weed beet can be considered as a typical spring weed in rotations where crops favouring weed reproduction are frequent. In such rotations, advice for controlling the crop-relative and the crop-independent weed is more or less identical. However, the rarer these crops, the more the behaviour of the two weed types differ. For the crop-independent weed, the rarer the favourable crops, the more important pre-emergence processes become; management advice should thus focus more on seed bank survival and seedling emergence. For the crop-relative, post-emergence processes become dominant because of the increasing necessity for a new population founding event; management advice should mostly concern the avoidance of crop bolters. The present similarities are though only valid as long as the crop-relative does not inherit further traits (e.g. disease resistance) from the crop that would attribute a selective advantage over the crop-independent weed. The current selective advantage inherited from the crop, herbicide resistance, will only make a major difference between the two weed types if herbicide-tolerant crops become more frequent in the rotation.
Life-trait effect
The effect of life-traits on emergence onset and major timing was negligible, indicating that any genetic variant of weed beet would emerge more or less simultaneously, soon after spring crop sowing. However, there was a major effect on late emergence, indicating that the difference between variants might reside not so much in the onset of emergence but rather in whether emergence is continuous through most of the crop season, or concentrated after crop sowing. The latter strategy maximizes the possibility of finishing the species reproductive cycle whereas the former optimizes the likeliness of escaping early weed control operations. This is consistent with field observations with herbicide applications (Kon et al. Reference Kon, Follas and James2007; Scursoni et al. Reference Scursoni, Forcella and Gunsolus2007).
The lower impact of life-traits on total emergence and surviving plants argues that in the cropping systems tested in the present study, with annual spring crops and frequent tillage, there is not a large range of possible strategies for successful emergence. Similar conclusions have been reported from maize/soybean rotations (Kegode & Forcella Reference Kegode and Forcella2006). The life-trait effect however increases when looking at bolters and seed bank. This is not surprising for the latter, which cumulates all effects over time. The higher life-trait weight for bolters is more surprising especially when considering the high correlation with surviving plants. It seems that even for a given plant population, there is more room for different species strategies to reach the reproductive stage.
The low weight of the life-trait effect compared to the cropping system effect might be explained by the low variability in environmental conditions among cultivated large-crop fields compared to the variability among different natural habitats. For instance, only habitats that were sufficiently moist and not too water logged would be used for cultivation. Moreover, cultural techniques, particularly tillage, are chosen to optimize crop emergence and root growth by increasing soil porosity, nitrogen availability, etc. Natural habitats change gradually over time, whereas field habitats are disturbed frequently and radically through tillage and sowing, which also selects a certain type of populations and species. For instance, tillage buries weed seeds and stimulates germination of buried seeds. Over time, this would select species with seeds surviving for several years (Debaeke & Orlando Reference Debaeke, Orlando, Monnier, Thévenet and Lesaffre1991) and, to a lesser degree, able to emerge from greater depth than in natural habitats.
Extrapolation to other weed species
Various conclusions drawn here should also apply to other weed species in cropping systems, such as the interaction between seed survival and the frequency of crops favouring weed reproduction. Other conclusions are probably only valid for spring-emerging weeds such as weed beet. Indeed, former sensitivity analyses for crop volunteers (of oilseed rape) carried out with a similar cropping system model showed pre-emergence traits to be crucial for autumn-emerging species with relatively short-lived seeds (Colbach et al. Reference Colbach, Molinari and Clermont-Dauphin2004), in contrast to the present analysis where the timing and success of above-ground development before crop harvest was the most important limiting factor. Indeed, the duration of the crops in which autumn-emerging species emerge is considerably longer, and seed production usually terminated long before crop harvest. Thus, seed survival as well as the timing and success of emergence relative to crop establishment would be the most important limiting factor.
These tentative conclusions drawn for these two contrasted types of weed species could give valuable pointers for the specific diversity of weed flora in cropping systems. Most obviously, a species with relatively short-lived seeds could only be frequent in rotations with a high proportion of crops favouring the species’ emergence and reproduction. This is the case of the autumn-emerging A. myosuroides typical of winter cereals, whereas the weed is rare in rotations combining winter and spring crops (Chauvel et al. Reference Chauvel, Guillemin, Colbach and Gasquez2001). On the other hand, species with long-surviving seeds would be more typical of diverse rotations and their management needs to be considered over a longer time-span (see examples in Van Acker Reference Van Acker2009).
More innovative is the identification of possible weed-controlling operations by analysing the relative ranking of processes. For instance, the key role of pre-emergence v. post-emergence processes for autumn-emerging species indicates that autumn-emerging weeds can probably be controlled by operations limiting weed emergence in winter crops. Stale seed bank techniques and delayed sowing are thus efficient for controlling A. myosuroides (Chauvel et al. Reference Chauvel, Guillemin and Colbach2009). For spring-emerging weeds in spring crops, adequate post-emergence weed control would be more important. Indeed, spring-emerging weeds are usually dormant when stale seed bed techniques are feasible (summer and autumn in Europe), whereas fields are usually too wet for tilling when seed dormancy is sufficiently reduced for stale seed bed techniques to have an effect. For each weed type (species and/or population in some cases), the crucial processes and limiting factors must be determined to identify the adequate weed control operations and their timing (see examples in Van Acker Reference Van Acker2009).
Critical evaluation with regard to the model hypotheses
The previous conclusions were all based on simulations with a model. It is vital to remember that models are not reality, but a simplification thereof. The effects of some cultural techniques or life-traits are probably insufficiently described. For instance, GENESYS-BEET considers that any tillage destroys all emerged seedlings and germinated seeds (Table 1). This is a gross simplification as superficial and/or non-inverting tools only destroy part of the weeds (Chicouene Reference Chicouene2007). And even for a given tool (e.g. harrow), weeding efficiency greatly varies with weed stage, soil moisture, tillage depth and speed (Kurstjens & Kropff Reference Kurstjens and Kropff2001). In addition, other effects were simply neglected in the model where, for instance, mowing and hand-pulling destroy bolters regardless of their height. This is an important over-estimation of operational efficiency. Moreover, this makes the extrapolation of height-dependent effects to other weed species impossible. Future research should concentrate on developing more generic weed dynamics models that are appropriate for both autumn- and spring-emerging species, tall and small ones, dicotyledonous v. monocotyledonous ones, etc.
In conclusion, the present study produced additional knowledge on the processes responsible for the success of a weedy crop relative, i.e. weed beet. Most importantly, seed input from the crop was shown to be a minor factor except for creating the original weed population. Once such a population had appeared, it behaved very similarly to ‘real’ weed species that do not benefit from any input from crops. Pre-emergence processes, however, were shown to be more important for crop-independent species than for weedy relatives. The study also identified those weed stages most sensitive to cropping system effects for spring-emerging weed species with relatively long-living seeds as is the case for weed beet. The variability in weeds due to life-traits is relatively low, especially compared to wild species, indicating that in the tested cropping systems with annual spring crops and frequent tillage, the range of successful species strategies for emergence and reproduction is limited. An original feature of the present study was to extrapolate from the particular case of weed beet and to draw more general conclusions on the relative importance of processes and parameters for other weed species. Indeed, investigating diverse and multi-specific weed flora becomes increasingly important in a changing agriculture (e.g. introduction of new crops, reduction of herbicide pressure, less reliance on mouldboard ploughing, etc.), especially as the present study showed that cropping system factors played a larger role than species life-traits in determining both weed emergence and long-term population dynamics. The present analysis though also showed that conclusions for a given weed type and/or cropping system cannot be simply transposed to different species or conditions. Additional studies with generic multi-specific weed models that take account of a large range of diverse weed behaviour and cropping systems are therefore necessary.
The present work was financed by INRA (Projet Innovant Département Environnement et Agronomie).