Introduction
Since the late 1990s, the shifting demographic and economic outlook has led policy makers and governments to call for us to keep working longer. Most European governments have therefore redesigned their social security systems: state pension ages have been raised and incentives to retire early have been modified by reducing benefits and restricting early retirement eligibility (Reday-Mulvey, Reference Reday-Mulvey2005; Vickerstaff et al., Reference Vickerstaff, Loretto, White, Loretto, Vickerstaff and White2007; Ebbinghaus, Reference Ebbinghaus2011, Reference Ebbinghaus2019; Pavolini and Seeleib-Kaiser, Reference Pavolini and Seeleib-Kaiser2018). The outcomes have been relatively modest (e.g. Taylor, Reference Taylor and Taylor2008; see also Wainwright et al., Reference Wainwright, Crawford, Loretto, Phillipson, Robinson, Shepherd, Vickerstaff and Weyman2019), however, and early exit/retirement continues to play an important role in the lives of millions of older workers across Europe. This seems to indicate that early retirement is conditioned by factors other than economic incentives alone. In recent publications, even the Organisation for Economic Co-operation and Development (e.g. OECD, 2006) has realised that a long range of factors – or perhaps even combinations of factors – influence the timing of retirement.
As to the magnitude of early retirement, however, some countries are faring better than others. In a comparative perspective, the scale of early exit/retirement in the Scandinavian countries has historically been rather low. Nevertheless, major differences can be found in the employment rates among older workers in the Scandinavian countries. In 2015, the employment rate of older workers was 64.7 per cent in Denmark and 74.5 per cent in Sweden (Eurostat, nd-a).
Using a qualitative (or case-oriented) comparative approach that is both holistic, analytic and combinatorial, the aim of this article is to assess configurations or combinations of conditions that have produced major differences in the employment rates among older workers in Denmark and Sweden. Differences in the employment rate among senior citizens function as the ‘explanandum’ in this article. A most-similar-country design has been applied. The two countries are both Social Democratic welfare regimes and rather similar regarding their political systems, general demographics and cultural orientations; both countries are predominantly Protestant and each has a very strong work orientation (e.g. Svallfors et al., Reference Svallfors, Halvorsen and Andersen2001). Despite their contextual similarities, Sweden and Denmark differ regarding the structural characteristics of the population, institutions and welfare policies: all issues that are particularly likely to have an impact on early retirement patterns.
From an inter-disciplinary perspective these conditions have been conceptualised as push, pull, jump, stay and stuck factors (Snartland and Øverbye, Reference Snartland and Øverbye2003; Jensen, Reference Jensen2005; Maltby, Reference Maltby2011; Andersen et al., Reference Andersen, Jensen and Sundstrupin press). While push, pull and jump are conducive to early retirement, stay and stuck condition late retirement. A qualitative comparison between Sweden and Denmark thus renders it possible to examine how different push–pull–jump–stay–stuck combinations condition early retirement patterns among older workers in the two countries. Hence, the article moves beyond the existing research investigating early retirement, which tends to be dominated by variable-oriented quantitative methods. The major research question runs as follows:
• What combinations of push, pull, jump, stay and stuck factors are associated with low and high employment rates in Denmark and Sweden?
The article starts by outlining the inter-disciplinary conceptual and theoretical framework of push–pull–jump–stay–stuck. It then moves on to present the methodology of the qualitative (or case-oriented) comparative approach. Hereafter, the most relevant empirical data and observational units are presented. Finally, interactions between observational units are considered which lead to statements about how different combinations of push–pull–jump–stay–stuck have produced different outcomes in Denmark and Sweden.
Conceptual and theoretical framework
Various disciplines such as sociology, psychology and economics have been engaged in identifying the most relevant factors conditioning the timing of early exit and retirement. The different disciplines obviously focus on different aspects of the phenomenon. For example, psychologists would argue that early retirement is associated with a decreased psychological commitment to work (e.g. Feldman, Reference Feldman1994; Rosenthal and Moore, Reference Rosenthal and Moore2018); economists reason that early retirement is triggered by the financial incentives built into pension and welfare programmes (e.g. Blöndal and Scarpetta, Reference Blöndal and Scarpetta1999; Börsch-Supan, Reference Börsch-Supan2000; Staubli and Zweimuller, Reference Staubli and Zweimuller2013); whereas sociologists hold that changing retirement patterns result from systemic change, including shifting societal norms, values, the content of work and its organisations (e.g. Kohli, Reference Kohli1988; Radl, Reference Radl2013). These different propositions are not necessarily reciprocally exclusive. Retirement is influenced by psychological, sociological and economic factors (e.g. Wang and Shultz, Reference Wang and Shultz2010; Hofäcker et al., Reference Hofäcker, Hess, Naumann and Torp2015; Fisher et al., Reference Fisher, Chaffee and Sonnega2016; Topa et al., Reference Topa, Depolo and Alcover2018), which is probably why retirement research has increasingly become multi-disciplinary in nature in recent decades.
Multi-disciplinary research calls for new conceptualisations of retirement. During the 1990s, catchphrases such as push and pull were developed to summarise factors conditioning early exit/retirement (e.g. Kohli and Rein, Reference Kohli, Rein, Kohli, Rein, Guillemard and van Gunsteren1991; Shultz et al., Reference Shultz, Morton and Weckerle1998). These concepts have been criticised for their inability to explain social variability in retirement timing, however, as the push and pull concepts neglect age norms and the lifecourse perspective of retirement, the interplay between gender and social class, interdependency between different life spheres (family, work and community) as well as human agency (e.g. Radl, Reference Radl2013; Topa et al., Reference Topa, Depolo and Alcover2018). To meet this criticism, the pull concept has been expanded to include sociological thinking about the role of norms in relation to retirement, and the ‘jump’ concept has been constructed to account for gender and family characteristics as well as human agency (e.g. Jensen, Reference Jensen2005; Jensen et al., Reference Jensen, Kongshøj and de Tavernier2020); hence, an updated content of the push, pull and jump concepts is the following.
‘Push’ refers to the involuntary exclusion of older workers from the labour market. From a push perspective, seniors can be forced to leave the labour market due to qualification deficits (Gould and Polvinen, Reference Gould, Polvinen, Gould, Ilmarinen, Järvisalo and Koskinen2008) and poor mental or physical health (Phillipson and Smith, Reference Phillipson and Smith2005; Shultz and Wang, Reference Shultz and Wang2007; Thorsen et al., Reference Thorsen, Jensen and Bjørner2016), which is often an outcome of specific workplace characteristics, e.g. poor quality work and high physical and psychological strain, and workplace design, epitomised as loss of work ability and employability (Ilmarinen, Reference Ilmarinen2005; Martinez and Fischer, Reference Martinez and Fischer2019). But push might also be due to seniors being subjected to discriminatory practices, as when management practices, including dismissal and recruitment processes, are structured by entrenched notions of chronological age. Such discriminatory practices are favoured by high levels of unemployment (Herbertsson, Reference Herbertsson2001; Knuth and Kalina, Reference Knuth and Kalina2002; Ebbinghaus and Hofäcker, Reference Ebbinghaus and Hofäcker2013) and low levels of employment protection, allowing employers to transfer the costs of redundancies and workforce rationalisations to the welfare state (Casey, Reference Casey1992).
‘Pull’ is mainly voluntary, and two types of pull explanations exist. First, explanations rooted in rational actor theory assume that the timing of retirement is determined by the overall utility of a given behaviour, indicating that older workers are lured out of the labour market by the utility of generous early retirement and pension benefits (Gruber and Wise, Reference Gruber and Wise1999). Second, some sociologically oriented explanations assume that retirement is a mechanical reaction to symbolic signals as to when it is appropriate to leave the labour market (Atchley, Reference Atchley1982; Solem et al., Reference Solem, Syse, Furunes, Mykletun, de Lange, Schaufeli and Ilmarinen2016), indicating that retirement is a normative event facilitated by age norms and values anchored in, for example, the state pension age or age of eligibility to early retirement benefits. In other words, the state pension age helps to produce age-based, lifecourse structuring (Henretta, Reference Henretta and Settersten2003).
‘Jump’ is another voluntary phenomenon (Jensen and Kjeldgaard, Reference Jensen and Kjeldgaard2002), but the retirement decision here is determined neither by financial incentives nor normative signals. Jumpers are not rule-followers, and the welfare state is merely one of many factors in relation to which (‘nomadic’) older workers make their decisions (Giddens, Reference Giddens1990). Other income sources include one's spouse, private savings and equity in the home, together with investments. Moreover, jumpers may be willing to accept pension penalties in exchange for a more fulfilling lifestyle. Retirement is thus guided by values and needs that come from within, including a desire to realise individual potentials in an active ‘third age’. Jumpers have a psychological distance from their work and identify with non-work roles (Higgs et al., Reference Higgs, Mein, Ferrie, Hyde and Nazroo2003; Topa et al., Reference Topa, Depolo and Alcover2018), meaning that work orientation is supposedly rather low among jumpers. Still, retiring due to the social expectations of family and friends is also a jump phenomenon.
When jumping, individuals can strive for experience gains (e.g. world travel, hobbies) or social gains. Social gains are achieved in social networks and the family, and women tend to jump more frequently than do men; that is, the timing of retirement is gendered. This is partly because couples tend to synchronise retirement (Coile, Reference Coile2004; Syse et al., Reference Syse, Solem, Ugreninov, Mykletun and Furunes2014) and partly because women are more likely than men to find it more fulfilling and important to be with their grandchildren or care for frail elderly relatives (or their partner) than to work. Still, the obligation to leave the labour market for care purposes may be felt more strongly if child and/or eldercare is regarded as inadequate; that is, public care provisions affect seniors’ labour market prospects (Leime et al., Reference Leime, Street, Vickerstaff, Krekula and Loretto2017).
As mentioned above, push, pull and jump may function as an explanatory framework for early exit/retirement. In recent years, however, research has increasingly focused on why a growing segment of older workers continue to work until or beyond retirement age. Hofäcker and Radl (Reference Hofäcker, Radl, Hofäcker, Hess and König2016) have conceptualised this new trend using terms such as ‘need’ and ‘maintain’ factors, resembling the concepts of stay and stuck developed by Snartland and Øverbye (Reference Snartland and Øverbye2003) in the early 2000s.
‘Stuck’ denotes how many seniors feel compelled to remain (involuntarily) in the labour market until or beyond the age of retirement; in other words, the stuck mechanism refers to those who do not really want to be in the labour market but feel forced to continue because retirement would have negative consequences for their life situation. Here, distinction is often drawn between economic and social stuck factors (e.g. Snartland and Øverbye, Reference Snartland and Øverbye2003). In the economic sense, many seniors simply cannot afford to retire from the labour market because the welfare benefits do not cover the high fixed costs of living, such as housing payments or costs related to children living at home (Higgs et al., Reference Higgs, Mein, Ferrie, Hyde and Nazroo2003). On a social level, many fear becoming isolated if they retire, particularly those without a spouse/co-habitating partner or a very small social circle.
‘Stay’ explanations focus on the factors rendering it attractive for seniors to remain in the labour market voluntarily. This type of explanation comes into play in the case of those who remain active because they do stimulating and rewarding work, that the work involves ample opportunity for personal development and a healthy working environment, good pay and good relations to management and colleagues (Van den Berg, Reference Van den Berg2011; Hengel et al., Reference Hengel, Blatter, Geuskens, Koppes and Bongers2012). In other words, stay factors refer to positive aspects of the working and remuneration conditions that provide the satisfaction and motivation to continue working, meaning that characteristics such as class and education are strong predictors for the timing of retirement (Venti and Wise, Reference Venti and Wise2015). It is worth noting, however, that bridge employment may function as a strong stay factor (e.g. Wang et al., Reference Wang, Olson and Schultz2013).
Push, pull and jump versus stay and stuck represent two different sides of the same coin, and they are not mutually exclusive phenomena; they interact with one another, and seniors’ practices are likely influenced or motivated by more than one such force simultaneously. As such, different combinations of push–pull–jump–stay–stuck may lead to considerable differences in the timing of retirement in different countries. Hypothetically, low levels of employment among older workers can be expected to be found in countries where configurations of push–pull–jump predominate, whereas high employment rates can be found where configurations of stay–stuck prevail. Following this line of argument, this article seeks to identify the interplay or configurations of push–pull–jump–stay–stuck conditions that have produced different employment rates among seniors in Denmark and Sweden.
The qualitative (or case-oriented) comparative approach
Existing studies indicate that a long range of push–pull–jump–stay–stuck factors are conditioning the timing of retirement. In this paper, however, the research interest is not concerned with hypothesis testing; nor is the aim to identify the relative importance of the different factors influencing the timing of retirement. Rather, using the qualitative (or case-oriented) comparative method suggested by Ragin (Reference Ragin1987, Reference Ragin and Kohn1989), this paper aims to analyse the extent to which different combinations of push–pull–jump–stay–stuck conditions have produced low versus high employment rates among older workers in Denmark and Sweden.
The case-oriented approach treats cases holistically. It deals with heterogeneity across cases as well as the internal complexity of parts, indicating – contrary to assumptions in variable-centred approaches – that a specific cause may have different effects in different contexts (cf. Bourdieu et al., Reference Bourdieu, Chamboredon and Passeron1991). The unit of analysis is the nation-state. Similarities and differences among macro social units are analysed, and data are collected at that level, although a distinction is drawn between observational and explanatory units.
Observational units are units that are used in data collection and data analysis. The selection of these units has been theoretically guided. That is, we have made use of hypotheses and findings in social sciences that have already studied the social phenomenon under scrutiny, and we make use of observational units we already know to be relevant for the study of factors conditioning retirement timing. Using the conceptual and theoretical framework section as a point of departure, it seems reasonable to suggest that work orientation, class, qualification/education, health and gender affect the timing of retirement and that couples synchronise retirement. As to welfare state provisions, public child and eldercare are of importance. At the company level, workplace characteristics and levels of employment protection play a role. As to the labour market, unemployment (high versus low levels of unemployment) affects the timing of retirement. Regarding welfare state benefits, factors such as the generosity of pensions and early retirement benefits as well as the state pension age and age of eligibility for early retirement matter. These types of observational units are primarily analysed using secondary data sources. However, where secondary data have proven inadequate, data have been purchased from Statistics Denmark and Statistics Sweden (SCB), and these data are referred to as ‘own data’. ‘Own data’ are available on request.
Observational units are not viewed in isolation from one another because the character or meaning of individual observations cannot be fully grasped or understood independently of how they are related to other observations or the social context as a whole (Bourdieu et al., Reference Bourdieu, Chamboredon and Passeron1991). Observational units are turned into explanatory units only when it is analysed how ‘wholes’ consist of combinations of parts. Ragin thus argues that differences in macro social units are an outcome of different combinations of conditions or different empirical configurations, and that qualitatively oriented comparativists should study ‘how different conditions or causes fit together in one setting and contrast that with how they fit together in another setting’ (Ragin, Reference Ragin1987: 13), meaning that causation is understood conjuncturally.
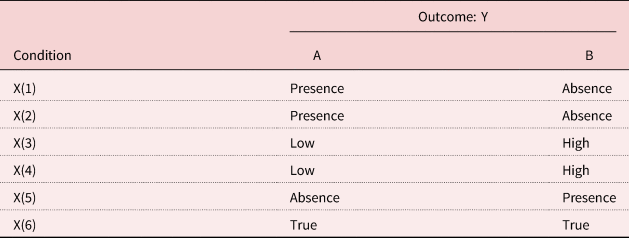
In order to identify different combinations of conditions producing different outcomes, the data must be organised in a matrix or ‘truth table’ (Ragin, Reference Ragin1987: 87). Here, the observational units are presented as presence or absence; high or low; true or false, etc. A simple illustrative truth table is presented in Table 1.
A truth table with six causal conditions
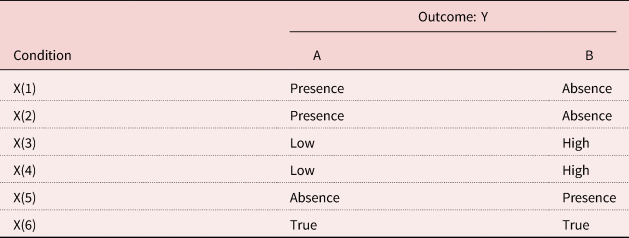
The truth table allows for a qualitative assessment of different (additive) combinations of conditions associated with different outcomes. Logically, it seems reasonable to assume that different combinations of X(1–5) produce A and B, meaning that A, for instance, is an outcome of the following configuration: X(1): presence + X(2): presence + X(3): low + X(4): low + X(5): absence. In contrast, X(6) has the same value in different settings. X(6) may nonetheless also influence differences in outcomes, as it may have different meanings and different steering effects when combined with X(1–5) in the different settings.
We turn to a theoretically informed presentation of our observational units in the next section. Following the empirical analysis, the observational units are organised in a truth table in the Conclusion. Using the truth table as a point of departure it will be possible to reach logically minded statements about combinations of conditions producing high versus low employment rates among older workers in Denmark and Sweden.
Empirical data and observational units
The observational units are more thoroughly discussed and presented in this section. Based on the existing literature, it has thus been substantiated that, in all probability, the early retirement pattern is associated with the structural characteristics of the population (work orientation, qualifications, health and gender), institutions such as the company (workplace characteristics including employment protection) and labour market (level of unemployment), welfare policies (care provisions and the quality and accessibility of pension and early retirement schemes) and how couples synchronise retirement. The following discussion aims at a more basic understanding of how these observational units in the two countries can be classified along dimensions such as presence or absence; high or low; true or false, etc.
Work orientations
Early retirement patterns are often argued to be conditioned by culture (e.g. Guillemard, Reference Guillemard2003), values, belief systems and ideals that shape the range of options for individual choice and action (de Vroom, Reference de Vroom, Maltby, de Vroom, Mirabile and Øverbye2004; Pfau-Effinger, Reference Pfau-Effinger2005). An early exit culture would thus indicate that older segments of the population identify with non-work roles (jump), whereas a late-exit culture would be indicative of a population marked by an intrinsic work orientation (stay) and that work is viewed as a sphere for self-expression (Turunen, Reference Turunen2011). Using the International Social Survey Programme (ISSP) statement: ‘I would enjoy having a paid job even if I didn't need the money’ as an indicator of work orientation, 66 per cent of the population aged 56‒65 in Denmark ‘strongly agreed’ or ‘agreed’ with the statement. The same figure in Sweden was 62 per cent, while the average among ISSP countries was 57 per cent (ISSP, 2015). These figures indicate that there are no marked differences in the general work orientation between Denmark and Sweden and that it is strong in both countries.
Health
The state of health also conditions the opportunities for participating in the labour market, and data on health and life expectancy suggest that Swedes are healthier than Danes. Healthy life years at age 65 in 2015 were 11.5 in Denmark and 16.3 in Sweden (OECD, 2017), meaning that the overall health of the population can be interpreted as high in Sweden and low in Denmark. These differences should allow older Swedish workers to work longer (stay) than their Danish counterparts (push). Differences in health and mortality can partly be explained by lifestyle differences (e.g. alcohol and tobacco consumption; cf. Juel, Reference Juel2008).
Qualifications of populations
Education levels are often seen as key predictors of the risk of early retirement (Venti and Wise, Reference Venti and Wise2015). Older, less-educated workers generally leave the labour market for push reasons, as those with limited education are more inclined to do work that is harmful to their health and/or harder on their bodies and have greater difficulty exploiting new job openings in a flexible labour market (Taylor and Walker, Reference Taylor and Walker1994: 579f). From a stay perspective, education serves as the entry ticket to more interesting and rewarding work with higher pay, which contributes to the interest in continuing in the labour market.
Differences in education levels in Denmark and Sweden can presumably help explain some of the differences in the employment rates among seniors. In 2008, 23 per cent of the Danish population had no professional or vocational training, whereas the corresponding figure in Sweden was only 15 per cent (OECD, 2010). More specifically, 37 per cent of Danes aged 55‒64 were without professional or vocational training, whereas the corresponding figure in Sweden was only 25 per cent. This suggests that the educational level of the population is low in Denmark and high in Sweden, and that the employment rate among Danish seniors might be higher if they had the same level of education as in Sweden.
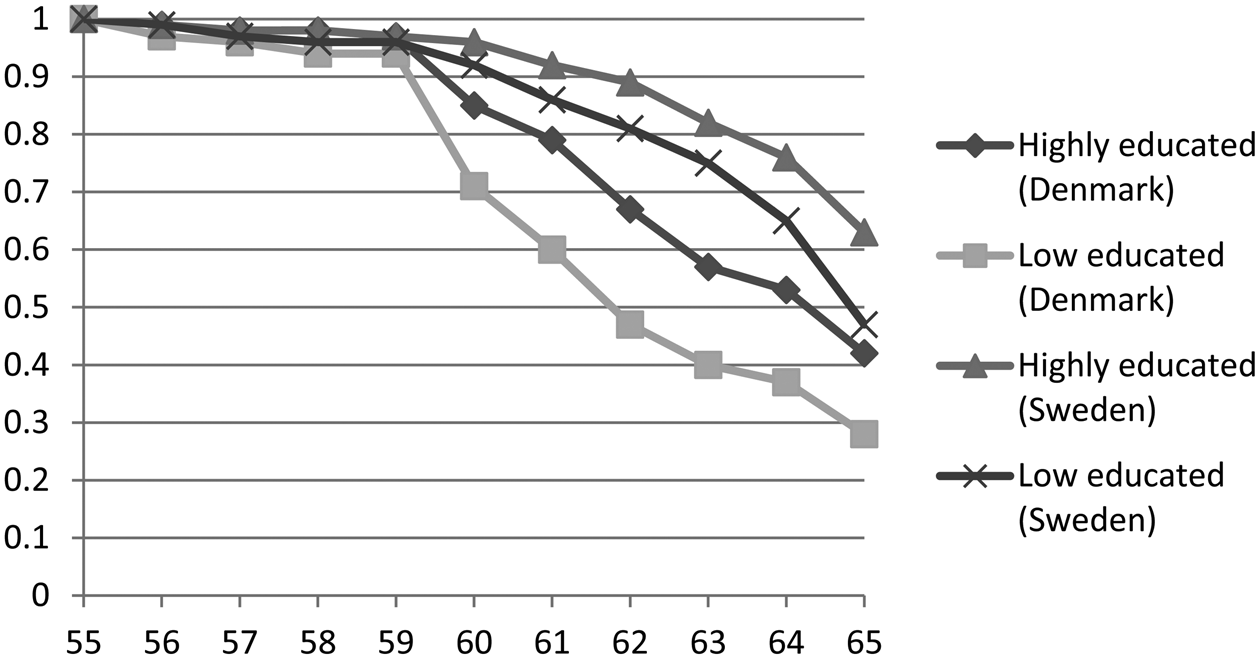
This is also confirmed when examining a specific cohort. Figure 1 shows a survival curve among highly (International Standard Classification of Education (ISCED) 6–8) and low-educated (ISCED 2) labour market participants aged 55 in 2003 and 65 in 2013. There are hardly any differences between Sweden and Denmark for highly/low-educated people leaving the labour market until reaching age 60, at which time the pattern becomes more complicated. Survival rates for low-educated labour market participants fall dramatically in Denmark. Between ages 60 and 65, the survival rate falls from 0.71 to 0.28. The fall is less dramatic among the highly educated in Denmark, where the survival rate falls from 0.85 to 0.42. It is also worth noting that the survival rate for the low-educated in Sweden is higher than for highly educated persons in Denmark but falls from 0.92 to 0.47. The survival rate is particularly high among the highly educated in Sweden, which in 2008 was 0.86 for those aged 60 but fell to 0.63 as the cohort reached age 65. Whatever the case, when studying the patterns country by country, it becomes obvious that the highly educated leave the labour market later than do those with limited skills.
Survival curves of retirees by education (retirees were aged 55 in 2003 and 65 in 2013).
Source: Own data, delivered by Statistics Denmark and Statistics Sweden.

Workplace characteristics and employment protection levels
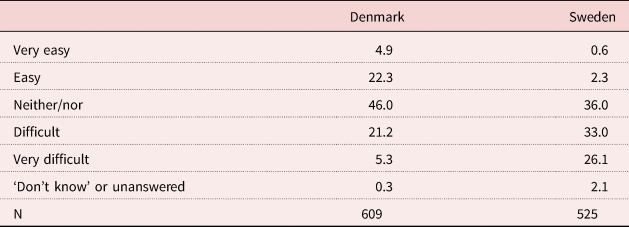
Another important factor for employment among seniors is the level of employment protection. Sweden introduced relatively extensive protection from dismissal in accordance with the so-called LIFO principle (last in, first out) in 1974, which covers all workers until age 67. LIFO means that those hired last are those to be fired first; in other words, persons with little seniority must be dismissed before those with greater seniority. Employers deviating from these rules face rather harsh penalties.Footnote 1 Hence, it is expensive for employers to get rid of older staff with seniority, and Swedish employers find it much more difficult to dismiss permanent staff than is the case in Denmark (cf. Table 2).
Whether it is difficult or easy for employers to dismiss permanent staff

Note: The question was: ‘Purely legally, how difficult is it for your workplace to dismiss permanent staff?’
Source: ASPA (2009).
Table 2 shows that 27 per cent of the Danish employers find it ‘very easy’/‘easy’ to dismiss permanent staff, the same figure for Sweden being only 3 per cent. Conversely, 59 per cent of the Swedish employers find it ‘difficult’/‘very difficult’ to dismiss permanent staff, which is only the case for 27 per cent of the Danish employers, meaning that employment protection is weak (allowing push) in Denmark and strong (encouraging stay) in Sweden. Still, in order to ensure that Swedish employers are interested in employing and retaining older employees, the employers receive a ‘tax reduction’ if they employ workers 65+ years of age. In Sweden, employers pay a 31.2 per cent employer tax on their payroll to the state. For employees over 65, the tax is dramatically lower; as of 1 July 2019, a mere 10.2 per cent. In other words, Swedish employers associate employing or retaining older employees with lower costs.
It should also be noted that low levels of unemployment protection in Denmark form part of the Danish ‘flexicurity’ system. The Danish flexicurity model allegedly represents a specific configuration of labour market institutions allowing for the combination of social justice (high levels of social protection) and economic efficiency (flexible labour markets). The model is based on three pillars: (a) generous unemployment benefits, which make workers less resistant to firing, layoffs, etc.; (b) low employment protection levels, leading to a high turnover rate on the Danish labour market; and (c) active labour training/re-training and geographical mobility, which helps workers to improve their qualifications vis-à-vis new job openings (e.g. Jensen, Reference Jensen2017).
Differences in the workplace characteristics also condition the differences in the early retirement patterns in Denmark and Sweden. The Swedish system places greater emphasis on a healthy work environment (stay) than does the Danish system (push). In effect, Sweden has on average a markedly lower incidence of fatal occupational accidents than does Denmark (Tómasson et al., Reference Tómasson, Gústafsson, Christensen, Røv, Gravseth, Bloom, Gröndahl and Aaltonen2011; Hansen, Reference Hansen2019). This was showcased in a study by Spangenberg et al. (Reference Spangenberg, Baarts, Dyreborg, Jensen, Kines and Mikkelsen2003), revealing how the Lost Time Injury (LTI) frequency rate of Danish construction workers was approximately fourfold the LTI rate of the Swedish construction workers in the construction of the Øresund Bridge (a bridge linking Denmark and Sweden), despite the fact Danish and Swedish workers carried out the same types of tasks and utilised the same reporting procedures for occupational injuries.
As to the incidence of, for example, job strain (i.e. jobs where the demands facing workers exceed the resources at their disposal), however, the differences between Denmark and Sweden are insignificant (OECD, nd-a).
The labour market
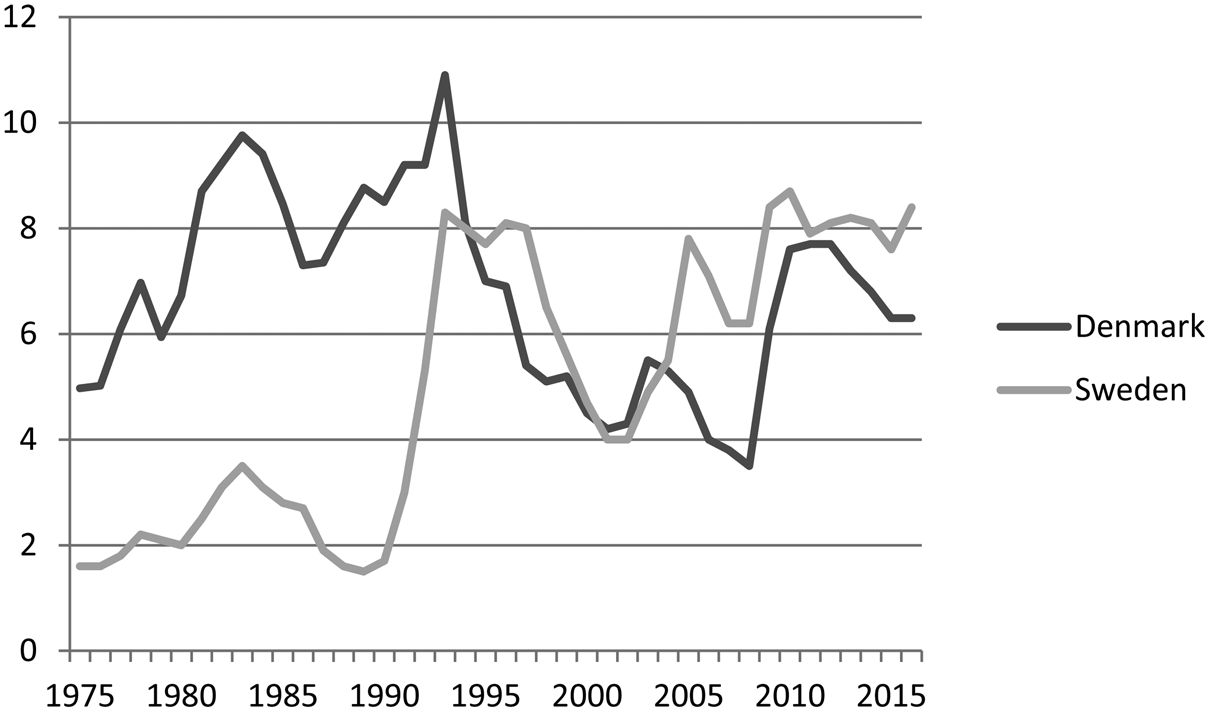
As argued by Ebbinghaus and Hofäcker (Reference Ebbinghaus and Hofäcker2013), among others, high unemployment can potentially act as a catalyst for push. It is therefore interesting to note how unemployment patterns since the mid-1970s have been very different in Denmark and Sweden (cf. Figure 2).
Unemployment in Denmark and Sweden (percentages), 1975–2016.
Source: The figure builds on multiple data sources. The period since 1990 builds on fully comparable data from Nordic Statistics (nd). For Sweden, the earlier data stems from SCB (1985, 1993, 2001), while the Danish data are from Statistics Denmark (2014). Data from before and after 1990 is not entirely comparable. For example, according to SCB (2001), unemployment was 3.0 per cent in 1991, 5.2 per cent in 1992 and 8.2 per cent in 1993, while according to Nordic Statistics, it was 3.0 per cent in 1991, 5.3 per cent in 1992 and 8.3 per cent in 1993. These are very small deviations. This is also the case for Denmark.

The employment rate for those aged 55‒64 was virtually indistinguishable in the mid-1970s between Denmark and Sweden: 62 per cent in Denmark in 1976 (Statistics Denmark, 1977) and 62 per cent in Sweden in 1975 (SCB, 1981). But the employment rate for this demographic fell dramatically in Denmark thereafter. In 1996, the Danish employment rate had fallen to 50 per cent, whereas it increased to 64 per cent in Sweden (Eurostat, nd-a). The fall in Denmark was owing to Denmark ‒ like many other nations in western Europe at the time ‒ having accepted early retirement as a solution to rising unemployment levels in the 1970s and 1980s (push).
No such trade-off between high levels of unemployment and early retirement occurred in Sweden. Throughout the 1970s and 1980s, Swedish governments were able to keep unemployment down, as successive governments accepted a commitment to maintaining full employment (stay) through economic management and active labour market policies (Therborn, Reference Therborn1986). While unemployment did indeed increase dramatically in Sweden in the early 1990s for a short period and Sweden experienced a small dip in the employment rate among those aged 55‒64 in the period 1990‒1994, early retirement on a massive scale did not occur – or was not allowed to develop. This has contributed to the employment rate among the 55‒66 group almost constantly being 10 percentage points higher in Sweden than in Denmark as of the late 1980s. This ties in with empirical findings showing that early retirement did not develop in countries where unemployment has historically been low, while early retirement on a massive scale evolved in countries where unemployment has historically been high (Herbertsson, Reference Herbertsson2001).
Gender and public care provisions
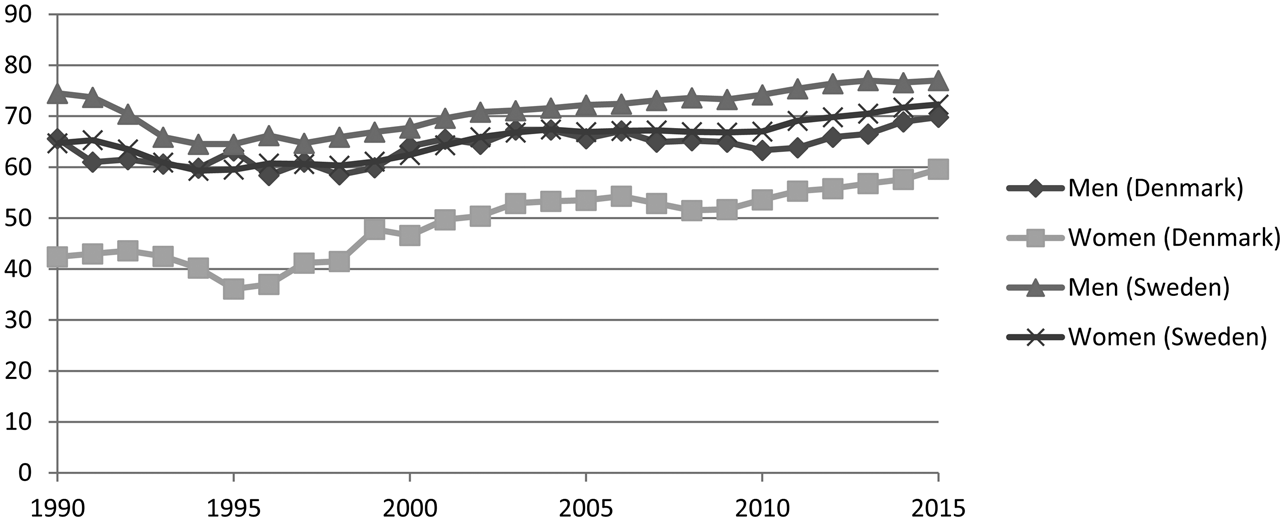
There is a relatively large difference in the employment patterns observed among 55‒64-year-old men and women. Figure 3 illustrates the gender-related employment rates for this age group in the period 1990‒2015. The most eye-catching detail in the figure is that Danish women in this age group have permanently had much lower employment rates than Danish men and Swedish women and men. In other words, many of the differences in the overall employment rates are gender-related. If Danish women were at all close to the same employment rate as Swedish women, the difference in overall employment rates between Denmark and Sweden would be negligible. Nevertheless, Figure 3 also reveals how the gender-related employment patterns have fluctuated over time. The employment rate generally fell for 55‒64-year-old people in the period 1990‒1996, after which the trend reverses. The increase in the employment rate of Danish and Swedish men and women must therefore be understood on the background of a more favourable employment situation, which began in the mid-1990s (see Figure 3).

Differences in female employment rates between Denmark and Sweden cannot be explained by differences in the provision of public care facilities (e.g. child and eldercare) between the two countries. This is important, as it is often argued that the capacity to work is restricted for individuals (usually women) who must provide unpaid care for grandchildren, their partner or older family members (e.g. Ginn et al., Reference Ginn, Street and Arber2001). In 2016, the coverage of eldercare (institutional care and home help) for those aged 65 or older was 15.2 per cent in Denmark and 13.1 per cent in Sweden (NOSOSCO, 2017: 169f). These differences are likely so small that they do not impact the differences in the employment opportunities of older workers. Employment rate differences among women are therefore more likely to be explained by differences in how couples synchronise retirement (jump).
Do couples synchronise retirement?
The decision to withdraw from the labour market is usually made in a social context. Spouses plan and co-ordinate their withdrawal from the labour market together, and as women are usually the younger part in a marriage, they typically leave the labour market at a younger age than do men (Blau, Reference Blau1998; Johnson, Reference Johnson2004). These tendencies reflect traditional gender roles (Arber and Ginn, Reference Arber, Ginn, Arber and Ginn1995), including how women earn lower wages than men. Numerous studies have thus pointed out how, from the perspective of the household, there is a tendency for the person in the household with the lowest income to leave the labour market first; alternatively, that spouses withdraw from the labour market at the same time in order to make the most of their free time together (see e.g. Hurd, Reference Hurd1998; Gustman and Steinmeier, Reference Gustman and Steinmeier2000; Coile, Reference Coile2004).
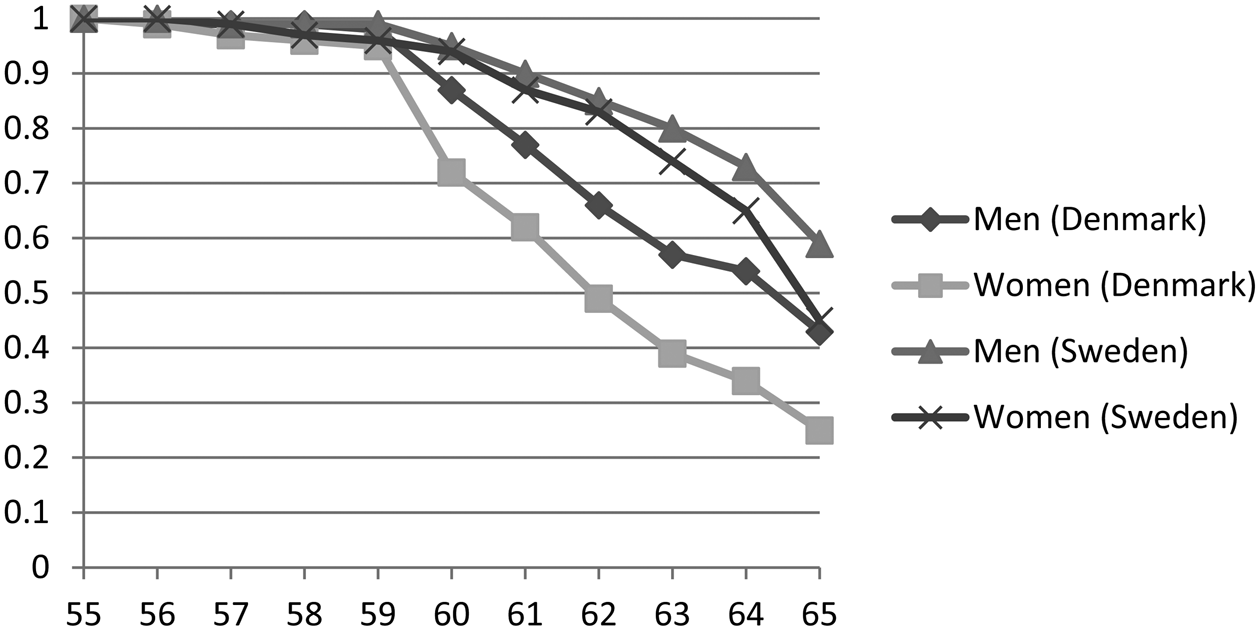
Figure 4 shows a survival curve for how the cohort aged 55 in 2003 and 65 in 2013 has left the labour market. At age 55 in 2003, the employment rate was 82 per cent for men and 76 per cent for women in Denmark, 81 per cent for men and 78 per cent for women in Sweden. The survival curves show marked differences between men and women. In both Denmark and Sweden, women retire at a younger age than men, indicating that spouses withdraw from the labour market at the same time in order to enjoy their third age together (i.e. they jump together). These tendencies are confirmed by Danish register-based analyses of how spouses withdraw from the labour market (e.g. Friis, Reference Friis, Andersen and Jensen2012), which show that if the spouse is outside the labour market and/or older than their partner, the probability for early retirement increases for men and women alike. Women usually being the younger part in a marriage presumably partly explains why women are, on average, almost two years younger than men when leaving the labour market.
Survival curves of retirees by gender (retirees were aged 55 in 2003 and 65 in 2013).

Although gender differences in survivor estimates clearly exist, the survival curves in Figure 4 are rather complex. The curve showing people leaving the labour market is very similar to the cohort turning 60 years of age. The curve then falls dramatically among Danish men and very dramatically among Danish women. The fall in Sweden first occurs when the cohort turns 61‒62 years. As expected and similar to Denmark, the fall in Sweden is stronger for women than men. Rather remarkably, however, labour-market survival rates after turning 60 are higher for Swedish women than for Danish men. That the curves fall after turning 60 in Denmark and at age 61‒62 in Sweden reflects to some degree the construction of the pension and early retirement schemes in the two countries. One might therefore argue that the pension systems function as normative and symbolic signals for when one can afford ‒ and with a clear conscience permit oneself ‒ to withdraw from the labour market (pull). But the pension and early retirement systems in themselves cannot explain the gender differences in the withdrawal patterns. Here, marital relationships undoubtedly play a major role for gender-related withdrawal.
The significance of the social context for retirement patterns also becomes apparent when considering the average effective age of retirement. In 2014, the average age of retirement in Denmark was 63.0 for men and 60.6 for women, while it was 65.2 for men and 64.2 for women in Sweden, meaning that Danish women retire on average 2.4 years earlier than Danish men, while Swedish women on average only retire 1 year earlier than Swedish men (OECD, nd-b). This indicates that Danish couples synchronise their retirement to a higher degree than do Swedish couples. It is worth mentioning that while the gap between the average age of retirement for men and women fluctuates from year to year, it is consistently smaller in Sweden than in Denmark.
This is further supported by the fact that single women in Denmark retire on average two years later than do married women (Nielsen, Reference Nielsen2004). Here, ‘stuck’ factors are possibly at play; both that it is more difficult for singles to make ends meet and that singles risk becoming socially isolated (see also Eismann et al., Reference Eismann, Henkens and Kalmijn2019).
Pension and early retirement systems
At age 65, all ‘full’ citizens in Denmark and Sweden are entitled to receive a tax-financed basic state pension amounting to €860 per month in Denmark (Folkepension) and €767 in Sweden (Garantipension). The basic pension is topped up by a means-tested pension supplement. Given that a full pension supplement is added to the basic pension, post-tax pension income in 2016 was €1,725 per month for a single person in Denmark and €1,174 in Sweden (NOSOSCO, 2017: 154). This means that the risk of poverty is more than twice as high among Swedish seniors (age 65 and older) than in Denmark (i.e. 18.3% versus 9.9%; Eurostat, nd-b).
In both countries, the means-tested pension supplement is scaled down against the pensioner's own earnings-based pension. Hence, parallel to tax-financed and citizenship-based pensions, Denmark and Sweden have both established occupational pension schemes (coverage is 90% of all full-time employees in Denmark, while almost all employees are covered in Sweden). These schemes are constructed on defined contribution principles, meaning that income-related pensions depend on individual contributions, returns on invested capital and retirement age. In other words, the longer retirement is postponed, the more the occupational pension income increases (Andersen, Reference Andersen and Ebbinghaus2011; Barr, Reference Barr2013).
The state pension age in Denmark and Sweden is 65, but both countries also have voluntary early retirement options. In Denmark, contributors to a special early retirement scheme can freely choose to retire between 60 and 64 (entitlement requires 25 years of contribution), although the early retirement age will be raised to 64 (and pension age to 67) by 2023, and the duration reduced from five to three years; early retirement benefits amount to roughly €28,000 annually. No special early retirement scheme exists in Sweden, as voluntary early retirement opportunities are part of the ordinary occupational pension scheme. Swedes can choose to opt for retirement at age 61. Danes can also draw on their occupational pensions five years before the state pension age.
In both Denmark and Sweden, early retirement is punished financially. A common feature of the occupational pension system (Pillar 2) in Denmark and Sweden is, thus, that the later pensions are drawn, the higher the benefits. As most of the pension income in Sweden is income-related, however, Swedes are punished harder than Danes for retiring early. Swedes retiring at age 61 (or having only participated in the labour market for part of the lifecourse) may be left with the rather poor state pension (Garantipension + pension supplement) and run the risk of ending in poverty. Similarly, early retirement affects the size of occupational pensions in Denmark, since early retirement reduces the number of contributions to the occupational pension scheme and pensions are reduced accordingly. However, Danes left with poor occupational pensions can fall back on the relatively generous Folkepension (+pension supplement), helping early retiring Danes to escape the risk of poverty as pensioners. In effect, the Swedish pension system can be argued to encourage prolonging working life in a ‘stuck’ perspective, whereas the Danish system ‘pulls’. Accordingly, Nilsson (Reference Nilsson2012) has found that Swedes tend to remain in the labour market until they acquire a sufficient pension.
The cut-off year for this paper is 2015. It should therefore be mentioned that pension reforms have subsequently been implemented in both Denmark and Sweden to boost the labour supply, although these reforms do not influence the present analysis. In Sweden, as mentioned, the system was designed in such a manner that the occupational pension scheme provided the option to begin receiving one's pension at age 61 and that one had to leave the labour market at age 67 unless the employer wishes to extend the employment full-time or part-time. Beginning in 2020, these age limits have been changed to 62/68, to 63/69 in 2023 and to 64 in 2026. At the same time, access to the Garantipension will be raised to age 66 in 2026 and 67 in 2026.
In Denmark, the retirement age will be set to follow the development in average life expectancy, the target being that Danes must, on average, only receive the Folkepension for 14.5 years. In 2030, the retirement age is expected to be 68 and 71.5 in 2050 (European Commission, 2017). Pensions from the occupational pension scheme can be received five years prior to the age for the Folkepension. In contrast to Sweden, Denmark has no mandatory retirement age.
The disability pension
The disability pension ‒ Førtidspension in Denmark and Sjuk- ogch aktivitetsersätning in Sweden ‒ represents an important pathway out of the labour market (NOSOSCO, 2017). Tax-financed in Denmark, it is based on insurance principles in Sweden. In both countries, disability pensions are paid to those whose work capacity is fully or partially reduced (push), and measures have been initiated in both countries since 2003 to reduce the number of recipients. In 2013, around 7.1 per cent of the total population aged 20‒64 received a disability pension in Denmark, while the same figure was 3.4 per cent in Sweden.
The difference in disability pension take-up rates can likely be ascribed to the Swedish labour market being more inclusive than in Denmark. In 2011, the employment rate among disabled persons was 66.2 per cent in Sweden and only 46.7 per cent in Denmark, meaning that the employment gap between persons with no disability and persons with disabilities was 9.5 percentage points in Sweden (among the lowest in Europe) and 31.4 percentage points in Denmark (among the highest in Europe) (Eurostat, 2014). This emphasis on creating space for vulnerable groups has contributed to increasing the employment figures among Swedish seniors (stay).
Conclusion
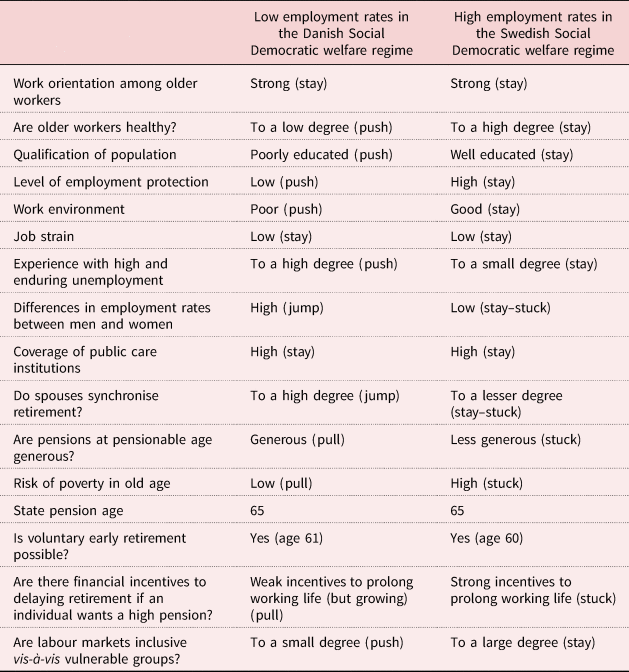
A major research interest of this article has been to come to grips with differences in the employment rates of older workers in Denmark and Sweden, two Scandinavian Social Democratic welfare regimes marked by a relatively strong work orientation. A case-oriented strategy has been employed, meaning that similarities and differences among a limited number of cases (Denmark and Sweden) have been examined. Findings have been summarised in a matrix or (truth) table (see Table 3) showing the values of our observational units, i.e. are they present/absent, high/low, etc. Using simple logical principles, the aim of the following is to interpret how our observational units (or configurations of factors) relate to one another or combine in certain manners, thereby producing different outcomes; that is, high versus low employment rates among older workers.
Factors conditioning employment rates among seniors
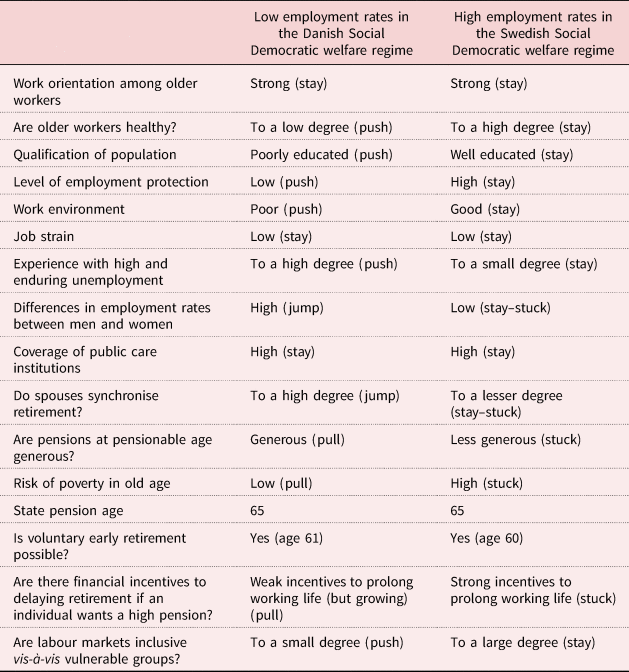
As can be seen in Table 3, there are some similarities between the two countries. The state pension age in both is 65, and older workers in both countries can voluntarily retire early around age 60 (60 in Denmark, 61 in Sweden). These similar symbolic or normative signals are associated with different outcomes, however, meaning, among other things, that the state pension age cannot be understood as a ‘natural’ reality independent of its social embeddedness and how it relates to other factors conditioning the timing of retirement. The interplay of factors – or systems of relationships – enacting low versus high employment rates in Denmark and Sweden can be summarised as the following combination of parts.
The combination of conditions that have produced low (relative to Sweden) employment rates in Denmark are structured around the following characteristic patterns of interaction:
• Structural features of the population are that education levels are low and health is poor; both supportive of push.
• The characteristics of the population have been framed by exclusive labour markets (push); Denmark has suffered high, enduring levels of unemployment, and the inclusion of vulnerable groups has been very low.
• At the company level, Denmark is marked by a poor work environment and low levels of employment protection; both conducive to push.
• Pension and early retirement systems are rather generous, and voluntary early retirement has no repercussions for future pensions. This is supportive of pull.
• Labour-force participation among women is very low, indicating that spouses synchronise retirement, which is a jump phenomenon.
In contrast, loops (or combinations of conditions leading to high employment rates) in Sweden run as follows:
• The population is well educated and in good health, which stimulates stay.
• Historically, Sweden has not experienced unemployment on a massive scale, as unemployment has been kept low at historically decisive points in time, and the labour market is highly inclusive vis-á-vis vulnerable groups. The Swedish labour market is, thus, very inclusive, which encourages stay.
• At the company level, there is a good work environment and employment protection is strong. This encourages stay.
• The pension system encourages older workers to prolong their working life. Early retirement means cuts to future pensions; pensions are not generous, and a considerable percentage of pensioners experience poverty. This is supportive of stuck.
• Female employment rates are high and not very different from male employment rates. Given that women are the younger part in a marriage, this indicates that marital relationships play a minor role in gender-related withdrawal.
In summary, a combination of push–pull–jump factors can be said to predominate in Denmark, whereas a stay–stuck combination prevails in Sweden. This produces low employment rates among older workers in Denmark and high employment rates in Sweden.
Discussion
Sweden, with its impressive, high employment rates in the older segment of the labour market, could stand out as a role model for other countries. Nevertheless, it is important to be careful with respect to specific policy recommendations on the basis of the Swedish experience. The point is, thus, that the high Swedish employment rate is not the result of any single policy but rather a combination of factors. For example, there is obviously a connection between the level of education and the employment rate. But other countries are not necessarily going to achieve the Swedish employment figures merely by increasing the level of education among seniors to Swedish levels. Thus, the marked differences in the survival rates among highly educated Danes and Swedes clearly show that equally educated people do not retire at the same age in different social contexts, meaning that even among the highly educated, one's retirement pattern is framed by the historical, social, economic and political development of a given society. This also means that future research should focus on the extent to which and under what conditions individual policies (e.g. education initiatives) have similar effects in different social contexts, and how they impact the behaviour of men and women differently.