INTRODUCTION
The basis of the nitrogen fertilizer recommendations for sugarbeet crops grown in England, as published by MAFF in 2000 (Anon 2000; hereafter referred to as RB209), is that fertilizer N, either from inorganic sources or from manure, should supplement the nitrogen supplied by the soil. Similar approaches are used in Belgium and France (Machet & Hébert Reference Jaggard, Qi and Draycott1983), while in Germany and Austria a soil analysis method (electroultrafiltration) estimates available N and readily mineralizable N (N min) to modify the need for fertilizer (Recke & Nemeth Reference Recke and Nemeth1985). The potential yield of the crop is not considered as a factor contributing to the variations in the optimum dose of N fertilizer at present, unlike the case of some systems used for winter wheat.
The soil nitrogen supply (SNS) is made up of two parts, N that is available at the beginning of the period of rapid uptake by the crop and N that becomes available subsequently as a result of mineralization of organic matter in the soil. The first of these parts can be assessed by soil sampling and direct measurement, by modelling or by estimation on the basis of soil type, rainfall and previous crop. Thus an essential part of the recommendation system, for sugar beet or any other crop, is the SNS. However, an analysis of 35 N fertilizer experiments made in the 1980s found no relationship between optimum application of N fertilizer and soil mineral nitrogen (SMN) (at sowing or in May) on mineral soils to which no organic manure had been added since the previous summer (Allison et al. Reference Allison, Armstrong, Jaggard, Todd and Milford1996). Such crops represent more than 0·65 of all sugarbeet grown in the UK. This contrasts strongly with the meta-analysis of winter wheat by Goodlass et al. (Reference Draycott, Webb and Wright2002), who found that factors associated with soil N supply accounted for 0·51 of the variation in the optimum N fertilizer amount (N opt). Clearly there is a need to reappraise the basis of N fertilizer recommendations for sugarbeet, especially as estimates of inorganic N fertilizer use on beet indicate that, on average, applications to the national crop exceed the RB209 recommendation by about 0·10 (i.e. c. 11 kg N/ha). The present paper presents an analysis of 161 yield responses of sugarbeet measured since 1980, of which the 35 described by Allison et al. (Reference Allison, Armstrong, Jaggard, Todd and Milford1996) are a subset. The analysis started by fitting three models to each of the yield responses, and then analysed the N optima determined by the most appropriate of these models in order to find the best, field-specific predictors of the amount of fertilizer that should be applied.
MATERIALS AND METHODS
Data sources
The experiments cited in the present study were distributed throughout the areas of England used for beet production at the time; most were sited in commercial farm crops. All experiments included an unfertilized control, 14 had four N treatments, 31 had five, 52 had six, 63 had seven and one had eight N rates. All experiments tested a maximum fertilizer application of 150 kg N/ha or more. All experiments had three or more replicates and more than 20 residual degrees of freedom. The harvested area per plot was always more than 15 m2 and all of the roots were washed before being weighed and sampled to assess yield. Sugar and impurity concentrations were always assessed using a brei sample prepared and analysed according to the standards approved by International Commission for Uniform Methods of Sugar Analysis (ICUMSA) (Anon 2005). The data and a list of sources are available from the authors.
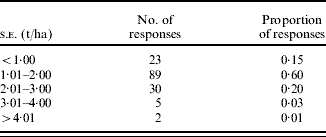
With the exception of treatments designed specifically to manipulate the nitrogen supply, all experiments were managed using commercial and recommended agronomic practices, e.g. all experiments were drilled to a stand. Treatments designed to manipulate N supply included N fertilizer application, organic manure application, the incorporation of straw after cereal harvest, growth of cover crops before beet, late winter irrigation to simulate a wet winter and leaching. With the exception of applications of mineral N fertilizer and organic manures, none of these treatments significantly affected N optima. Details of the standard errors were available for 149 of the 161 responses. These responses have been classified according to the standard error of the mean beet root yield in Table 1. Most responses had s.e. values of 1–2 t/ha, and the average was 1·7 t/ha. This equates to 0·03 of the average yield.
Distribution of the number of nitrogen fertilizer responses as classified by the standard error (s.e.) of the mean beet yield (n=149)

Response functions
Various response functions have been reported to describe the relationship between crop yield and the applied nitrogen (N) amount. These include quadratic, bilinear–plateau, quadratic–plateau, exponential and exponential plus linear models. By examining the scatter diagrams for all the N response experiments, the bilinear–plateau, exponential and exponential plus linear models (George Reference Draycott1984; Cerrato & Blackmer Reference Bürcky and Biscoe1990) were chosen as candidates to account for the variance of each data set.
In all cases, the models were fitted to the root yield (fresh weight, t/ha) adjusted according to the sugar concentration on the basis of the factors published in the Interprofessional Agreement between the National Farmers' Union and British Sugar plc. in 2002 (Anon 2002). These factors are those used today to determine the value of beet; they approximate to a standardization of root weight to a sugar concentration of 160 g/kg.
The exponential model is the Mitscherlich exponential equation defined as

where Y is the adjusted root yield (t/ha) at a particular application of nitrogen fertilizer (N, kg/ha), Y 0 the adjusted root yield at zero N, ΔY max the maximum yield increase (i.e. the response limit) ranged between Y 0 and the maximum yield attainable, and k the rate constant. The first derivative of the Mitscherlich exponential equation was equated to the ratio of the fertilizer price to the beet root price (P r) in order to determine the economic optimal N application (EONR), as follows:

The exponential plus linear model, used for sugar beet by Allison et al. (Reference Allison, Armstrong, Jaggard, Todd and Milford1996), is defined as

where Y is the adjusted root yield (t/ha) at a specified application of nitrogen (N, kg/ha), and a, b, r and c are values obtained by fitting the model to the data. EONR was determined by equating the first derivative of the exponential plus linear equation to P r so that

The bilinear–plateau equation (Boyd et al. 1970) assumes a linear increasing response of root yield to applied N until a defined point, beyond which the yield does not respond to additional applied N. This relation is mathematically defined as


where Y is the adjusted root yield (t/ha) at a particular nitrogen fertilizer application (N, kg/ha), N opt the optimum N application at which the maximum adjusted root yield is obtained, and a and b are determined by fitting the model to the data. This bilinear–plateau relationship can be modified to the broken bilinear model to account for the decreasing yield response to amounts of N beyond the optimal application. The broken bilinear model is defined as


where c is the parameter that determines the intersection point; other parameters are defined as above.
Since the descending portion of the broken bilinear model response is of little practical interest, the values of EONR are identified by locating the intersection of the two lines for both the bilinear–plateau and the broken bilinear models. However, the utility of EONR should be judged by comparing the first derivative (i.e. the value of slope of the ascending portion of the fitted curve – b) with the selected N fertilizer-to-beet price ratio (P r). If the estimated value of b is smaller than the selected P r, there is no economic benefit in applying any fertilizer N.
Selection of the most appropriate response function
The best estimates of model parameters for the selected equations were found using the SYSTAT (SYSTAT 9 for Windows, 2004) for each of the 161 responses. SYSTAT uses the Marquardt–Levenberg algorithm to estimate the values of model parameters that minimize the sum of the squared differences between the observed and the predicted values of the dependent variable. To select the most appropriate response function, the variance accounted for (R 2) and the significant level for the F test were compared between response functions. The variance accounted for is a measure of how well the response equation describes the data. The significance level is the probability of being wrong in concluding that there is an association between the adjusted root yield and the N fertilizer application.
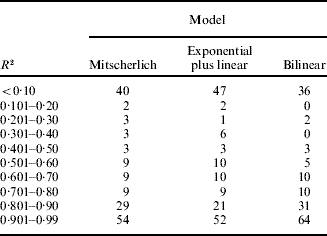
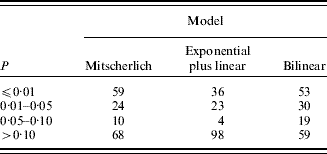
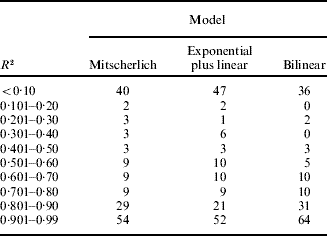
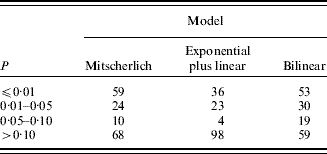
All three models had a similar number of experiments where the proportion of variance accounted for was less than 0·1 (Table 2). However, the bilinear model accounted for more than 0·80 of the variance in 95 experiments, compared to 83 and 73 for the Mitscherlich and exponential plus linear models, respectively. The Mitscherlich and bilinear models each had 83 experiments showing a significant relationship (P⩽0·05) between the adjusted root yield and the fertilizer N applications (Table 3), whereas the exponential plus linear model had only 59. The bilinear model had the fewest experiments where the significance of the fit was poor (P>0·1).
The distributions of experiments according to proportion of variance accounted for (R2) when three models were fitted to the data (n=161)
The distribution of numbers of experiments by probability (P), where three different models were fitted to the data (n=161)
The Mitscherlich equation fits well those cases where initially the yield responds positively and approaches more and more closely to the maximum (i.e. an asymptote) as N application is further increased. In the present data sets, this model failed where the yield did not increase initially and where yield was less when large amounts of nitrogen were applied. This shortcoming is overcome by the exponential plus linear model, but it only fits data well if the N application rates are large enough to produce a descending portion of the response. The current data sets had few such experiments. The exponential plus linear model produced N optima successfully for sugar beet in the report by Allison et al. (Reference Allison, Armstrong, Jaggard, Todd and Milford1996) because they corrected and adjusted yields of clean beet (CACB) by subtracting a weight of beet equivalent in value to the cost of the N fertilizer. By doing so, the N response at high rates was made negative. However, this has the disadvantage that the model must be refitted to the data every time the beet or fertilizer prices change significantly. For both the Mitscherlich model and the exponential plus linear model, the values of estimated parameters were sometimes absurd, usually due to few points on the asymptotical response range or lack of any descending response at large N rates. By contrast, the bilinear model is simple and described the yield response curves in most of these sugar beet experiments, as in those by Boyd et al. (1970). It directly estimates the optimal N rate for achieving the maximum sugar yield. A feature of the bilinear model is that it produces smaller optimum fertilizer values than either the Mitscherlich model or the linear plus exponential model, even when fitted to the same set of data. Thus, the choice of model can have important commercial and environmental implications. After considering these factors, the bilinear model was adopted to describe the adjusted root yield response to applied N rates for each experiment in the present study.
Determination of optimum N for maximum adjusted root yield
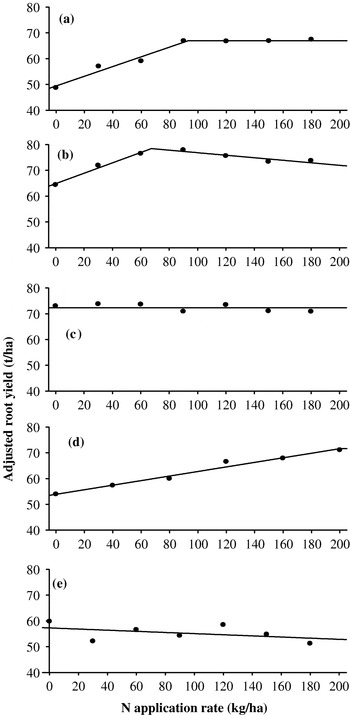
While fitting the bilinear model to data points in each experiment, five response curve types were identified (Fig. 1). The number of responses in each category is shown in the caption to Fig. 1. Most responses (119+15) were of the types that produce a clear optimum, at the point where the slope of the line changes abruptly. There were no responses with a significant slope for the upper line of the bilinear fit. The responses that fell into the category of a zero or a negative slope (16+10) were almost all from black Fen soil or from sandy fields treated with poultry manure. Only one response (from Broom's Barn) failed to reach an optimum: there the yield given by 200 kg N/ha was not significantly greater than that given by 120 kg/ha and a response in an adjacent experiment reached an optimum at about 100 kg/ha.
Types of response of adjusted root yield to N application. The number of trials identified in the present study for response types (a), (b), (c), (d) and (e) was 119, 15, 16, 1 and 10, respectively.

The optimum N (N opt) for maximum adjusted root yield was identified by locating the intersection of the two lines for the bilinear–plateau and the broken bilinear equations. Where the only line was horizontal or had a negative slope, the value was assumed to be zero. For the response type with a continuous increase in adjusted root yield, the value of N opt was assumed to be the largest N application rate in that experiment.
From the fitted relations, the following characteristics of the responses were calculated:
• adjusted root yield without fertilizer nitrogen (Y 0) (an indicator of the natural fertility of site);
• maximum adjusted root yield (Y max), the yield when N was set to N opt;
• the response limit (ΔY max), the difference between Y 0 and Y max; and
• the nitrogen response rate (N res), kg of the adjusted root yield per kg of fertilizer nitrogen.
RESULTS
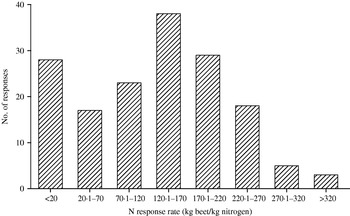
The use of a model with a linear response up to the optimum allows the N response rate (kg of beet/kg N) to be used to judge the economic justification for an application. It was assumed that by 2009 the beet prices per adjusted tonne will be £24 for quota production and that either surplus production will attract a similar price or few growers will plan to produce it. A range of fertilizer prices were also assumed, £0.80–1.40/kg, as a response to the rapid changes in the market during 2008. Farmers' delivered yields are likely to be only about 0·75 of the yields obtained in experiments (Scott & Jaggard Reference Scott and Jaggard1992) and so their response rates for quota production and fertilizer at £0.80/kg N need to be about 44 kg/kg to be worthwhile. Of the 161 responses, 35 had rates less than this (Fig. 2): the sites that these represent should not receive any N fertilizer. The mean response rate was 130·4±91·1 kg/kg. These economic considerations take no account of the cost of applying the fertilizer, usually estimated at c. £10/ha (Nix Reference Nix2006).
Frequency distribution of nitrogen yield response rate (all responses, n=161).

The 14 responses based on an unfertilized control and three fertilizer amounts were temporarily set aside but not discarded because 10 of them represented soil types or manuring practices that were rare elsewhere within the dataset.
Site characteristics and optimum N fertilizer application
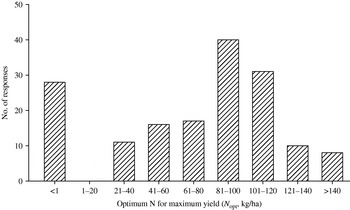
The distribution of N opt is shown in Fig. 3; 0·18 of sites, mostly peat soils or fields that had received large amounts of organic manure recently, did not produce a positive yield response to N fertilizer. Most sites required between 80 and 120 kg N/ha for maximum yield; 0·95 of responses had N opt of less than 130 kg/ha.
The frequency distribution of the optimum nitrogen fertilizer application (N opt) for maximum crop yield (all responses, n=161).

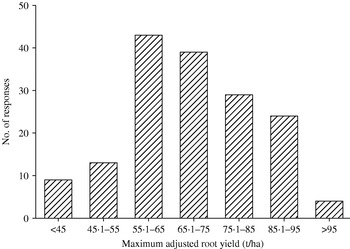
The range of yields with fertilizer N (Fig. 4) was approximately representative of current yield distribution in the commercial crop, despite some of the data being 27 years old. If anything, the data are skewed towards high yields. However, these yields were from experiments: commercial yields are, on average, only about 0·75 of the yields in experiments (Scott & Jaggard Reference Scott and Jaggard1992).
The frequency distribution of maximum adjusted root yield (all responses, n=161).

All the responses were classified according to the recent use, or not, of organic manure. Excluding the 14 experiments with only four-point responses, there were 120 without manure and 27 to which organic manure was applied between harvest of the previous crop and the preparation of the seedbed for the beet. These two groups have been treated separately.
Crops grown without organic manures
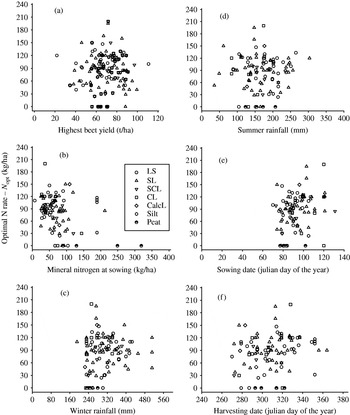
There was no evidence of a relationship between yield (without or with N) and the optimum fertilizer application (Fig. 5 a).
The lack of relationship in each response experiment between N opt of the sugar beet crop and (a) maximum adjusted root yield, (b) the amount of mineral N measured at sowing, (c) rainfall between 1 October and 31 March inclusive, (d) amount of rainfall plus irrigation in June–August inclusive, (e) sowing date and (f) harvesting date. All beet crops were preceded by a cereal crop and were grown in soil that had not received a recent application of organic manure.

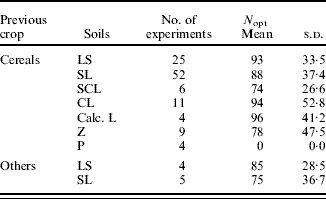
The texture of the plough layer soil was classified when the experiments were established. The detailed classifications have been grouped as follows: loamy sand (LS), sandy loam (SL), sandy clay loam (SCL), clay loam (CL), silty loam (ZL), calcareous loam (Calc. L) or peat (P). The previous crop was recorded for the 120 responses without organic manure; almost all were for beet after a winter cereal, mostly wheat or barley (Table 4). Three responses had beet after spring barley and only nine were for beet following a non-straw crop (1 potatoes, 2 grass, 2 parsnips and 4 peas). The dominance of cereals as the previous crop in these series of experiments is representative of the commercial condition, where the British Sugar Crop Survey shows that more than 0·90 of the area sown with beet each year grew cereals in the previous season (P. J. Jarvis, personal communication).
The mean and standard deviation (s.d.) of the optimum nitrogen applications (Nopt) differentiated according to previous crop and soil texture (sites without organic manure) (n=120)
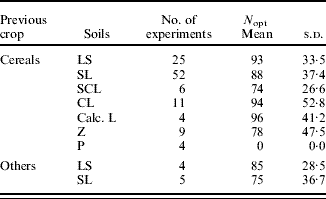
All the peat soil sites had zero response to N (Table 4). Two of the sites with 4-point responses were also on peat soils; one of these had a zero optimum; the other had an optimum of 50 kg N/ha, but the yield increase was not large enough to be significant, even with six replicates in the experiment. The mineral soils did not differ significantly in their mean optima, which averaged 88 kg N/ha. The standard deviations of the optima were usually one-third to one-half of the mean.
There was a tendency for the beet following non-straw crops to have a smaller N opt (by about 10 kg N/ha) than beet on similar soil after a cereal (Table 4). On the basis of previous recommendation systems, the previous crops that might generate reduced N opt are peas, grass and potatoes, all of which might leave large residues of easily mineralizable N. Four of the sites were after peas (mean N opt 87 kg/ha), one after potatoes (N opt 127 kg/ha) and two after grass (81 kg/ha). Two beet experiments were preceded by parsnips, which are fertilized like carrots and seem unlikely to leave a large mineral N residue. These two responses were preceded by soil mineral N measurements at the time of sowing, which were 133 and 56 kg N/ha. The first of these is larger than average, the other is within the range expected for analyses in the spring following a cereal crop and yet the optima were 40 and 50 kg N/ha, respectively.
Soil mineral N was measured at or near the time of sowing in layers 300 mm deep to a depth of 900 mm in 110 of the 120 responses. However, in many cases only the mineral N total to 900 mm was reported, not the values for each layer. There was little if any predictive power in the relationship between soil mineral N to 900 mm and N opt (Fig. 5 b), as was found by Allison et al. (Reference Allison, Armstrong, Jaggard, Todd and Milford1996) when using a subset of these data. The very unusual optimum of 200 kg/ha occurred at Broom's Barn where the soil contained about 50 kg/ha of available N, an amount that was not uncommon. Sites with more than 250 kg/ha of available soil N had optima of zero. However, simply classifying the soil as peat was a better predictor of N fertilizer need than a measure of the amount of N available in these Fen soils.
Correlation statistics were calculated between N opt and various site and crop characteristics. N opt was not related to rainfall during the winter (from October to March inclusive) preceding the beet crop (Fig. 5 c). Rainfall data were collected on the site of the experiment or, failing that, on the nearest official Meteorological Office site. There was no relationship between these two factors. The wettest winter was at Broom's Barn in 2000/01, and experiments nearby on SL soil during the next season had optima ranging from 50 to 120 kg N/ha.
One experiment at Broom's Barn, in 1984, was deliberately set up to manipulate residual N by over-winter fertilizing and irrigating. The N min values at the time of sowing were 212, 119 and 78 kg/ha and the N opt were 85, 130 and 121 kg/ha, respectively. Increasing the SMN by 134 kg reduced the N opt by 45 kg/ha, but increasing the SMN by 41 kg hardly affected N opt at all.
If summer rainfall is plentiful or if the soil is irrigated, then the amount of N mineralized and used by the crop might be expected to increase: this might reduce the need for fertilizer N. This idea is not justified by the results plotted in Fig. 5 d. There is also the risk that heavy rain will leach mineral N down the soil profile and out of the reach of the plants’ roots. In 1983, rainfall in April and May was about double the long-term average (231 and 205 mm of rain at Gleadthorpe and Broom's Barn, respectively). In an experiment on the Bunter sand in Nottinghamshire, the top 500 mm of soil in late May contained only 73 kg N/ha, where 120 kg/ha had been applied (as ammonium nitrate) on 17 March. As a consequence, yield was low, except where an additional 60 kg N/ha was applied as a top dressing at the end of May, increasing the adjusted yield by 19 t/ha. On the SL site near Broom's Barn, the yield increase was smaller but still significant at 5 t/ha.
Effects of sowing and harvest dates on the N fertilizer requirement have been examined in the past because there were suggestions that late harvested crops would respond to more N (Draycott et al. Reference Chambers, Lord, Nicholson and Smith1973; Holmes Reference Gregory, McGowan, Biscoe and Hunter1972). As in those studies, the present data (Figs 5 e and f) show no relationship between the optimum N application and either the date of sowing or harvesting.
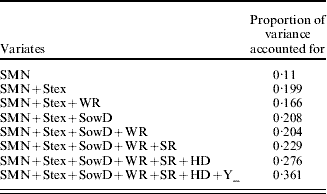
These were all uni-variate analyses, but recommendation systems to predict N opt are usually multivariate. For example, soil type, winter rainfall and previous crop are often considered in combination as a surrogate for a measurement of SMN in spring, or SMN plus soil type and previous crop might be used together as indicators of the N that will be available throughout the growing season. Like the UK's commercial beet crop, almost all of the experiments used in the analyses in the present paper were of beet following a cereal and only these data have been used in multiple linear regression analyses in an attempt to find combinations of factors that could predict N opt accurately. Measurements of SMN in spring accounted for only 0·11 of the variance among 101 responses (Table 5). The addition of the variable describing the soil texture of the plough layer increased this proportion to 0·2, but this was hardly increased further by the addition of extra factors that would be known at the time of sowing and therefore could be used in a prediction scheme (Table 5).
Proportions of Nopt variance accounted for by multiple linear regression analyses using data from sugarbeet experiments grown after cereals and on fields without recent additions of organic manures
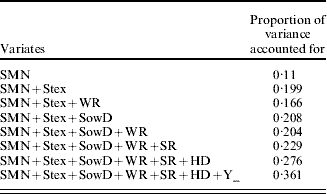
SMN, soil mineral N at sowing; Stex, surface soil texture; WR, winter rainfall; SowD, sowing date; SR, summer rainfall; HD, harvest date; Y, maximum adjusted root yield.
Multiple regression using SMN and soil texture predicted N opt values that were within 20 kg N/ha of the value estimated by fitting the bilinear model to observed data in 47 of the 101 cases. The average of the fitted N opt values was 88 kg/ha. Thus, in only about half the cases was the prediction within 23% of the observed value. The addition of factors for summer rainfall, harvest date and yield increased the proportion of variance accounted for to 0·36, but the values for these factors are not known at the time when the fertilizer must be applied (Table 5).
Among the 130 responses with no organic manure, 34 were measured at Broom's Barn in 15 of the last 27 years. N opt varied from 66 to 200 kg/ha on SL or SCL soils after at least two successive cereal crops within this 80 ha site. Within one season and one field it varied from 68 to 125 kg/ha, and in both cases the fertilizer application accounted for more than 0·8 of the variation in yield. With this amount of variation there is little chance of producing accurate, field-specific recommendations.
Crops grown with organic manures
Almost all sugarbeet in England is subject to the regulations governing actions within nitrate vulnerable zones (NVZ). In relation to arable farming, beet and manures, these are as follows.
1. From December 2006, all organic manure applications are limited to 170 kg/ha of total nitrogen each year averaged over the area of the farm not in grass.
2. On sandy or shallow soils, slurry, poultry manures or liquid digested sludge must not be applied between 1 August and 1 November.
There were 27 responses measured in the presence of applications of organic manure (farm yard manure (FYM), FYM+pig slurry or poultry manure). Manures were applied to all soil texture classes except peat.
The seven experiments to which FYM was applied (Table 6) had N opt ranging from 0 to 160 kg/ha. The zero responses occurred on two sites where the doses of manure were not specified, but were described as ‘frequent and heavy’. The other sites received about 30 t/ha, or about 180 kg/ha of total N; they all received this during the autumn or winter preceding the beet. Their soil mineral N at sowing averaged 88 kg/ha (compared to the general average of 72±48 kg/ha), their yield response to mineral N fertilizer averaged 8·4 t/ha and their N opt averaged 106 kg/ha. These results, where there was little influence of an average and infrequent winter dressing of FYM on the response to mineral N fertilizer, contrast with the findings of Draycott (Reference Cerrato and Blackmer1969), where 30 t/ha of FYM cut the need for N in 23 experiments from an average of 150 to 75 kg/ha.
The average effect of various types of organic manure on the response of beet yield to inorganic N fertilizer application (n=29)

The sites using FYM+pig slurry were selected originally to study the impact of large organic manure doses on beet impurities and the researchers were not surprised that the yield response to applied mineral N was zero. Nevertheless, the farmer's practice at that time was to apply about 100 kg N/ha of mineral fertilizer in addition to the manure.
There were 19 yield responses to N in the presence of poultry manure and some of the present experiments tested rates of manure application. Some used an autumn or early winter application date, as was common practice at that time. These often lost much available N or it was leached well down into the subsoil. In consequence, some of these sites had N opt values on the subsequent beet crop of about 100 kg/ha. Autumn application of poultry manure is now banned in every NVZ and early winter application is discouraged.
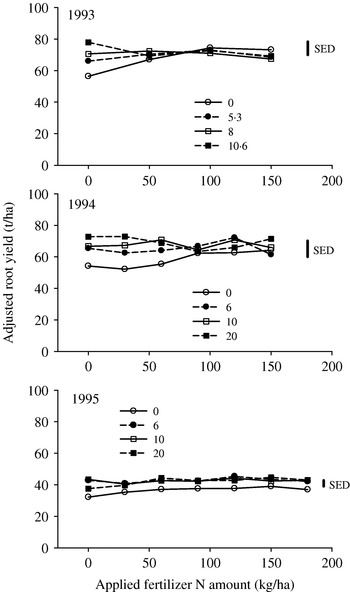
Almost all late winter or spring applications of poultry manure were in excess of 10 t/ha and grew crops, which did not respond positively to inorganic N. However, four experiments measured yield responses with or without late winter/spring dressings. In one of these, there was no positive response to inorganic N applications, whether poultry manure was applied or not. Results from the other three experiments are shown in Fig. 6. Where the manure dressings were small (c. 6 t/ha) and the amount of readily available N was estimated to be <150 kg/ha, the beet responded positively to about 60 kg N/ha. Larger dressings of manure reduced the N opt to zero.
Yield responses, in adjusted t/ha, to applications of mineral N fertilizer in the presence of various amounts (t/ha) of poultry manure.

Nitrogen fertilizer and beet quality
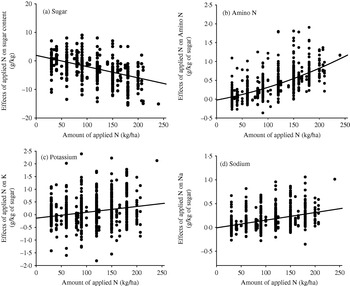
The chemical quality of beet is routinely measured in fertilizer experiments and many of the effects of N fertilizer are well known. The overall impact in these response trials is shown in Fig. 7 as the differences between those treatments given fertilizer and those given none. Nitrogen fertilizer usually decreased sugar concentration; on average, an application of 100 kg N/ha reduced it by 4 g/kg of beet (Fig. 7 a). Amino N concentration was increased slightly (0·32 g/kg sugar) by 100 kg N/ha of fertilizer, but this effect increased in the presence of excess N so that 200 kg/ha caused an increase of 0·84 g/kg sugar. The overall effect on potassium concentration was negligible (Fig. 7 c), but 100 kg N/ha increased the sodium concentration by 0·17 g/kg sugar (Fig. 7 d).
The effects of applied nitrogen fertilizer (N) on quality of sugarbeet roots. All relationships, except that for K concentration, are significant at P<0·01.

Impact of fertilizer application on gross margin
The present analysis has not produced a robust method to make field-specific N fertilizer recommendations for UK beet crops, except for crops grown on peat soil or crops receiving organic manures that contain much available N. In all other circumstances, the most appropriate approach is to make a uniform recommendation designed to maximize the economic benefit from using the fertilizer while avoiding undue damage to the environment. To determine this amount for beet grown on mineral soil and without a recent dressing of organic manure, the assumption was made that the distribution of the N optima in this collection of fertilizer yield responses was representative of the distribution that would be found in UK beet crops growing on these soils without organic manures. This seems reasonable: 0·93 of the responses were in beet following a cereal crop compared to 0·90–0·95 found in recent annual surveys conducted by British Sugar (P. Jarvis, personal communication). Similarly, the distribution of responses by soil type was within 0·1 of the surveyed distribution of soil types. The change in gross margin (£/ha) as a result of using N fertilizer at a cost of £0.80/kg was calculated for each response for applications of 80–140 kg N/ha in increments of 10 kg N/ha and for adjusted beet prices of £18–33/t. The changes in gross margins were also scaled to represent the response that is likely to be achieved in commercial practice (0·75) as well as the larger yield responses measured in experiments.
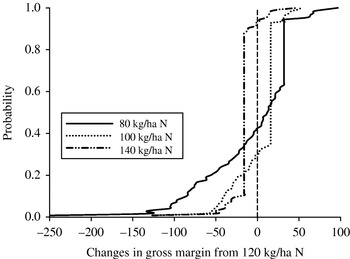
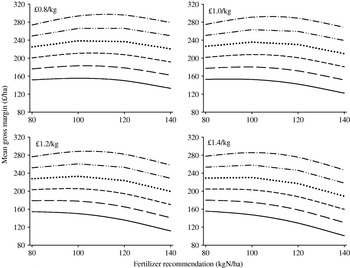
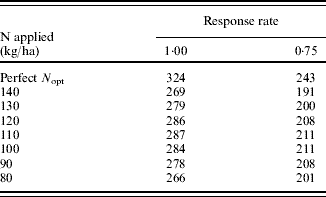
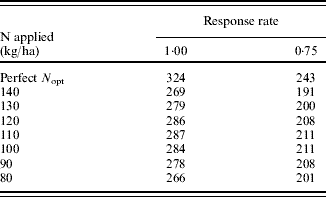
Excluding the 0·18 of yield responses where an application of a standardized amount of N fertilizer would be inappropriate (peat soils and those given organic manures), the mean gross margin gain from using any of the standard applications of N fertilizer was greatest at between 100 and 110 kg N/ha and was £211/ha at the 0·75 response rate (Table 7). The most appropriate standard amount was hardly affected by response rate. However, the gross margin gains have a large standard deviation. The impact of the standard deviation is illustrated for the 124 responses in Fig. 8, which shows the cumulative frequency distribution for changes in gross margins, relative to the margin generated by an application of 120 kg N/ha at £0.80/kg. Although the average optimum fertilizer application in these cases was 88 kg/ha, a uniform dressing of 80 kg/ha and a beet price of £24/t would result in a large loss of margin (>£50/ha) in about 0·2 of all fields. Almost all fields would suffer a loss of margin if the application of N fertilizer was 140 and not 120 kg/ha. The most appropriate application under these circumstances is between 100 and 110 kg/ha because about 0·7 of all fields would achieve bigger gross margins from applications of 100 instead of 120 kg/ha. If the beet price falls drastically relative to the fertilizer price, as might be the case if growers aimed to produce a large surplus, then the most appropriate fertilizer application would fall, as it will if the fertilizer price rises. Recently, N fertilizer prices have been rising rapidly and the beet price is uncertain. The effect of changes in these factors is illustrated in Fig. 9, where fertilizer prices above £1.2/kg have the effect of reducing the optimum application to no more than 80 kg N/ha if the beet prices fall to £18–21/t.
Cumulative probability distribution of change in gross margin (£/ha) from applying 80, 100 and 140 kg/ha of N fertilizer instead of 120 kg/ha, using an adjusted beet price of £24/t and a fertilizer price of £80/kg. The vertical dashed line represents the result of an application of 120 kg N/ha. The data were taken from experiments grown on mineral soil without organic manure applications.

The mean gross margins achieved at nitrogen fertilizer prices of £0.80–1·40/kg in relation to beet prices of £18 (——), £21 (– – –), £24 (- - -), £27 (· · · · ·), £30 (– · · – · · –) and £33 (– · – · –).

The mean gross margin gain (£/ha) achieved by using N fertilizer, calculated from the N response measured in 124 experiments on mineral soil types. The calculations assume that the optimum N dose was predicted perfectly and used in every case, or that the same fertilizer rate was applied to all fields. The beet price was assumed to be £24/t and the fertilizer cost £0.80/kg N. The beet yield and yield response to fertilizer were assumed to be equal to 1·00 or 0·75 of that achieved in the field experiments
DISCUSSION
Why is the bilinear yield response to fertilizer N the most appropriate model for sugarbeet crops, and why does the optimum application of inorganic N fertilizer not change inversely with the amount of available N measured in the soil at the start of the growing season?
The main features controlling the growth and yield of beet crops were recently reviewed by Milford (Reference Milford and Draycott2006) and Jaggard & Qi (Reference Holmes2006). Initially, in the UK, beet crops grow slowly, and for about the first 100 days after sowing this growth is dominated by the development of a full canopy of foliage. To maximize the sugar yield at any specified harvest date, it is necessary to expand this canopy as early and rapidly as possible in order to capture the maximum amount of solar energy, especially during the long bright days of May, June and July.
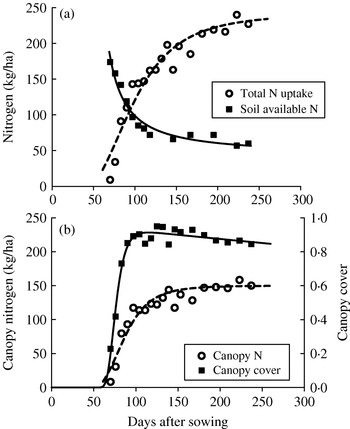
The environmental factors that have most control of the leaf expansion rate are temperature and the nitrogen supply. The rapid creation of a full foliage canopy (0·85–0·90 foliage cover) requires that the crop takes up about 110 kg N/ha (Malnou et al. Reference Malnou, Jaggard and Sparkes2006). The dynamics of some of these features are illustrated in Fig. 10, where the data were taken from an intensively monitored, high-yielding crop grown at Broom's Barn. The crop was grown with conventional husbandry and received 125 kg N/ha as ammonium nitrate fertilizer prills spread onto the soil surface at sowing (25 March 1982). This crop took 91 kg N/ha from the soil during the first 14 days of June and at the end of this period foliage covered 0·73 of the land area. During this time the fibrous root system was mostly confined to the plough layer (0·81 of the total root length) and was expanding from a clumped distribution that averaged 35 cm/cm2 to a uniform distribution of 60 cm/cm2 (Brown & Biscoe Reference Armstrong, Milford, Pocock, Last and Day1985). At the beginning of June, most of the roots were in the uppermost 100 mm, but 100 of the 171 kg N/ha was in the subsoil (Armstrong et al. 1986). This root system was taking up N at 6·1 kg/ha per day. To achieve this, it absorbed N at 0·124 mg/m of root per day and absorbed water at about 1·0 g/m per day. By contrast, a wheat crop might have 80 cm/cm2 of fibrous and seminal root by early April but will be absorbing water at only 0·2 g/m per day (Gregory et al. Reference George1978).
Changes in total nitrogen uptake and soil available nitrogen (a), and canopy nitrogen content and canopy cover (b) of a crop sown on 25 March 1982 that was supplied with a fertilizer dressing of 125 kg N/ha.

Having taken up sufficient N to produce a complete canopy, the N uptake rate of beet crops slows and dry matter is predominantly allocated to growth of the storage root (Fig. 10). Armstrong et al. (1986) found that N uptake during this period was very variable, from almost zero to about 1 kg/ha per day. Malnou et al. (Reference Malnou, Jaggard and Sparkes2007) found that providing additional N fertilizer to increase these uptake rates did not improve radiation use efficiency (RUE) or yield, even in a soil that was expected, on the basis of its low organic matter content, to supply little mineral N. It seems that during this phase of the crop's growth, either organic N in the soil is mineralized sufficiently quickly that the amount needed for growth is satisfied, or the plants redistribute N compounds from old leaves to new ones and so maintain RUE. This was shown by Bürcky & Biscoe (Reference Boyd, Tinker, Draycott and Last1983), who demonstrated that, during late summer and autumn, a conventional crop at Broom's Barn translocated 76 kg/ha of N from fully expanded leaves. This occurred in a crop whose leaf canopy completely covered the ground but never contained more than 125 kg N/ha. Van Egmond (Reference Van Egmond1975) showed that N started to be translocated out of leaves as soon as they reached their maximum size, before senescence symptoms appeared, and that this N moved to new leaves.
By harvest time, beet crops usually reduce the amount of available N in the soil to about 20–30 kg/ha; in this respect the 1982 crop illustrated in Fig. 10 left an unusually large residue. The amount of residual N seems hardly affected by the amount of fertilizer applied, as long as the latter is less than about 200 kg N/ha. For example, Allison et al. (Reference Allison, Armstrong, Jaggard, Todd and Milford1996) measured available N in soil to a depth of 900 mm at harvest in 34 experiments representing UK beet production, and found an average of only 22 kg/ha in plots without N fertilizer and only 30 kg/ha in crops given 180 kg N/ha in spring. Where N was very abundant throughout the crop's growth, much dry matter and therefore N was allocated to foliage in late summer, and the roots contained, on average, 130 instead of 57 mg of amino N per 100 g sugar, mostly glutamine. Thus, even crops with an abundance of available N leave little that is at an immediate risk of leaching into ground water.
In summary, high-yielding beet crops need a readily available source of N in the topsoil during May and June, when the root system is small and when it is necessary to expand the leaf canopy rapidly. This amounts to a finite N uptake (110–120 kg/ha) and no more. This amount must be taken up rapidly and by a small root system, most of which is still in the topsoil. Therefore a large proportion of this N comes from the fertilizer and this amount is hardly related to SMN measured in the 900 mm layer when the crop was sown. Soon after sowing, when beet plants are still small, much of the SMN will be in the subsoil or deep within peds and so is not readily available. Under these circumstances, a significant relationship between SMN measured in the topsoil and N opt might be expected. Unfortunately, the data were not sufficiently complete for this to be tested. However, this was one of the relations tested by Allison et al. (Reference Allison, Armstrong, Jaggard, Todd and Milford1996) whose data form a part of the dataset used in the present study. They found that the best relationship between N opt and SMN was with SMN in the uppermost 600 mm of soil, but they considered this to be an insufficiently accurate predictor to be of practical value.
Once a full canopy has been produced, beet seems to be able to continue to grow by a combination of scavenging recently mineralized N from the soil and by translocating N compounds from fully expanded leaves to other organs. Any surplus supply of N at this stage encourages surplus foliage production, at the expense of sugar storage and beet quality. Thus, there is no further yield increase through the application of more than what is needed to create a full canopy of foliage, the optimum application of fertilizer.
The condition in beet, where a source of N needs to be readily available in the plough layer of the soil because the root system is small during a critical period, contrasts strongly with winter wheat crops that already have a large and deep root system when rapid N uptake is required during May (Gregory et al. Reference George1978, Reference Goodlass, Sylvester-Bradley and Dyer1979). This contrast is illustrated by comparison of the proportions of variance in N opt that are accounted for by multiple regression, 0·36 in sugarbeet (Table 5) and 0·60 in winter wheat (Goodlass et al. Reference Draycott, Webb and Wright2002). The results of the analysis in the present paper also contrast strongly with some of the N fertilizer recommendation systems used for sugarbeet elsewhere in western Europe. There, systems based on SMN are the norm, despite studies in Belgium, The Netherlands and Germany where significant linear regressions between N opt and SMN measurements provided fertilizer recommendations that had average deviations from N opt of 30–40 kg N/ha (Neeteson & Smilde Reference Neeteson and Smilde1983). The system used widely in France is based on a balance sheet approach that also uses SMN measurements (Cariolle & Duval Reference Brown and Biscoe2005) and does not take account of possible mismatches between the time when N might be needed and the time when it becomes available. The present authors are not aware of any recent publications that have analysed the N fertilizer needs of other spring-sown crops in western Europe.
Much of the difficulty in finding useful relationships to predict N opt may be because N opt, as determined from experimental data, has a large error and its value is uncertain. This uncertainty is not estimated by most programmes that fit fertilizer response models to yield data.
During the analysis in the present paper, no good field-specific predictors of the optimum application of nitrogen fertilizer for beet crops grown on mineral soil without organic manure were found. However, analysis shows that, at current prices, 100–110 kg N/ha produces the maximum economic return for almost all of these fields, and the available N residue at harvest is small. Beet growing on peat soil (mostly in the Fens) has responded positively to fertilizer N in only one case, and this response was not significant. Therefore, beet growing on peat soils should not receive N fertilizer.
Cases where FYM was applied (typically about 30 t/ha) to mineral soil in the winter before the beet were sown provided little justification for the recommended N fertilizer amount to be changed from 110 kg/ha. The mineral N measured at sowing averaged 84 kg/ha for the FYM sites and 66 kg/ha for all of the mineral soils without organic manure. The manure clearly releases a small amount of N, and a reduction of fertilizer N of about 10 kg N/ha seems appropriate. This is a much smaller effect than was measured by Draycott (Reference Cerrato and Blackmer1969). The N applied in the manures was measured in most of their experiments, and the applications averaged 186 kg N/ha. The N applied in FYM in the trials made since 1980 has seldom been measured, but MANNER, the manure advice software, indicates that the N composition of today's FYM is almost the same as that of the 1960s (Chambers et al. Reference Cariolle, Duval and Draycott1999). Thus it seems unlikely that a decrease in the quality of FYM is the reason for the smaller effect on N opt.
Poultry manure contains much larger concentrations of readily available N, so much so that large doses can have a serious adverse impact on beet quality. Beet crops should not need mineral N fertilizer if they are grown on sites that received late-winter or spring applications of poultry manure that supply about 150 kg/ha of readily available N. Results in the present study indicate that small doses of N in poultry manure should be supplemented with 60 kg N/ha.
The 161 responses in the present study did not include any in beet crops following either outdoor pigs or heavily fertilized vegetable brassicas. These situations are rare in practice but seem likely to leave large residues of available N in the uppermost 600 mm of soil, perhaps enough to reduce the N fertilizer requirement to about 60 kg/ha. If these conditions become more commonplace, then it will be appropriate to conduct nitrogen fertilizer response experiments in some of these fields. However, the experiments are likely to be difficult to conduct with any precision following pigs, because available N is likely to be distributed very variably.
This review was funded by BBRO. Data from three experiments funded by DEFRA were kindly made available by B. J. Chambers.