Introduction
Since the Great East Japan Earthquake on March 11, 2011, many governmental and nongovernmental efforts in Japan have been sought in order to prevent any foreseeable consequences from disasters. Most of the implementation of prevention efforts for disasters has been based on structural and conventionalized regulations, such as Major Incident Medical Management and Support, Reference Mackway-Jones 1 - Reference Yagishita, Abe and Kisara 3 and thus, a scientific approach to disaster prevention has not gained much attention or interest from researchers or implementers. An interdisciplinary research team has developed a Ubiquitous Stereo Vision (USV) camera (National Institute of Advanced Industrial Science and Technology, Tsukuba, Ibaraki, Japan)Reference Yoda and Sakae 4 which can track and record human trajectories during an evacuation training session, such as the one at a large concert hall.Reference Yamashita, Soeda, Onishi and Noda 5 The system is designed for sensing human movements in a large, open space and keeps the trajectory record of such movements. In addition, this system is adapted to measure movements of triage doctors and mock patients, even in outdoor environments, which is not possible with other similar human-tracking systems, such as those at railroad crossings,Reference Yoda, Hosotani and Sakaue 6 edges of railway platforms (Figure 1; available online only),Reference Yoda, Hosotani and Sakaue 7 and the Expo Nagoya held in 2005 in Aichi Prefecture, Japan.Reference Yoda, Hosotani and Sakaue 8
As there are high societal demands for increasing the knowledge of evacuation and disaster prevention in Japan, particularly after the event in 2011, this scientific research method of an emergency drill session, and the measured human trajectories during the session around the triage post, should be introduced. With the pattern-recognition system, it has become possible to obtain all the trajectories of patient roles, all medical staff roles, and co-medical roles based on what is analyzable from the entire picture of space utilization necessary for a triage post. This report specifies how space for triage could be utilized based on human-trajectory data from the application of human-sensing technology to disaster prevention, and it also discusses how it is possible to apply the scientific results to the effective operation of triage with efficient space utilization.
Previous studies on triage drill sessions were limited to the ratings of their effects and the correctness of the triage results as well as educational considerations.Reference Yoda, Hosotani and Sakaue 8 , Reference Cone, Serra and Kurland 9 In addition, Abir et alReference Abir, Davis, Sankar, Wong and Wang 10 have shown how effectively one could design a model to predict surge capacity at a large, academic medical center responding to a mass-casualty incident.Reference Leow, Brundage and Kushner 11 Their report discusses the resources a hospital should utilize in response to the mass-casualty incident. However, by further expanding the current understanding of space utilization for triage, this report investigates human trajectory at a triage post during two drill sessions (held in urban business buildings in the center of Tokyo, Japan) in preparation for a major earthquake hitting the Greater Tokyo area. As a preliminary step, this paper reports how the triage post is actually used during drill sessions by measuring the trajectories of human movement.
Method
This report shows the analysis of the trajectories of human movement during two emergency drill sessions which were held in 2012 in a large, commercial building located in a business district in Tokyo. The main focus of the study was the triage post. According to the scenario, besides the volunteering doctors and nurses, there were 20 mock patients who arrived continuously at the triage post. The above-mentioned USV camera mounts two lenses (just like a human being's) and a charge coupled device, which allows for the extraction of both a colored image and a three-dimensional (3D) image simultaneously. By this 3D lens image, the camera can capture all human movements; thereby, more precise human trajectory is obtainable. The camera was installed on the handrail located in the second floor of an atrium (five meters high) in order to capture the participants’ movements (Figure 2; available online only); the analysis of their movement within each triage area was conducted. The total area under the surveillance was 60 m2. All study participants provided informed consent, and the study design was approved by an ethics review board at the National Institute of Advanced Industrial Science and Technology (Tsukuba, Japan).
The USV camera records not only the two-dimensional images, but also the 3D information in the camera's field of view, which together yields the precise distance to the object, and thus, calculates all trajectories of the participants and medical staff. Furthermore, measuring the trajectory of each participant permits the collection of various data, including each agent's distance of travel and positioning, the duration of waiting time before triage, the period of receiving the triage, and the departure time. Mean and standard deviation are calculated for the data analysis. Based on these results, the correlation between the duration of waiting time (from the point when each participant arrived at a triage post until the doctor's examination begins) and the space utilization (according to patient roles before and after getting triage) has been analyzed. The same participants took part in both sessions.
Results
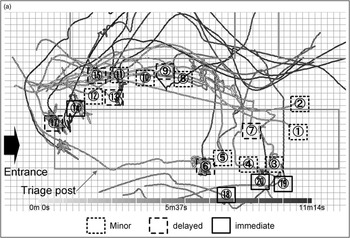
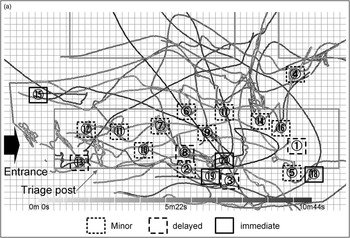
The trajectory of 20 participants at the triage post for each session was mapped, as shown in Figure 3 (Session I) and Figure 4 (Session II). Each line represents a trajectory of a patient and the lines are gray-scaled according to the elapsed time from the beginning. The outline square represents the position where a patient had settled after their arrival at the triage post (ie, before getting triaged) and the circled number is assigned according to the order of arrival. The outlines of the squares show the triage results (immediate, delayed, and minor).
Human Trajectory at a Triage Post for Session I. Each gray-scaled line represents a trajectory of a patient and the lines are based on the elapsed time of participant from the beginning (duration shown on the bottom bar). Each outline square represents the position where a patient has stayed before getting triage and is numbered according to the order of arrival at the triage post. The line types are based on the triage results (minor, delayed, and immediate).

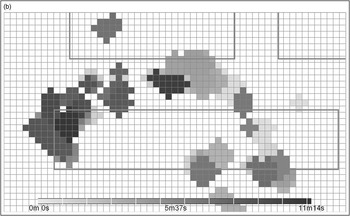
Utilization of a Triage Post for Session I. Each gray-scaled box represents how long each place is occupied by patients (duration shown on the bottom bar).

Human Trajectory at a Triage Post for Session II. Each gray-scaled line represents a trajectory of a patient and the lines are based on the elapsed time of participant from the beginning (duration shown on the bottom bar). Each outline square represents the position where a patient has stayed before getting triage and is numbered according to the order of arrival at the triage post. The line types are based on the triage results (minor, delayed, and immediate).

Utilization of a Triage Post for Session II. Each gray-scaled box represents how long each place is occupied by patients (duration shown on the bottom bar).

In the first session, there were some open spaces not used entirely; 337,500 cm2 was used in the first session, and 435,000 cm2 of the triage post area was used in the second session. The reason for this was identified as follows: the patients indicated as number eight lingered in the middle area, this caused the subsequent arrivals (numbers nine though 15, and 17) to crowd around the entrance area (Figure 3). On the other hand, in the second session, the area was used in a more evenly-distributed manner. This was largely because the earlier arrivals were guided to the back space of the triage post (ie, the opposite side from the entrance), and the late arrivals were guided to the front half, which was not occupied by anyone. As a result, the entire space was utilized effectively without causing the patients to linger around the entrance.
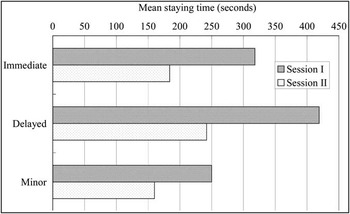
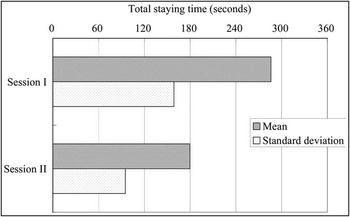
Furthermore, Figure 5 indicates the comparison of the average waiting time for each category between Sessions I and II, the result of which shows all processes in the second session were accomplished in a shorter time than in the first session. Ideally, the patient's condition should be assessed correctly and identified immediately, and the more critical condition should receive faster assessment and identification. However, the results differed from this when they were broken down into each category: the immediate patients (mean = 318 seconds, SD = 160 in Session I; mean = 184 seconds, SD = 67 in Session II) remained longer than the minor patients (mean = 250 seconds, SD = 151 in Session I; mean = 160 seconds, SD = 101 in Session II) in both sessions. Overall, in all categories, the staying time in Session II (mean = 179 seconds, SD = 95) became shorter than in Session I (mean = 286 seconds, SD = 158).
Mean of Staying Time for Each Category. This figure indicates the mean staying time for each category between Session I and Session II. In all categories, the waiting time in Session I is longer than in Session II.

Discussion
These results show that this system can supply the evidence of the movement of people and the duration of time for triage, which can be used for the evaluation of the correlation between space utilization and arrival time.
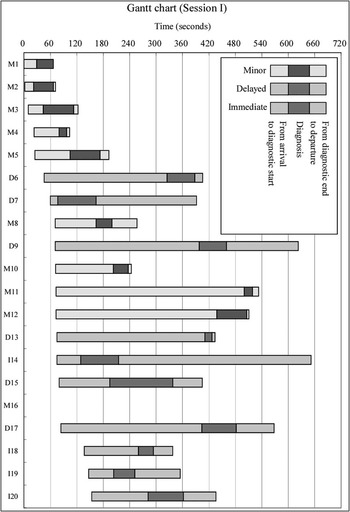
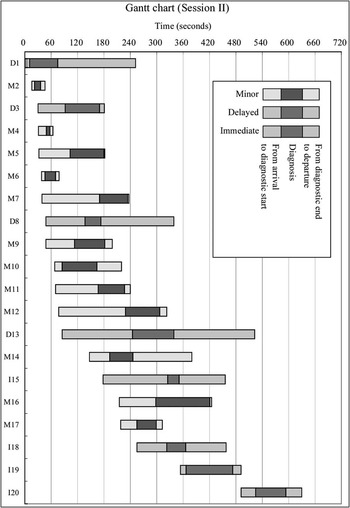
Based on these results, the following points have been suggested. First of all, it seems that better results in the second session (in terms of time) are due to better performance in the triage process. However, by comparing how the space is utilized while the patients remained in the respective sessions, it becomes possible to notice the difference in the arrival times between the two sessions. Figures 6 and 7 show when each participant arrives at the triage post and how long they remain until they leave the post. By comparison, there is an apparent difference with regards to the arrival time: in the first session, the bulk of people arrive at almost the same time, while in the second session, their arrival time varies. Due to the congestion caused by the arrival of people in the first session, there seems to be a shortage of people who can make the diagnosis upon the patients’ arrival, which results in longer waiting time for most of them.
Gantt Chart of All Patients at Session I. The horizontal axis shows the duration of time and the vertical axis shows the different patients. The alphabets of the patients’ IDs (M as Mild; D as Delayed; and I as Immediate) and the gray scale indicate the triage result. This also shows the time spent (1) from their arrival to the beginning of the diagnosis, (2) for receiving a diagnosis, and (3) after the diagnosis is completed until their departure to the designated section.

Gant Chart of All Patients at Session II. The horizontal axis shows the duration of time and the vertical axis shows the different patients. The alphabets of the patients’ IDs (M as Mild; D as Delayed; and I as Immediate) and the gray scale indicate the triage result. This also shows the time spent (1) from their arrival to the beginning of the diagnosis, (2) for receiving a diagnosis, and (3) after the diagnosis is completed until their departure to the designated section.

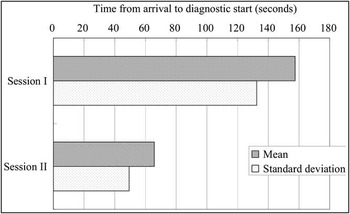
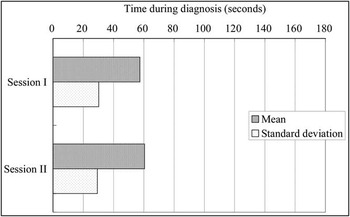
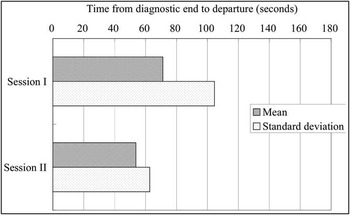
Second, to scrutinize this point, the mean time and the standard deviation for the duration of the following three phases have been measured: (1) from the arrival to the diagnosis (Figure 8); (2) during the diagnosis (Figure 9); and (3) after the diagnosis is completed until their departure (Figure 10). The durations of the diagnosis (Figure 9) are almost identical in these two sessions, which suggests that as the patients’ categories remain the same across two sessions, the time spent for making diagnosis also remains the same. On the other hand, there is a clear difference between these sessions in their staying and waiting time to get diagnosis due to the density of people at the time of arrival (Figure 11).
Mean Time and SD from their Arrival to the Diagnosis of All Patients.

Mean Time and SD During the Diagnosis of All Patients.

Mean Time and SD from the Diagnosis Completion to the Departure of All Patients.

Mean and SD from the Beginning to the Session End.

In Figure 10, one can also notice that in leaving the triage post and moving to the designated area, there is a larger distribution of the standard deviation in Session I. This result seems to suggest that patients who are in more critical condition (immediate and delayed), and presumably need more time to travel, would be able to shorten the travel time with the participants in Session II simply because they are repeating the same drill for the second time.
It has been shown that there is a correlation between the timing of one's arrival and the space utilization which can affect the overall performance of triage operation, that is, the faster the better. Based on the elucidated scientific evidence, this report proposes the need to control how to deploy each participant upon their arrival and distribute them evenly within the triage post area in order to elicit better outcomes, even in real emergency situations. Although this report can be a signpost for the design of a triage post in subsequent emergency drill sessions, more data should be added to the current result for a more generalized conclusion.
Limitations
The current study has several limitations. First, it was limited primarily by its small sample size. However, since these data are not collected at an experimental setting, the expansion of the sample size might not be viable. More comparisons across different years of the same data set would have benefited the study. Second, since the human trajectory is the only measured item for data analysis, more qualitative data, such as communication between participants during those moments, should be added to account for the improved result.
Conclusion
This report shows that the placement of patients within a triage post upon their arrival can affect the ensuing performance of triage operation in terms of duration of their activity. The study has tracked objectively the movement of people and suggests the improvable points for better space utilization. During a major disaster, it is necessary to control the placement of patients within limited spaces and human resources. In case of a major earthquake in a metropolitan area, such as Tokyo, many injured people will need to be transferred immediately to hospitals. Therefore, the effective operation and utilization of triage in a public space, as in the location of this training, are crucial in minimizing the number of casualties. In this study, by employing the system which measures people's arrival time and speed of their movement at the triage post, as well as where they are placed until they receive diagnoses, it has been proposed that space utilization can be improved by efficiently planning and controlling the positioning of arriving patients. Though small in size and limited in scope, this study provides sample data for analyzing disaster medical-simulation sessions. In the future, a larger sample size is necessary to conduct more detailed analyses of factors, such as the distance traveled by medical staff and their movement depending on different triage post results, before another devastating disaster occurs.
Supplementary Materials
To view supplementary material for this article, please visit http://dx.doi.org/10.1017/S1049023X14001381