

Introduction
An earlier version of this paper was presented at the 19th Conference of Antennas and Propagation (EuCAP 2025) and was published in its Proceedings [Reference Ali, Shady, Sifat, Hettak, Talbi and Wu1].
Wireless networks are now dynamic platforms with excellent signal integrity, secure connections, and high-performance RF front-end components due to the rapid development of communication technology. The need for extensive frequency bands that can accommodate a range of wireless applications is rising along with the exponential expansion of wireless communication systems. With its high bandwidth and extensive coverage capabilities, centimeter-wave (cmWave) technology has become a crucial component of 6G communication [Reference Adeogun, Berardinelli, Mogensen, Rodriguez and Razzaghpour2, 3]. The realization of 6G’s technological potential, which includes holographic displays, high-definition IoT devices, smart and sustainable cities, and immersive digital experiences, is anticipated to be greatly aided by cmWave frequencies [Reference Akyildiz, Kak and Nie4–Reference Ratchagar, KS and Agrawal7]. By improving communication link dependability and lowering latency, beam-scanning antennas have the potential to completely transform 6G communication. Beam-scanning antennas can reduce interference, path loss, and signal blockage by precisely guiding beams towards specific users or locations, creating more reliable and low-latency communication links [Reference Shady and Kishk8, Reference Ali and Sebak9]. For high-power satellite and radar systems, phased arrays provide the perfect way to achieve beam-scanning [Reference Yu, Hong, Jiang and Zhang10, Reference Shin, Kim, Kang and Rebeiz11].
Many techniques have been investigated for main-lobe scanning of phased array antennas, which are extensively utilized in military radars, satellites, and beam-forming applications. Planar array antennas that use adjustable electrical components such as varactor diodes, p-i-n diodes, or mechanical phase shifters are among these techniques [Reference Xiao, Zheng, Li, Xiong and Wang12, Reference Huang, Pan, Ma, Zhao, Cui and Luo13]. Waveguide phased arrays possess high-power handling capabilities and efficiency, making them a suitable option for high-power radar systems [Reference Courtney and Baum14, Reference Yu, Yuan, He and Zhang15]. For wide-angle beam-scanning while preserving performance, some studies suggest mechanical reconfiguration techniques [Reference Polo-López, luis Masa-Campos, Muriel-Barrado, Sanchez-Olivares, Garcia-Marin, Córcoles and Ruiz-Cruz16, Reference Jouade, Himdi, Chauloux and Colombel17]. A 4-element antenna array’s beam was controlled by 43 tuning screws in [Reference Sanchez-Olivares, Masa-Campos, Muriel-Barrado, Villena-Medina and Fernandez-Romero18], which led to a high level of complexity. Another method in [Reference Ghasemi and Laurin19] uses rotating dielectric slabs in waveguide arrays. However, the bandwidth and scanning range of this design are limited. Furthermore, it has been demonstrated that adding circulators to transmitting or receiving modules improves beam-scanning capabilities, opening up features such as full duplex communication and boosting wireless communication systems’ efficiency [Reference Shams, Sifat, Elsaadany, Gagnon and Kishk20–Reference Ali, Elsaadany, Shams and Wu22].
The design of a passive electronically scanned array (PESA) system that operates in the 13–17 GHz frequency band and is appropriate for future 6G communication is the main goal of this paper. To achieve precise beam-scanning, the system consists of a  $2 \times 2$ array of horn antennas that are controlled by electronic reflective phase shifters. For effective signal distribution to the individual horn antennas, the assembly has H-splitter and E-splitter components. Every component is carefully planned and optimized separately before integration. To verify its performance, the complete assembly is then simulated in the time and frequency domains using a full-wave electromagnetic solver. The suggested approach has great potential to advance communication technology, with possible uses in satellite communications, military radars, and Internet of Things devices for distant sensing.
Electronically scanned array configuration
Figure 1 shows the proposed PESA, which consists of four horn antennas fed by a waveguide feeding network. A waveguide reflection-type phase shifter connects each feeding network output to the matching radiating element of the horn antenna array. The feeding network setup has four output ports and one input port, all based on the WR-62 waveguide. In terms of both amplitude and phase, this device evenly distributes the signal at its input port across its four output ports. The pyramidal horns that make up the horn antenna array are intended to provide a good matching level and a steady gain of 8.41 dBi over the intended frequency range. The aperture and flare of the horn are precisely designed to maximize performance. Four separate variable reflect-type phase shifters with digital control comprise the suggested movable short phase shifter module. Due to each phase shifter having its own movable short circuits, the phase shift between the input and output ports may be precisely controlled. The required scanning of the radiation pattern can be achieved by manipulating the relative phase shift between the array elements by varying each short.
Block diagram and 3D view of the proposed overall PESA.

Figure 1 Long description
The image shows a block diagram and 3D view of a 2 by 2 antenna array system. The top section illustrates the block diagram with components labeled as recon. phase shifter, E-splitter and H-splitter, leading to an input labeled 'In'. The bottom section presents a 3D view with labeled components: 2 by 2 horn antennas, reconfigurable reflective phase shifters, E-splitter, H-splitter and EH splitter section. The layout includes directional labels Dx and Dy, indicating spatial orientation.
It is crucial to note that the design that is being presented is only a proof of concept. Fully automated adjustable short circuits could be used in place of the presented movable short circuits in the device’s final real-world implementation. This improvement would include using a motion mechanism that consists of a stepper motor coupled to a long-threaded rod for precise movement and phase difference. A motor shield that is coupled to a microcontroller would regulate the stepper motor, ensuring accurate and automated short-circuit adjustment.
Electronically scanned array capability
This section explores the proposed beam-scanning capability of the PESA, focusing on a  $2 \times 2$ antenna array configuration. By carefully adjusting element spacing and implementing progressive phase shifts, beam-scanning is accomplished in both the elevation (
 $\theta$) and azimuth (
 $\Phi$) planes. The scanning beam angle can be calculated using [Reference Ali and Sebak9]:
 \begin{equation}
\Phi_{0}=tan^{-1}\left(\frac{\Phi_xd_x}{\Phi_yd_y}\right)
\end{equation}
 \begin{equation}
\theta_{0}=sin^{-1}\sqrt{\left(\frac{\Phi_x}{d_xk}\right)^2+\left(\frac{\Phi_y}{d_yk}\right)^2}
\end{equation}
where  $\Phi_x$ and
 $\Phi_y$ are the progressive phase shifts in the
 $x$ and
 $y$ planes,
 $d_x$ and
 $d_y$ are the element spacing, and
 $k$ is the propagation constant in free space.
A  $2 \times 2$ array of horn antennas is excited by a WR-62 rectangular waveguide, allowing for precision beam-scanning across the 13–17 GHz frequency range. The ideal element spacings, represented by
 $d_x = 18.54\,\mathrm{mm}$ and
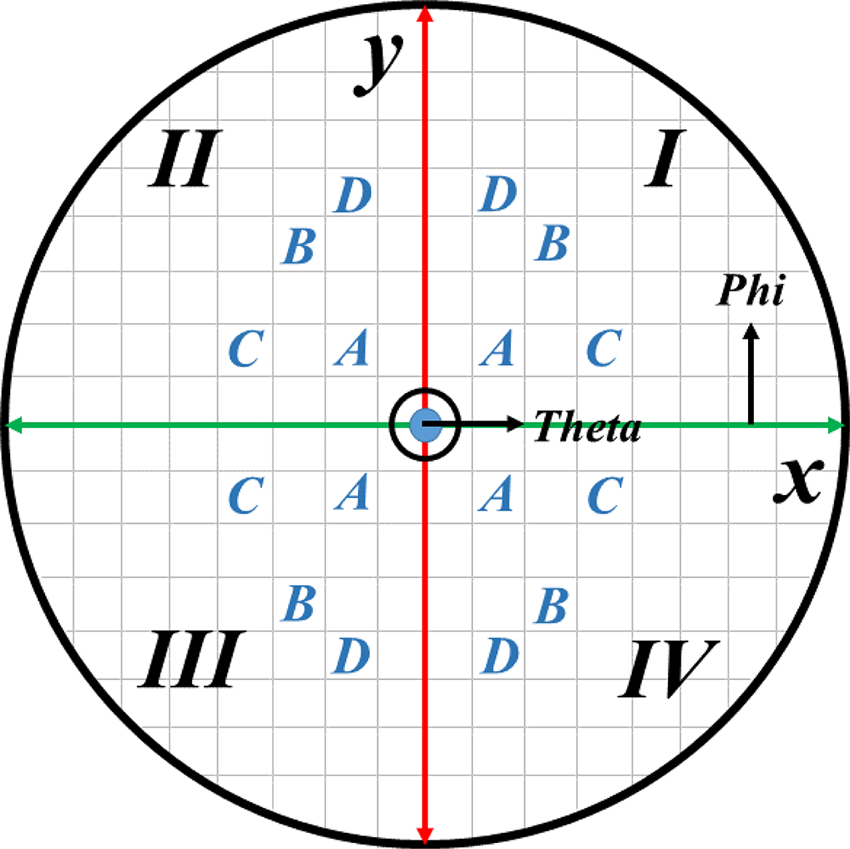
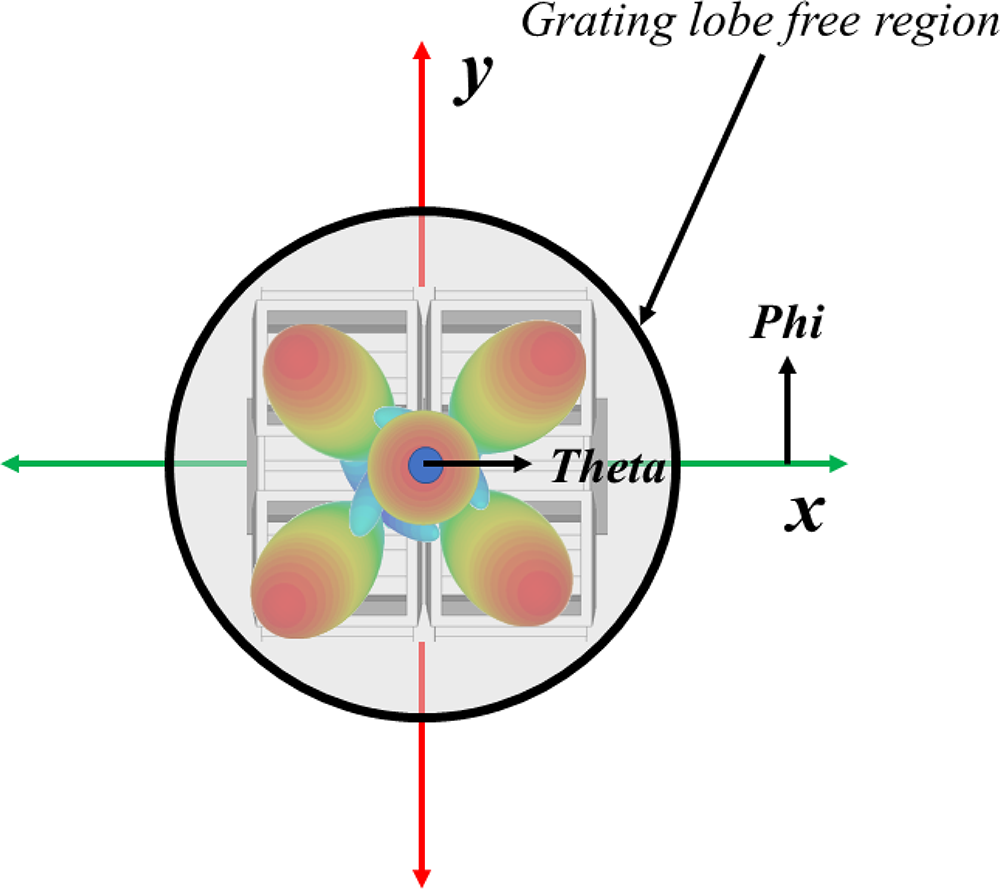
 $d_y = 13.46\,\mathrm{mm}$, are determined by the waveguide’s physical dimensions as well as the geometric properties of the flaring of the horn antennas. Table 1 provides a quantitative evaluation of the scanning performance using the computed output beam samples that were obtained from equations 1 and 2. It is worth mentioning that each beam scanned within every quadrant inherently possesses a complementary counterpart in every quadrant, which is linked to the symmetrical nature of the scanning process. To give a visual representation of the scanning capacity in a 2D polar form and to show the directional features of the antenna array, these results are graphically shown in Figure 2. Additionally, the beam-scanning capacity of the
 $2 \times 2$ horn antenna array is explained in Figure 3, which shows beams switched across the origin and the four quadrants. Notably, the visualization also displays areas where scanning can be done successfully without grating lobes appearing, which is an important factor mitigated by optimizing the element spacing.
Output beam phase distribution.

Figure 2 Long description
A circular diagram divided into four quadrants labeled I, II, III and IV. The x-axis is labeled 'Theta' and the y-axis is labeled 'Phi'. Within the circle, letters A, B, C and D are arranged symmetrically around the center. The grid background provides a structured layout for the letters, which are distributed evenly across the quadrants.
3D output beam-scanning samples.

Figure 3 Long description
The diagram features a 2D polar plot with a central circular area labeled 'Grating lobe free region.' The plot includes axes labeled x and y, with arrows indicating their directions. The center of the plot is marked with 'Theta,' and an arrow labeled 'Phi' points outward. The plot visually represents a symmetrical pattern with four lobes extending from the center, illustrating the directional features of the antenna array.
 $2 \times 2$ array output ports’ phase profile samples

Table 1 Long description
This table measures the phase profiles of a 2x2 array output ports, detailing angles in degrees across different quadrants and positions. Key data points include a negative 45-degree phase in both quadrant I and IV, positions A and D, respectively. Quadrant II, position B, shows a significant phase shift with angles of 130 degrees and negative 130 degrees. Quadrant III, position C, has a phase of 160 degrees and 45 degrees, indicating a diverse phase profile. The origin position has all angles set to zero, serving as a baseline. The data suggests varied phase profiles across quadrants, with quadrant I and IV sharing a similar negative phase angle, while quadrant II and III exhibit distinct phase shifts. Interpretation should consider the context of phase angle variations and their implications on the array's performance.
Beam-scanning network design
The  $2 \times 2$ array requires a reconfigurable feeding network with the same interface, capable of providing uniform amplitudes with varying phases. As a result, each component in the PESA will be designed and optimized separately to verify the functionality of the final network before integration. Each component will be designed based on the WR62 standard for direct integration and testing with a standard waveguide interface.
E–H splitter
The beamforming network illustrated in Figure 1 consists of three primary parts. The E–H splitter, which is the main part, is essential for splitting the input signal. In order to ensure equal magnitude and phase, the input signal is split in half by the H-splitter and then further divided into four by the E-splitters. Figure 4 shows the E–H splitters’ internal structure. The E–H splitter’s performance is improved by increasing its matching bandwidth with the use of multi-section stepped transformers. The E–H splitter’s remarkable matching performance is demonstrated by its S-parameter response, which is shown in Figure 5. Its reflection coefficient remains below  $-$22 dB throughout the 13–17 GHz operational range. Furthermore, over the whole frequency range, the transmission coefficient between the input and output ports is consistently within
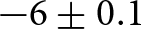 $-6 \pm 0.1$ dB, indicating low amplitude variation between the outputs.
3D view of the E–H splitter feeding network. (a) H-splitter and (b) E-splitter.

Figure 4 Long description
The image shows two 3D views of an E-H splitter feeding network. The first view (a) illustrates the H-splitter with labeled components including multi-section stepped transformers, input port 1, port 2 and port 3. The second view (b) depicts the E-splitter, highlighting the E splitter, multi-section transformers from half-to-full height, port 1, port 2 and port 3.
S-parameter response of the proposed E–H splitter.

Figure 5 Long description
A graph showing the S-parameter response of an E-H splitter. The x-axis is labeled 'Frequency (GHz)' ranging from 13 to 17. The y-axis is labeled 'S-Parameter (dB)' ranging from negative 40 to 0. The graph includes multiple lines representing different S-parameters: S subscript 11, S subscript 21, S subscript 31, S subscript 41 and S subscript 51. The S subscript 11 line is shown prominently, with values below negative 22 dB across the frequency range. An inset diagram illustrates the E-H splitter design, highlighting the E splitter and H splitter components.
Reconfigurable phase shifter
The reconfigurable reflective phase shifter, which is essential for beam-scanning activities, is the second main part of the entire assembly. To ensure exact control over the phase shift, a total of four phase shifters will be linked to the four ports of the E-splitters. In order to get precise control over the phase shift, two ports are short-circuited in the E-plane  $90^\circ$ hybrid coupler configuration used to create these phase shifters [Reference Cano, Ceccato, Fernandez, Mediavilla and Perregrini23, Reference Shady, Ali and Kishk24]. Full-wave simulation was used to thoroughly validate the hybrid coupler’s performance before the reflecting short circuit was put into practice. As illustrated in Figure 6(a), the suggested hybrid coupler structure uses the E-plane principle and couples via two multi-stepped apertures located in the shared broad wall between the two waveguides. This innovative design guarantees less reflection and improves coupling flatness. Furthermore, the center part of the coupling section is matched to the WR-62 waveguide interface by using a multi-step design of the waveguide main arm, as their effects are demonstrated in Figure 6(b). The matching level is further enhanced by tuning posts beneath the aperture. Both the coupling flatness and the matching level are controlled by carefully selecting the aperture and multi-step dimensions. In addition to guaranteeing accurate phase variation, this design strategy helps the coupler remain compact while still exhibiting a high matching level and enhancing performance. Figure 6(c) displays the wideband 3-dB coupler’s S-parameter response. The coupling variation is
 $3 \pm 0.5$ dB, with a matching level below
 $-$25 dB spanning the 13–17 GHz range.
Quadrature hybrid coupler. (a) 3D view. (b) S $_{11}$ using different number of matching steps. (c) Final S-parameter response.

Figure 6 Long description
The image consists of three parts. The first part (a) shows a 3D view of a hybrid coupler with labeled ports: Port 1 Input, Port 2 Thru, Port 3 Coupled and Port 4 Isolated. It includes an aperture and tuning posts. The second part (b) is a graph displaying S subscript 11 in decibels against Frequency in gigahertz, with curves for Zero Steps, One Step, Two Steps and Three Steps. The frequency range is from 13 to 17 gigahertz. The third part (c) shows a graph of S-parameters in decibels against Frequency in gigahertz, with curves for S subscript 11 Thru, S subscript 21 Coupled, S subscript 31 Isolated and S subscript 41. The frequency range is from 13 to 17 gigahertz.
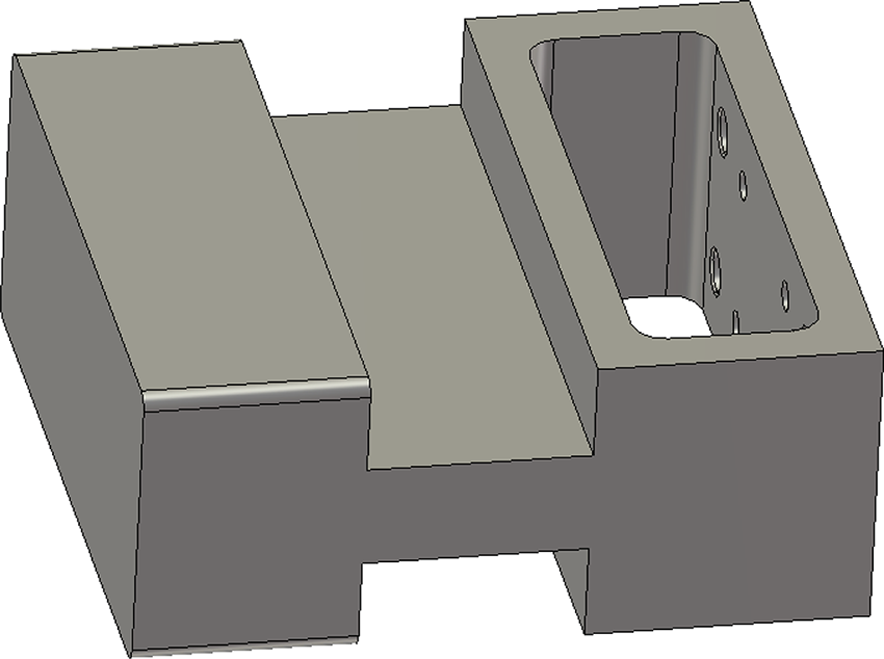
A movable short to terminate the through and coupled ports can be used to allow full signal transmission to the isolated port. The network will be similar to a crossover where two quadrature hybrid couplers are cascaded, whereas here the signal will combine at the isolated port. A thick aluminum sheet with a sliding piston connected to it and controlled by a stepper motor can be used to vary the phase [Reference Popela, Simon and Lacik25]. Additionally, the movable short can be modified to be a block with RF chokes that act as a bandstop filter based on the impedance of the steps [Reference Choi and Kim26]. The RF chokes significantly reduce the RF leakage, which also improves the phase imbalance for the phase shifter. The short with RF chokes is shown in Figure 7.
Short with RF chokes.

Figure 7 Long description
The image shows a 3D model of a block with a rectangular cutout on the top surface. The cutout has several drilled holes along one side. The block has a stepped design with varying heights and a solid base.
The reflecting phase shifter’s block diagram and 3D view are displayed in Figure 8(a). A phase shift is produced by moving the reflecting short-circuit blocks, which allows the array’s beam to be scanned. The reconfigurable phase shifter’s S-parameter response is demonstrated in Figure 8(b), where the reflective short circuit is electrically moved to vary the phase at  $45^\circ$ and
 $90^\circ$. The figure shows that the reflection coefficient matching level is better than
 $-$18 dB over the whole operating spectrum, even after varying the phase from
 $45^\circ$ to
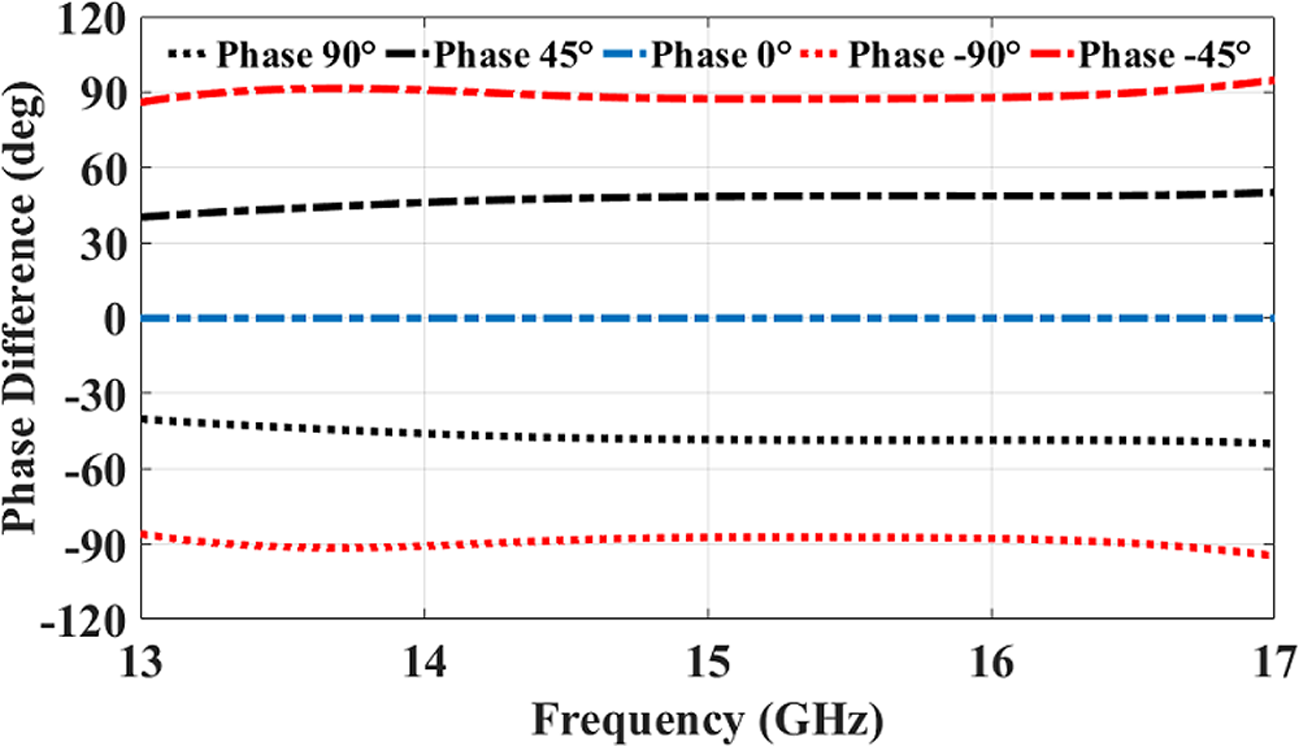
 $90^\circ$. The phase difference vs frequency for a range of phase shifts, from
 $-90^\circ$ to
 $90^\circ$, is shown in Figure 9. With only a minimal amount of phase variation, the curves show a steady response over the 13–17 GHz frequency range.
Reconfigurable reflective phase shifter. (a) Block diagram and 3D view. (b) S-parameter response at  $45^\circ$ and
 $90^\circ$ by moving the reflective short circuit.

Figure 8 Long description
The image A shows a block diagram and 3D view of a reconfigurable reflective phase shifter. The diagram includes an E-plane quadrature hybrid coupler and a movable short. The image B shows a graph of S-parameter response with frequency on the x-axis in gigahertz and S-parameter in decibels on the y-axis. Two curves are plotted: one for phase 45 degrees and another for phase 90 degrees, showing variations in S-parameter values across the 13 to 17 gigahertz range.
The simulated phase variation of the wideband reflective phase shifter.

Figure 9 Long description
The graph shows phase difference in degrees on the y-axis and frequency in gigahertz on the x-axis, ranging from 13 to 17 gigahertz. It includes five curves representing phase shifts of 90 degrees, 45 degrees, 0 degrees, negative 90 degrees and negative 45 degrees. The curves are plotted across the frequency range, showing minimal variation in phase difference over the specified frequencies.
Horn antenna
The simplest type of antenna for a rectangular waveguide capable of handling high power is the horn antenna. It also provides a directive beam with high gain and a superior matching level for the whole bandwidth. The horn antenna utilized in the  $2 \times 2$ array is shown in Figure 10 along with its matching level, gain, and radiation pattern. The horn antenna has a WR-62 input interface and a minimal flaring to minimize the element spacing in the array and mitigate grating lobes. It also has a reflection coefficient level better than
 $-$30 dB and a gain of
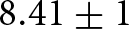 $8.41 \pm 1$ dBi over the target bandwidth with a 3-dB beamwidth of
 $67^\circ$.
Horn antenna and its frequency response. (a) Structure, (b) S $_{11}$ and gain, and (c) radiation pattern.

Figure 10 Long description
The image A shows the structure of a horn antenna with dimensions labeled as 11.2 millimeters, 9.1 millimeters, 6.3 millimeters and 2.3 millimeters. The image B shows a graph with frequency in gigahertz on the x-axis and S subscript 11 in decibels and realized gain in decibels on the y-axis. The graph displays two curves: S subscript 11 ranging from approximately -12 to -18 decibels and realized gain ranging from approximately 8 to 10 decibels over the frequency range of 12 to 18 gigahertz. The image C shows a graph with theta in degrees on the x-axis and realized gain in decibels on the y-axis. Two curves are shown: Phi equals 0 and Phi equals 90, both displaying a pattern of peaks and troughs between -180 and 180 degrees, with realized gain values ranging from approximately -15 to 10 decibels.
Beam-scanning antenna array
The pyramidal horn antenna is integrated in a  $2 \times 2$ array and assembled with the previously mentioned reconfigurable network. The array could be switched to scan in all the quadrants and the origin. Figure 11 shows examples of switching radiation patterns to demonstrate the network’s flexible scanning capabilities. An outstanding matching level is achieved by optimizing the feeding network and the antennas, which can be sustained at various scanning configurations. This is demonstrated in Figure 12, where even at larger scan angles, a good matching level is maintained and the results are verified in both the time and frequency domains. Similarly, Figure 13 plots the gain against the operating frequency for the various switched beams in both domains. The gain for each of the beams is Origin = 14.6 dBi, Q1 = 14 dBi, Q2 = 12.63 dBi, Q3 = 13.18 dBi, and Q4 = 13.15 dBi at the center frequency. It offers a minimal scan loss, which can be further compensated by the network’s capacity to manage high power levels. Some of the previously switched beams are validated using time and frequency domains, as shown in Figure 14, highlighting the effectiveness of the proposed scanning network.
Sample of radiation patterns at (a) Quadrant 1 ( $\theta_0 = 9^\circ$,
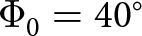 $\Phi_0 = 40^\circ$), (b) Quadrant 2 (
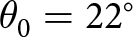 $\theta_0 = 22^\circ$,
 $\Phi_0 = 140^\circ$), (c) Quadrant 3 (
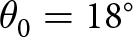 $\theta_0 = 18^\circ$,
 $\Phi_0 = -150^\circ$), (d) Quadrant 4 (
 $\theta_0 = 18^\circ$,
 $\Phi_0 = -50^\circ$), and (e) Origin.

Figure 11 Long description
Five images showing radiation pattern samples labeled (a) to (e). Each pattern features a three-dimensional shape with varying lobes and colors. The Theta and Phi axes are marked in each image, indicating orientation. The patterns are distinct in shape and distribution, demonstrating different radiation characteristics.
Simulated reflection coefficient using time and frequency domains.

Figure 12 Long description
The graph shows S subscript 11 in decibels on the y-axis versus frequency in gigahertz on the x-axis. It includes multiple curves: Origin Frequency, Q1 Frequency, Q2 Frequency, Q3 Frequency, Origin Time, Q1 Time, Q2 Time and Q3 Time. The frequency range is from 13.5 to 17 gigahertz and the S subscript 11 values range from negative 50 to 0 decibels. Each curve represents different configurations, with distinct patterns and peaks across the frequency spectrum.
Simulated gain using time and frequency domains.

Figure 13 Long description
The graph shows realized gain measured in decibels isotropic against frequency measured in gigahertz. The x-axis is labeled 'Frequency' with values ranging from 13 to 17 gigahertz. The y-axis is labeled 'Realized Gain' with values from 12 to 16 decibels isotropic. Multiple curves are plotted: 'Origin Freq', 'Q1 Freq', 'Q3 Freq', 'Origin Time', 'Q1 Time' and 'Q3 Time'. The 'Origin Freq' curve shows an upward trend starting from approximately 13.5 decibels isotropic at 13 gigahertz, peaking at around 16 decibels isotropic near 17 gigahertz. The 'Q1 Freq' and 'Q3 Freq' curves show similar upward trends but at lower gain levels. The 'Origin Time', 'Q1 Time' and 'Q3 Time' curves show fluctuations with lower gain values compared to their frequency domain counterparts. The graph illustrates the performance of different configurations in both time and frequency domains across the specified frequency range.
Sample of radiation patterns using frequency and time domains at (a) Quadrant 1 (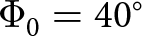 $\Phi_0 = 40^\circ$), (b) Quadrant 3 (
 $\Phi_0 = -150^\circ$), and (c) Origin.

Figure 14 Long description
The image contains three graphs labeled (a), (b) and (c), each depicting radiation patterns. The x-axis is labeled Theta in degrees, ranging from negative 180 to 180. The y-axis is labeled Realized Gain in decibels, ranging from negative 30 to 30. Each graph compares two data sets: Co-Pol frequency and Co-Pol time. In graph (a), the Co-Pol frequency and Co-Pol time lines show fluctuations with peaks around negative 60 and 0 degrees. In graph (b), the lines show peaks near negative 90 and 60 degrees. In graph (c), the lines display prominent peaks around negative 120 and 120 degrees. The graphs illustrate variations in realized gain across different angles for both frequency and time domains.
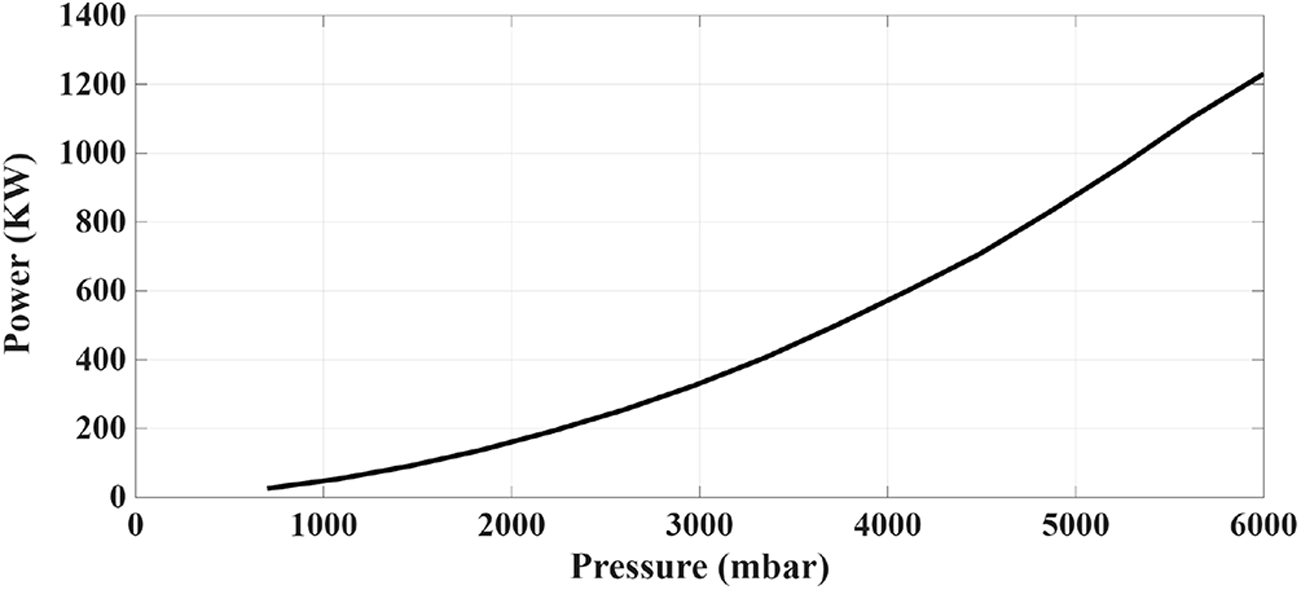
The PESA is capable of handling high power levels due to the utilization of the rectangular waveguide as the guiding medium. Furthermore, a power breakdown occurs due to small gaps inside the structure, causing the air to ionize in the presence of a high voltage difference between the two terminals. In the proposed beamforming network, the limiting component with the smallest gap is the reconfigurable phase shifter. As a result, corona discharge analysis is conducted using Spark3D for this component to determine the breakdown power. The Paschen curve is plotted in Figure 15, where the breakdown power at atmospheric pressure (1013.25 mbar) is 51 kW, showcasing the high-power capability of the network.
Paschen curve of the reconfigurable phase shifter.

Figure 15 Long description
The graph shows the relationship between pressure, labeled as mbar on the x-axis and power, labeled as kilowatts on the y-axis. The curve starts near the origin and rises steadily, indicating an increase in power as pressure increases. The x-axis ranges from 0 to 6000 mbar, while the y-axis ranges from 0 to 1200 kilowatts. The curve demonstrates a positive correlation between pressure and power.
The proposed PESA is compared with others found in the literature in Table 2. Multiple substrate integrated waveguide (SIW) beamforming networks are cascaded in [Reference Lian, Ban, Zhu, Guo and Chen27] to achieve 2D beam-switching with a low sidelobe level. However, this limits the bandwidth and increases the losses in the network. In [Reference Tamayo-Domínguez, Fernández-González and Sierra-Castañer28], a modified groove gap waveguide (GGW) Butler matrix with only two inputs is realized to reduce the complexity and switch the beam at the W-band. Similarly, the network is limited in bandwidth and scan coverage. A microstrip Butler matrix that utilized reconfigurable liquid crystal phase shifters to scan the beam continuously in [Reference Wang, Polat, Tesmer, Maune and Jakoby29]. However, this increases the complexity and the losses significantly of the output signal. A ridge gap waveguide (RGW) multilayer Butler matrix is proposed in [Reference Geng, Lian and Ding30] that improves the scanning coverage. However, the network has a considerable size of  $11.3\lambda\ \times 11.2\lambda$ and a limited bandwidth.
Comparison between different PESA in the literature

Table 2 Long description
The table compares different planar electronically scanned antennas (PESA) technologies based on bandwidth percentage at a specific frequency, scanning type, gain, complexity, and power handling. The WR technology in this work stands out with the highest bandwidth percentage at 15 GHz and continuous scanning, achieving a gain of 14 with medium complexity and high power handling. In contrast, the SIW and RGW technologies both have a bandwidth percentage of 3.6 at 28 GHz with switched scanning, but differ in gain and complexity. The GGW technology has the lowest bandwidth percentage at 94 GHz and moderate power handling, while the Microstrip technology offers a high bandwidth percentage at 28 GHz with continuous scanning but has high complexity and low power handling. These variations highlight the trade-offs between bandwidth, gain, complexity, and power handling across different technologies.
This PESA provides a straightforward reconfigurable network with superior scanning coverage and matching level. Additionally, the network can withstand high power levels due to the rectangular waveguide guiding medium and the lack of small gaps inside the structure [Reference Ali, Sifat, Elsaadany, Shams and Wu31, Reference Ali, Shady, Elsaadany, Shams, Gagnon and Ke32]. Using an antenna element with a broader radiation pattern beamwidth to cover the majority of the scanning range could help reduce the scanning loss. A half-height structure and smaller antenna elements might also be used to lower the grating lobe level by decreasing the spacing. However, this would result in a reduction in power handling capacity, gain, and matching level.
Conclusion
In this work, a PESA utilizing reflective phase shifters has been discussed in detail for future 6G applications. Four digitally controlled variable reflect-type phase shifters, each built with a  $90^\circ$ hybrid coupler with a movable short-circuit, are integrated with a
 $2 \times 2$ horn antenna array. Outstanding performance has been demonstrated by the simulation results for the whole PESA, which show continuous main-lobe scanning in the azimuth and elevation planes. The suggested work may be appropriate for complex antenna systems and can be utilized in radar systems and beam-scanning next-generation satellite communications.
Competing interests
The authors declare none.