Introduction
Many cognitive processes such as reading, scene perception, and object identification require sequential saccadic eye movements. In conventional event-related potential (ERP) studies, however, subjects are usually asked to maintain their eyes fixated on the display or stimulus durations are short in order to avoid eye movements. Eye fixation–related potential (EFRP) is a type of ERP measuring electrical brain activity in response to eye fixations, but contrary to ERPs, the subjects are allowed to move their eyes during the task performance. The EFRPs are averaged at the offset of saccades, not at the onset of stimulus events, as in the ERP studies.
EFRPs have earlier been recorded in visual pattern reversal (e.g., Yagi, Reference Yagi1979; Yagi et al., Reference Yagi, Kazai and Takeda2000; Kazai & Yagi, Reference Kazai and Yagi2003) and word recognition or reading (e.g., Marton & Szirtes, Reference Marton and Szirtes1988; Baccino & Manunta, Reference Baccino and Manunta2005; Hutzler et al., Reference Hutzler, Braun, Võ, Engl, Hofmann, Dambacher, Leder and Jacobs2007; Simola et al., Reference Simola, Holmqvist and Lindgren2009) tasks. In earlier studies, the EFRPs were obtained by measuring ERPs and electro-oculograms simultaneously (e.g., Marton & Szirtes, Reference Marton and Szirtes1988; Yagi et al., Reference Yagi, Kazai and Takeda2000), whereas in more recent studies, the methodology was improved by measuring eye movements with an eye tracker (Baccino & Manunta, Reference Baccino and Manunta2005; Hutzler et al., Reference Hutzler, Braun, Võ, Engl, Hofmann, Dambacher, Leder and Jacobs2007; Simola et al., Reference Simola, Holmqvist and Lindgren2009). In some studies, eye movements (with an eye tracker) and ERPs were measured in two separate sessions in order to correlate eye movement and ERP data (e.g., Raney & Rayner, Reference Raney and Rayner1993; Sereno et al., Reference Sereno, Rayner and Posner1998, Reference Sereno, Brewer and O’Donnell2003; Sereno & Rayner, Reference Sereno and Rayner2003). Even these earlier studies have provided great amount of information on ERPs, eye movement control, and reading, they were not methodologically as advantageous as more recent EFRP studies.
In visual studies, the most prominent component of the EFRPs is called the lambda response. The lambda response, recorded at the occipital sites, is a positive component, which occurs around 80 ms from the offset of saccade (Kazai & Yagi, Reference Kazai and Yagi2003). The lambda response exhibits changes with properties of visual stimulation (e.g., Kazai & Yagi, Reference Kazai and Yagi1999) and visual information processing load (e.g., Yagi, Reference Yagi1981), and it is elicited by an afferent inflow, which begins at the onset of eye fixation (Yagi, Reference Yagi1979; Kazai & Yagi, Reference Kazai and Yagi2003). The lambda response and P1 component have been suggested to have a common neural generator in the visual cortex (Kazai & Yagi, Reference Kazai and Yagi2003). However, it has been shown that there is a transient cortical excitation following each fixation in the primary visual cortex even in the absence of visual simulation (Maldonado & Babul, Reference Maldonado and Babul2007; Rajkai et al., Reference Rajkai, Lakatos, Chen, Pincze, Karmos and Schroeder2008). In EFRP studies on reading, early components such as N1 and P2 have been associated with processing of word form or word semantics (Baccino & Manunta, Reference Baccino and Manunta2005; Simola et al., Reference Simola, Holmqvist and Lindgren2009). In an EFRP study by Hutzler et al. (Reference Hutzler, Braun, Võ, Engl, Hofmann, Dambacher, Leder and Jacobs2007), a late positive component peaking around at 400 ms was associated with differentiation between (previously read) old and (not previously read) new words. In above-mentioned studies, however, the words were presented in pairs (Baccino & Manunta, Reference Baccino and Manunta2005; Simola et al., Reference Simola, Holmqvist and Lindgren2009) or in a row of five isolated words (Hutzler et al., Reference Hutzler, Braun, Võ, Engl, Hofmann, Dambacher, Leder and Jacobs2007), and thus, it is questionable whether these EFRP paradigms were suitable enough to study the mechanisms of (natural) reading or whether they rather captured processes related to single word recognition.
The aim of the current study was to investigate whether EFRPs vary during consecutive eye fixations in a free-viewing task. The EFRPs were recorded while subjects made a forced-choice decision for real and chimerical objects. It has been shown that object detection and categorization occur within 70 ms after stimulus presentation, whereas identification takes approximately 100 ms more (Grill-Spector & Kanwisher, Reference Grill-Spector and Kanwisher2005). In addition, further processing time is needed for semantic understanding and memory representations to be resistant for conceptual masking (Potter, Reference Potter1976; for review, see Hegdé, Reference Hegdé2008). Also, several ERP components within different temporal time windows have been associated with object detection (e.g., Thorpe et al., Reference Thorpe, Fize and Marlot1996), recognition (e.g., Johnson & Olshausen, Reference Johnson and Olshausen2003), and identification (Doniger et al., Reference Doniger, Foxe, Murray, Higgins, Snodgrass, Schroeder and Javitt2000, Reference Doniger, Foxe, Murray, Higgins and Javitt2002). ERP correlates of object detection or recognition were investigated by showing a visual scene for a short period of time (20 ms) and asking the subjects to indicate whether the scene contained an animal (a go trial) or not (a no-go trial) (e.g., Thorpe et al., Reference Thorpe, Fize and Marlot1996; Fabre-Thorpe et al., Reference Fabre-Thorpe, Delorme, Marlot and Thorpe2001; Rousselet et al., Reference Rousselet, Fabre-Thorpe and Thorpe2002; Johnson & Olshausen, Reference Johnson and Olshausen2003). The results demonstrated an enhanced early frontal negativity specific to no-go trials that appeared around 150 ms after stimulus onset (e.g., Thorpe et al., Reference Thorpe, Fize and Marlot1996; Johnson & Olshausen, Reference Johnson and Olshausen2003) and a later negativity that was elicited between 150 and 300 ms after the stimulus onset (Johnson & Olshausen, Reference Johnson and Olshausen2003). The early negativity was suggested to represent either decision-related activity that is elicited once certain amount of visual processing has already been completed (Thorpe et al., Reference Thorpe, Fize and Marlot1996; Fabre-Thorpe et al., Reference Fabre-Thorpe, Delorme, Marlot and Thorpe2001) or processing of low-level feature differences (e.g., spatial frequency, texture, color, spatial pattern) between the scenes (Johnson & Olshausen, Reference Johnson and Olshausen2003). Johnson and Olshausen (Reference Johnson and Olshausen2003) showed that the later negativity covaried with the subsequent reaction time and proposed that this later component rather than the early component is associated with object recognition (Johnson & Olshausen, Reference Johnson and Olshausen2003). Doniger et al. (Reference Doniger, Foxe, Murray, Higgins, Snodgrass, Schroeder and Javitt2000, Reference Doniger, Foxe, Murray, Higgins and Javitt2002) used fragmented line drawings to study the completion process (“perceptual closure”) during object identification. The subjects were presented with images of line drawings that had been created by removing random segments of images in order to produce eight incrementally fragmented images. The images were presented from least complete to most complete, and after each image presentation, the subjects were asked to indicate if they could name the object or not. The results showed that the amplitude of a negative component peaking at around 300 ms after image presentation (named Ncl) varied as a function of object identification (Doniger et al., Reference Doniger, Foxe, Murray, Higgins, Snodgrass, Schroeder and Javitt2000, Reference Doniger, Foxe, Murray, Higgins and Javitt2002).
To sum up, several different ERP components within 300 ms after stimulus presentation have been recorded during object recognition and identification tasks. The EFRP technique used in the present study has, however, advantages as compared with conventional ERP technique in studying object recognition. It allows us to characterize EFRP variations during consecutive eye fixations, thus representing electrophysiological correlates of visual perception from object detection to identification and decision making.
Materials and methods
Subjects
Ten volunteers (7 females) aged between 22 and 48 years (mean 34 years) participated in the study. Seven subjects were right handed. The subjects had normal or corrected to normal vision, and they gave an informed written consent. The experiment was carried out in accordance with the Declaration of Helsinki.
Stimuli
The subjects were seated at a distance of 60 cm from a computer screen. The stimuli were displayed on an LCD 21-inch monitor (resolution of 1024 × 768 pixels). The mean luminance of the screen was 230 cd/m2. The stimuli were black and white line drawings (Snodgrass & Vanderwart, Reference Snodgrass and Vanderwart1980; Alario & Ferrand, Reference Alario and Ferrand1999). Seven drawings in 12 conceptual categories (84 drawings) were chosen in the study. Twelve categories were matched for picture naming agreement, F(11,72) = 1.03, P = 0.43, image agreement, F(11,72) = 1.33, P = 0.23, and visual complexity, F(11,72) = 1.31, P = 0.23 (Alario & Ferrand, Reference Alario and Ferrand1999). Line drawings for chimerical objects were constructed by joining together two halves of original drawings keeping lines unbroken and continuous. Drawings of living objects were joined (e.g., lion and bird) while drawings of nonliving objects were joined (e.g., airplane and trumpet). Eighty-four different line drawings of chimerical objects were constructed.
Procedure
Subjects were given written instructions and allowed to practice the task for 10 trials before the experiment. A trial started with a fixation cross, presented at the bottom center of the screen. After 3000 ms, a drawing was shown at the center of the screen. The subjects were asked to look at the drawing and press the left or right mouse button, depending on whether the drawing illustrated a real or a chimerical object. Half of the subjects pressed the left button with their index finger for real objects and the right button with their middle finger for chimerical objects, and half of the subjects used opposite fingers for responding. After the button press, the drawing was replaced by a fixation cross for 3000 ms. Subjects performed four blocks of trials, each of them consisting of 84 drawings. Each drawing was presented twice during the experiment. Thus, altogether there were 336 trials, 168 for both types of objects. Each block lasted approximately 6 min. The presentation order of blocks was randomized between the subjects.
Eye movement and EFRP recordings
Eye movements were recorded using an Eyelink II eye tracker (SR Research Ltd., Mississauga, Ontario, Canada) with a 1 kHz sampling rate. The participant’s head was constrained using a forehead and chin frame. A nine-point calibration was executed before each block. The calibration was repeated if the error in any fixation point exceeded 1 deg visual angle or if the average error for all points was above 0.5 deg. First, second, and last fixations (appearing within an area of interest covering the drawing of an object) after appearance of a drawing were included in the analysis. If the first fixation was out of an interest area, it was excluded. If there were only two fixations within the trial, the second fixation was defined as the “last fixation.” If there were three or more fixations within the trial, the last fixation was defined as the one preceding the manual response. Fixations with duration less than 100 ms and trials with only one fixation were excluded from the analysis. Manual reaction times, number of fixations, and fixation durations were calculated.
EFRP recordings were accomplished by connecting two computers through their parallel ports. The first computer was used for stimulus presentation and the eye movement acquisition. One monitor was devoted to stimulus presentation and the other to monitoring the eye-tracking recording (calibration). The second computer was used to collect the electroencephalography (EEG) signals. The coupling of the two systems was achieved by sending synchronization signal (transistor-transistor logic pulse) as soon as fixation onsets and offsets were detected. A postfixation period of 20 ms was used as a baseline. The poststimulus correction procedure has been used earlier in a recent EFRP study (Hutzler et al., Reference Hutzler, Braun, Võ, Engl, Hofmann, Dambacher, Leder and Jacobs2007).
An electro-cap (Electrocap International Inc., Eaton, Ohio) was used to record continuous EEG from 21 Ag/AgCl electrodes referenced to the ear lobes. The electrode placements matched the 10–20 system (Jasper, Reference Jasper1958). Impedances were kept under 15 kΩ. The EEG was amplified (band-pass 0.01–100 Hz, sampling rate 1000 Hz) with a BrainAmp MR 32 system (BrainProducts GmbH, Munich, Germany). EEGs were analyzed off-line with the Brain Vision Analyzer™ software (BrainProducts GmbH). EEG epochs were averaged separately for each subject, type of image (real vs. chimerical), and the order of fixation (first vs. second vs. last fixation). Epochs including artifacts exceeding ±100 μV were excluded from the averages. Frequencies exceeding 30 Hz were digitally filtered (24 dB/octave). Based on average EFRPs across all the subjects, time window for P1 latency and amplitude measurements was chosen to be between 30 and 100 ms (the most positive peak) and for N1 measurements between 70 and 150 ms (the most negative peak). The amplitudes were measured as mean values within a 10-ms window around the individual peak latency.
Statistical analysis
The behavioral results (manual reaction times, the number of fixations, and fixation durations) were subjected to a one-way or two-way repeated measures analyses of variance. EFRPs were statistically analyzed with a repeated measures analysis of variance. All amplitude and latency results of the analyses of variance were Greenhouse–Geisser corrected.
Results
Behavioral results
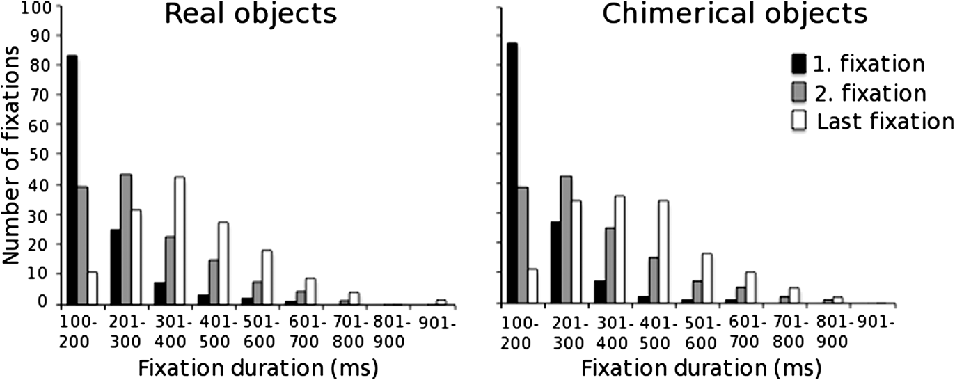
Reaction times (from stimulus onset to button press) were not statistically different for the real (1032 ms) and chimerical (1048 ms) objects. The average number of fixations was also similar for the real (3.33) and chimerical (3.27) objects. The total viewing time was 878 ms for the real and 889 ms for the chimerical objects. Medians of the first, second, and the last fixation durations were 168, 265, and 363 ms for the real and 166, 271, and 385 ms for the chimerical objects, respectively. There was a main effect of fixation order, F(2,18) = 81.27 P < 0.01, but no main effect of task, F(1,9) = 4.87, P = 0.055, on fixation durations. The distributions of fixation durations for real and chimerical objects are illustrated in Fig. 1.
Frequency histograms for fixation durations (millisecond) during the first, second, and last fixation illustrating the mean number of fixations (across 10 volunteers) within nine different time periods (100–200, 201–300 ms, etc.).

EFRP results
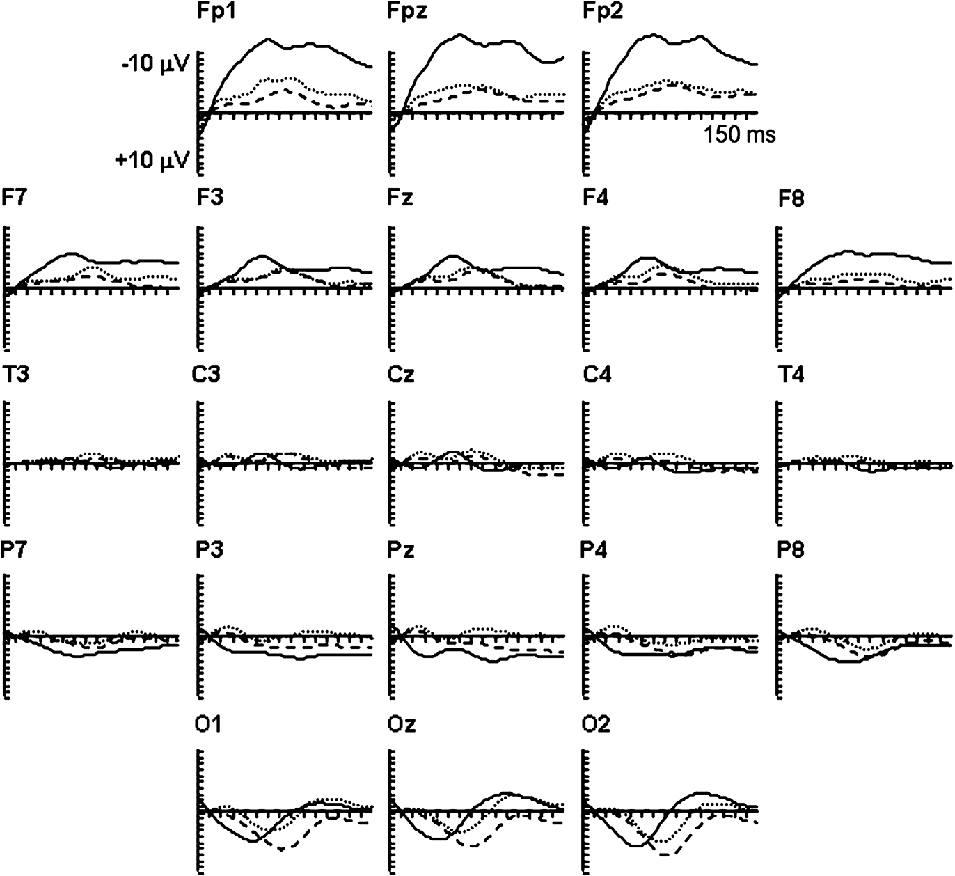
P1 and N1 components, that were maximal at the occipital and parietal recording sites, were elicited by each consecutive eye fixation (Fig. 2). The EFRPs during the first fixation were, however, highly different from the EFRPs during the second and the last fixation, especially at the frontal recording sites. This was probably due to the fact that (due to the experimental paradigm) the mean amplitude of saccade prior to first fixation was larger (amplitude of 11.69 deg) than that of second (amplitude of 2.08 deg) or last (amplitude of 2.02 deg) fixation. Accordingly, the baseline for EEG measurements has been shown to shift according to the size of the saccade at the frontal recording sites (Yagi et al., Reference Yagi, Kazai and Takeda2000). Thus, the EFRPs evoked by the first fixation were excluded from further data analysis, and the electrodes at the occipital and parietal recording sites (O1, Oz, O2, P7, P3, P4, and P8), where P1 and N1 components were maximal, were included in the further statistical analyses. EFRPs were subjected to a three-way repeated measures analysis of variance. The levels were object type (real vs. chimerical objects) × fixation order (second vs. last fixation) × electrode position (seven occipital and parietal recording sites).
Grand-average EFRPs during the first (solid line), second (dotted line), and the last (dashed line) fixation during the postfixation period of 150 ms. The EFRPs obtained during two task conditions (real and chimerical) were averaged in illustration.

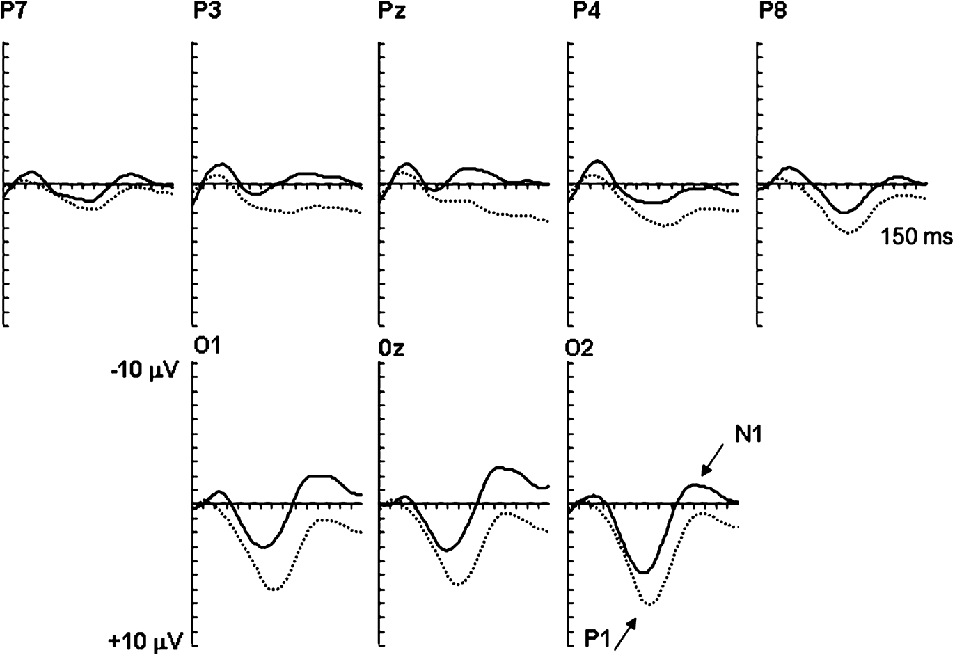
There was no main effect of object type (real vs. chimerical) on the amplitudes, F(1,9) = 0.005, P = 0.95, or latencies, F(1,9) = 0.03, P = 0.88, of P1 component. The main effect of fixation order, F(1,9) = 9.26, P < 0.05, and the interaction between the fixation order and electrode position, F(6,54) = 3.31, P < 0.01, were significant on P1 amplitudes (Fig. 3). Post hoc analyses indicated that the amplitudes of P1 were more positive for the last than for the second fixation at P8, F(1,9) = 15.97, P < 0.005, 0z, F(1,9) = 45.80, P < 0.05, and 01, F(1,9) = 68.52, P < 0.01. The latency of P1 component was significantly shorter for the second (mean 65 ms, s.d. 13 ms) than for the last (mean 71 ms, s.d. 12 ms) fixation (main effect of fixation order: F(1,9) = 8.50, P < 0.02). The interaction between fixation order and electrode position was not, however, significant.
Grand-average EFRPs during the second (solid line) and the last (dotted line) fixation for the postfixation period of 150 ms. There was no significant main effect of object type (real vs. chimerical) on P1 or N1 components, and thus, the EFRPs obtained during these two conditions were averaged in illustration.

The latency of N1 component was not affected by fixation order or object type. On the amplitude of N1, there was a significant main effect of fixation order, F(1,9) = 14.42, P < 0.01, and an interaction between fixation order and electrode, F(6,54) = 3.81, P < 0.05. The amplitude was more negative for the second than for the last fixation at all (e.g., Oz, F(1,9) = 132.71, P < 0.005) but P7 (P = 0.061) electrode positions (Fig. 3).
Discussion
The results of the present study showed that EFRPs recorded at the occipital and parietal recording sites varied during consecutive eye fixations. To our knowledge, this is the first study to demonstrate modulations of EFRPs during consecutive eye fixations and free-viewing object identification task. The latency of P1 component was longer and the amplitude was more positive during the late than the early fixation. The amplitude of N1 component was more negative during the early than the late fixation. Variations in the scalp distribution of P1 and N1 components were not observed in the present study. The present results show that EFRPs exhibit variations in their amplitudes and latencies during consecutive eye fixations, suggesting that this methodology provides a useful tool to study temporal dynamics of visual perception. However, whether progress of visual perception (from object detection to identification and decision making) is exhibited by EFRPs during consecutive eye fixations and whether single eye fixation refers to a stage in recognition process remain to be investigated in further studies with more elaborated experimental designs.
P1 component in the present study most probably corresponds to a prominent EFRP lambda response (e.g., Kazai & Yagi, Reference Kazai and Yagi1999, Reference Kazai and Yagi2003), which is elicited by afferent inflow at the beginning of fixation. It has also been shown that there is a transient cortical excitation, even in the absence of visual stimulation, which occurs within 50–100 ms from the onset of fixation (Maldonado & Babul, Reference Maldonado and Babul2007; Rajkai et al., Reference Rajkai, Lakatos, Chen, Pincze, Karmos and Schroeder2008). This brief cortical excitation has been suggested to increase cortical excitability, which, in turn, amplifies responses to visual simulation and improves fast visual scene perception (see Maldonado & Babul, Reference Maldonado and Babul2007; Rajkai et al., Reference Rajkai, Lakatos, Chen, Pincze, Karmos and Schroeder2008). It was further suggested that fixation-related visual responses (in comparison with conventional visual responses) might exhibit a higher signal-to-noise ratio because of this amplifying effects of fixation (Rajkai et al., Reference Rajkai, Lakatos, Chen, Pincze, Karmos and Schroeder2008). Most probably, the P1 component in the current study represents activity related to cortical excitation in response to (preamplified) visual event.
It has been shown that neural source estimation by dipole modeling requires two dipoles to explain attentional effects on P1 component during a visual discrimination task (Martínez et al., Reference Martínez, Anllo-Vento, Sereno, Frank, Buxton, Dubowitz, Wong, Hinrichs, Heinze and Hillyard1999). The first dipole, accounted for the time interval of 72–96 ms, was localized to the dorsal occipital cortex, whereas the second dipole, for the time period of 104–136 ms, was localized to the ventral occipital cortex, suggesting enhanced processing of visual information in the ventral occipital areas (Martínez et al., Reference Martínez, Anllo-Vento, Sereno, Frank, Buxton, Dubowitz, Wong, Hinrichs, Heinze and Hillyard1999). Accordingly, the increased latency of P1 component in the present study during consecutive fixations may reflect allocation of neural substrates related to more completed object identification. It should be, however, noted that the time difference between two P1 components (during the second and the last fixation) in our study is much longer than the time difference between the two phases of P1 component reported by Martínez et al. (Reference Martínez, Anllo-Vento, Sereno, Frank, Buxton, Dubowitz, Wong, Hinrichs, Heinze and Hillyard1999). Our results showed also that the P1 amplitude was more positive during the late than the early fixations, whereas N1 amplitude was more negative during the early than the late fixations. Some ERP components, such as N1 and P3, have been shown to be sensitive to stimulus repetition, that is, their amplitude decreases with repetition (Picton et al., Reference Picton, Hillyard, Galambos, Keidel and Neff1976). There is also a possibility that attention is fluctuating during consecutive eye fixations and thus affecting the latencies and amplitudes of P1 and N1. To sum up, whether the observed effects on P1 and N1 components in the present study are related to processes associated with completed identification, attention, or stimulus repetition remains to be solved.
Furthermore, the results should be interpreted with some caution. First, the number of preceding eye fixations (and saccadic eye movements) before the early and late eye fixations was different. There was always only one preceding eye fixation before the early eye fixation in contrast to the last eye fixation, which was preceded by one or more eye fixations. Second, since there is no gap, other than saccadic eye movement, between the events (eye fixations), the last eye fixations and their concurrent EFRPs within a trial were probably more influenced by later ERP components (such as P3) than the early eye fixations. In addition, the contribution of several other factors, such as size of preceding saccade on current EFRP components and duration of each fixation, should be examined in future studies in order to understand the detailed mechanisms underlying the EFRPs.
In spite of some methodological drawbacks, coupling of eye movement and ERP recordings provides a valuable tool to explore the mechanisms and time course of visual perception. It also provides information about visual perception driven by individual perception and self-paced cognitive processes, not by stimulus displays, thus giving an opportunity to investigate visual perception in a more natural experimental setting. Recently, two recording techniques, conventional ERPs and EFRPs, were directly compared, and the results indicated that the EFRPs were as reliable indicators of word processing as the conventional ERPs (Hutzler et al., Reference Hutzler, Braun, Võ, Engl, Hofmann, Dambacher, Leder and Jacobs2007). Further studies are, however, needed to establish the technique to be useful in studies of object recognition or visual scene perception.
Acknowledegments
The work was supported by a grant 043261 from PERCEPT (“Perceptual Consciousness: Explication and Testing”) of the EU commission under the STREP-NEST FP6 action.