I. INTRODUCTION
Thin films that have excellent chemical, wear, and corrosion resistances are often used as a protection layer for functional materials.Reference Huang, Winchester, Suvorova, Lawn, Liu, Hu, Dell and Faraone1 In such a film/substrate system, the interfacial adhesion between the film and the substrate plays a vital role in determining the durability and reliability of the system.Reference Kriese, Gerberich and Moody2 As a consequence, numerous testing methods have been developed for understanding the underlying mechanism for interfacial delamination and measuring the adhesive strength at the interface, such as indentation,Reference Malzbender and With3 scratch,Reference Venkataraman, Kohlstedt and Gerberich4 overlayer stressing,Reference Volinsky, Moody and Gerberich5 pull-out tensile testing,Reference Zhang, Wang, Zeng, Khor, Weng and Sun6 tape peeling,Reference Jacobsson7–Reference Kim, Kim and Kim9 and bendingReference Dauskardt, Lane, Ma and Krishna10,Reference Litteken, Dauskardt, Scherban, Xu, Leu, Gracias and Sun11 methods. Among them, indentation has been considered as an effective technique to investigate the interfacial fracture since Marshall and EvansReference Marshall and Evans12,Reference Evans and Hutchinson13 investigated the indentation-induced delamination and buckling of the films with residual compressive stress.
In an indentation test, the delamination may occur during either loading or unloading,Reference Hara, Kumagai, Izumi and Sakai14–Reference Abdul-Baqi and Giessen18 which is related to the mechanical properties of the film and the substrate, as well as the indenter geometry.Reference Chen and Bull17 The evidence of delamination can be observed from the indentation load–displacement curve, or P–h curve.Reference Li16,Reference Abdul-Baqi and Giessen18,Reference Chen, Yeap, She and Liu19 If delamination occurs during loading, a film tends to buckle under compressive stress. It may cause chipping if the film is brittle, generating a displacement excursion on the P–h curve.Reference Malzbender and With3,Reference Volinsky, Moody and Gerberich5,Reference Zhang and Zhang20,Reference Li and Siegmund21 Delamination occurred during unloading is caused by tensile stress developed at the interface when the indenter withdraws, resulting in an abrupt change in displacement, which is often known as “elbow” or “extra linear recovery.”Reference Chen and Bull22,Reference Hainsworth, McGurk and Page23 The extra linear recovery was typically observed when indenting a harder film on a softer substrate, such as in our previous study on a SiNx/GaAs film/substrate system,Reference Lu, Xie, Huang, Zou and He24 which was associated with interfacial delamination. It was found that when both the film and the substrate recovered during unloading, tension was built up at the interface owing to the mismatch in elasticity and plasticity between the film and the substrate.Reference Lu, Xie, Huang, Zou and He24 When the tensile stress exceeded the interfacial strength, delamination occurred, and the detached film then behaved like elastically bent plate under further loading.Reference Chen and Bull22
Different types of energy methods were proposed to quantitatively address the interfacial toughness via the energy balance concept.Reference Malzbender and With3,Reference Chen and Bull22,Reference Hainsworth, McGurk and Page23,Reference Toondera25 Obviously, compared to stress analysis, the energy methods appear simpler and more intuitive and practical for indentation testing. Nevertheless, appropriate assumption must be made to determine the delaminated area and to handle the energy conversion during indenting, otherwise, significant error might be induced in the estimation of interfacial strength.
In this work, we proposed a new energy method to calculate the interfacial strength of a SiNx/GaAs film/substrate bilayer system based on the nanoindentation-generated P–h curves. The proposed method was validated using the finite element model (FEM) simulation. The practical work of adhesion obtained was in reasonably good agreement with the experimental result.
II. THEORETICAL BACKGROUND
A. Energy balance in indentation
Theoretically, the true work of delamination, J, is the amount of energy required for creating per unit area free surfaces from the bonded materials, whereas the practical work of delamination, R, is the work per unit area required for generating delamination.Reference Venkataraman, Kohlstedt and Gerberich4 In fact, R is the sum of the true work, the plastic energy dissipation, and the small amount of energy lost due to the friction during a delamination process, the viscous deformation of the cracked surfaces, the work done for atom rearrangement in phase change at the crack tip and the like.Reference Venkataraman, Kohlstedt and Gerberich4,Reference Volinsky, Moody and Gerberich5 Experimental nanoindentation testing can only measure R, not J, because both the film and the substrate will experience plastic deformation during testing. Therefore, the extraction of J from the measured R needs to know the work for plasticity, which is often difficult to measure.Reference Lane26,Reference Shet and Chandra27
According to the theory of fracture mechanics,Reference Lawn28 if the material with a crack inside is loaded by a force, P, the crack will propagate to generate a new cracking area, dA. This will lead to a change in elastic energy stored (in the form of strain), dU. Assuming that P moves a displacement of δ, the external work done is thus Pdδ. If yielding occurs, the energy consumed in bulk plastic deformation is dE p. The work done by P should be balanced by the energies consumed, so we have,
 $$P{\rm{d\delta }} = {\rm{d}}U + {\rm{d}}E_{\rm{p}} + J{\rm{d}}A\quad ,$$
where J is the true work for delamination. Here, we have neglected the small amount of energy lost due to the friction, viscous deformation, and atom rearrangement. For an indenting process, Eq. (1) can be rewritten as,
 $$W(h) = U(h) + E_{\rm{p}} (h) + J \cdot A(h)\quad ,$$
where W(h) is the work done by the indenter from the beginning of indentation to the indentation depth of h, U(h) the elastic energy stored, E p(h) the energy dissipated through plastic deformation, and A(h) the delaminated area.
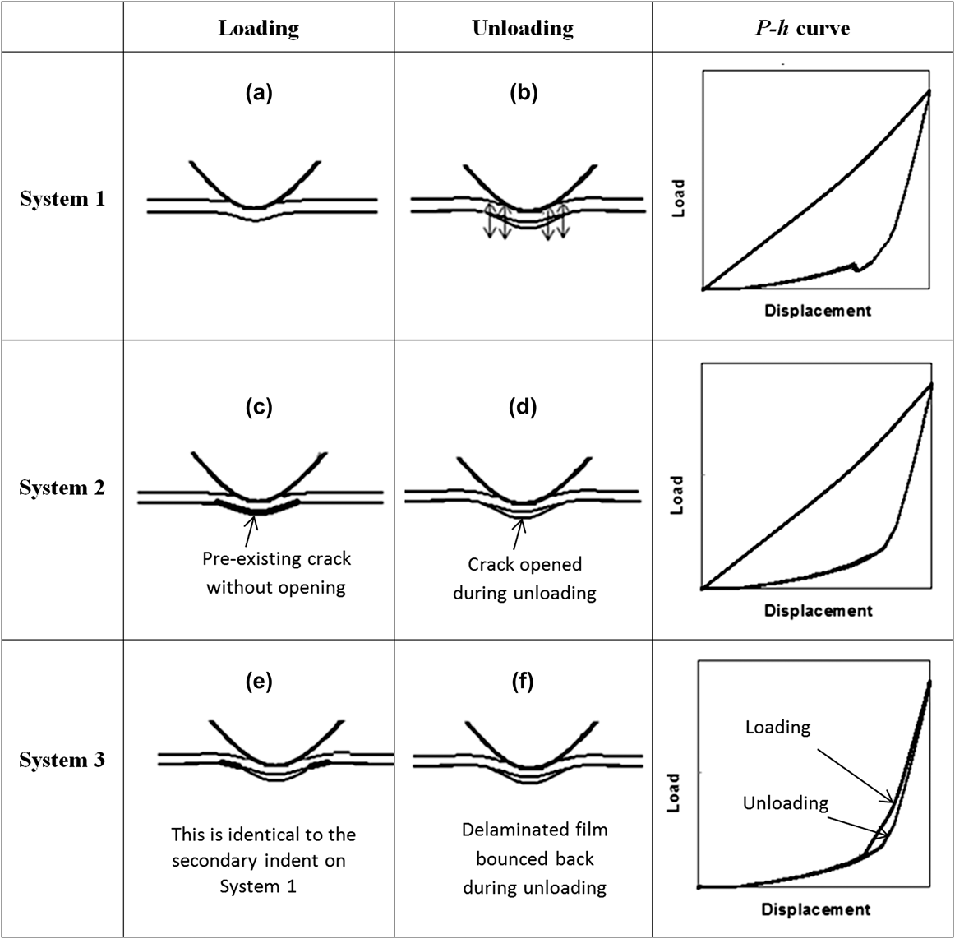
Assuming we have two bilayer systems, system 1 is a normal bilayer system that has a harder film deposited on a softer substrate and its interface has a finite interfacial strength, as shown in Fig. 1(a). System 2 has the same film and substrate as system 1 but has a preexisting crack that is identical to the indentation-induced crack of system 1, as shown in Fig. 1(c). The imaginary crack is assumed to be closed, i.e., the film and the substrate are still in contact prior to loading. During indenting, energy balancing gives
 $$E_{{\rm{p1}}} (h) + U_1 (h) + J \cdot A(h) = W_1 (h)\quad \quad {\rm{for}}\;{\rm{system\; 1}}\quad {\rm{,}}$$
 $$E_{{\rm{p2}}} (h) + U_2 (h) = W_2 (h)\quad \quad {\rm{for}}\;{\rm{system\; 2}}\quad {\rm{.}}$$
Schematic illustration of indentation-induced deformation during loading and unloading and the corresponding P–h curves of systems 1, 2, and 3.

Subtracting Eq. (4) from Eq. (3) yields
 $$\eqalign{[E_{{\rm{p1}}} \left( h \right) - E_{{\rm{p2}}} (h)]{\rm{}} + J \cdot A(h) = \,[W_1 \left( h \right) - W_2 (h)] \cr+ [U_2 \left( h \right) - U_1 (h)]\quad .$$
According to the definition of practical work for delamination defined earlier, the left side of Eq. (5) equals to R·A. For the right side of Eq. (5), U 1 should equal to U 2 at the end of indentation as long as the film bounce back to its original place, releasing its bending strain, whose verification was numerically given later in this paper. So at the end of indentation, Eq. (5) can be rewritten as
 $$R \cdot A = W_1 - W_2 \quad .$$
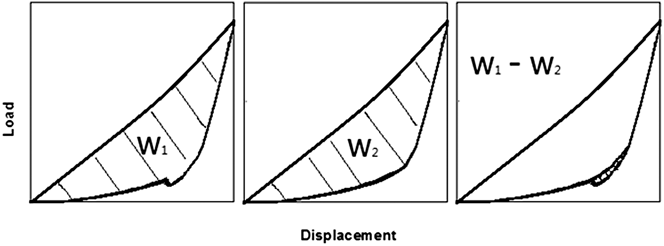
Equation (6) indicates that the practical work for delamination equals the difference of the mechanical works done by the indenter on two bilayer systems without and with a precrack, i.e., systems 1 and 2, shown in Fig. 1. If the P–h curves of the two systems can be obtained from indentation testing and A can be estimated, R can be determined.
B. Determination of W 1 − W 2
As shown in Fig. 2, W 1 − W 2 is the difference of works done during indenting on systems 1 and 2. System 1 is a normal film/substrate bilayer, whose P–h curve can be obtained from the nanoindentation test. However, system 2 is imaginary, whose P–h curve cannot be measured directly. From stress analysis, we understand that the preexisting crack does not affect the indentation loading but does affect unloading. Therefore, the loading curve of system 2 should be identical to that of system 1. To obtain the unloading curve of system 2, we can image a system that has an open preexisting crack, i.e., system 3, shown in Figs. 1(e) and 1(f), and the crack will not further propagate during indenting. The crack will be closed during loading, creating a status identical to that in Fig. 1(c). During unloading, the film will bounce back, restoring to the status prior to the indentation. So system 3 is in fact the secondary indentation of the system shown in Fig. 1(b). Thus, we can perform the secondary indentation on the same position of the first indentation on system 1 to achieve the unloading curve of system 2. By combining the loading curve of the first indentation and the unloading curve of the secondary indentation of system 1, the P–h curve of system 2 is obtained. Subtracted the area W 2 from W 1, W 1 − W 2 is determined experimentally, as shown in Fig. 2.
Determination of the work done for indentation-induced delamination, W 1 − W 2.
C. Determination of A
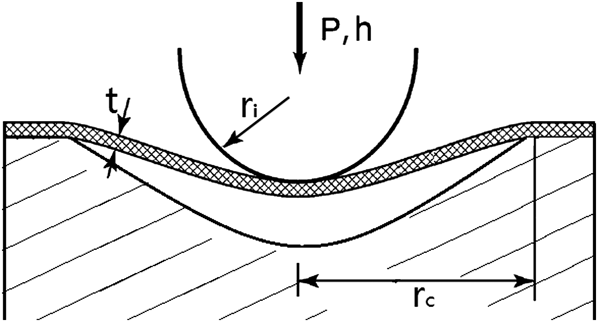
It is difficult to directly measure the geometry of an interfacial crack underneath the film or coating. Nevertheless, if an axisymmetric indenter is used, the interfacial crack being generated due to indentation-induced delamination can be approximated as a diaphragm clamped on a circular boundary.Reference Wei, Liang, Ai and Lin29 By measuring the deflection of the diaphragm under an indentation load, the radius can be calculated. The measuring accuracy is thus related to the material property and boundary condition of the diaphragm, the indenter geometry, and contact and loading conditions. In this work, we used the Hertz contact loaded plate modelReference Scott, Begley, Komaragiri and Mackin30 to estimate the crack radius induced by a spherical indenter, as shown in Fig. 3. In this model, both contact stiffness and bending stiffness of the film are considered. The relationship between an indentation load and the resultant deflection of the clamped diaphragm under a load of P is expressed as
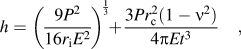 $$h = \left( {{{9P^2 } \over {16r_{\rm{i}} E^2 }}} \right)^{{1 \over 3}} + {{3Pr_{\rm{c}} ^2 \left( {1 - {\rm{\nu }}^2 } \right)} \over {4{\rm{\pi }}Et^3 }}\quad ,$$
where h is the indentation depth, P the load, r i the indenter tip radius, E the elastic modulus of the film, r c the crack radius, and t and υ are the thickness and the Poisson's ratio of the film respectively. r c can be obtained by fitting the deflection curve calculated using Eq. (7) to the part of “extra linear recovery” of the P–h curve obtained from the nanoindentation test using MATLAB.Reference Lu, Xie, Huang, Zou and He24 With the radius known, the area of delamination can be calculated by
 $$A = {\rm{\pi }}r_{\rm{c}}^2 \quad .$$
Illustration of the Hertz contact loaded plate model.
III. FEM VERIFICATION
FEM was used to test if the proposed method works. The numerical analysis particularly aimed to check if the assumptions made in Sec. II are true. This includes (i) if the elastic energy stored in system 1 equals to that in system 2, i.e., if U 1 ≈ U 2, at the end of indentation, (ii) if the loading curve of system 2 can be replaced by that of system 1 and the unloading curve of system 2 can be replaced by that of system 3 (i.e., the secondary indentation on system 1); and (iii) if the estimation of crack radius is accurate.
A. The model
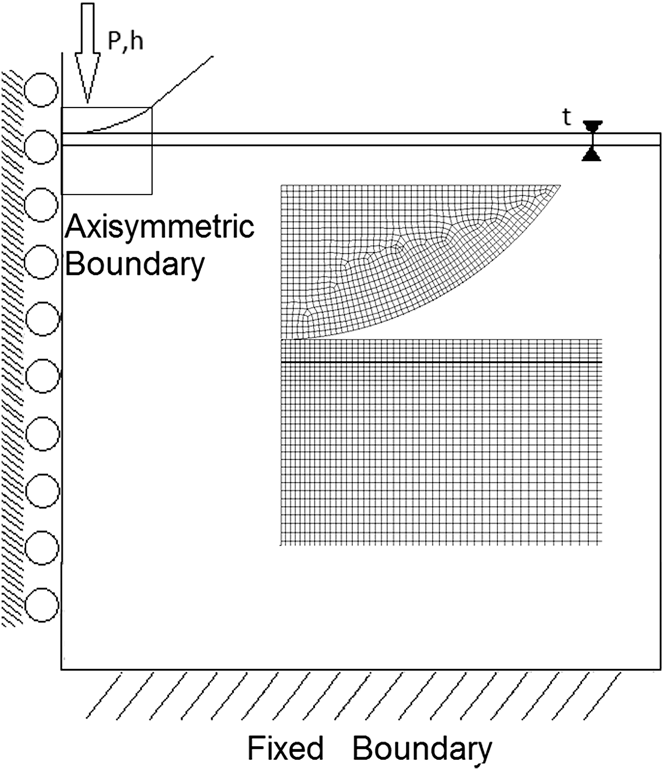
The FEM analysis was carried out using ANSYS® software. A 2D axisymmetric FEM model was established to simulate an indentation process, which consists of a spherical indenter and a film/substrate bilayer system, as shown in Fig. 4. The bilayer specimen used in the model was approximately 20 times larger than the indented area. The bottom of the substrate was constrained using fixed boundaries. The system was meshed using a graduated mesh size, with the contact area having the finest mesh. The system consisted of 11,622 quadrilateral elements.
The FEM indentation model.
The spherical indenter of a tip radius of 5.6 μm was modeled as a rigid body. The film and the substrate were 480 nm and 1 mm in thickness, respectively. Both the film and the substrate were approximated as elastic perfect plastic materials,Reference Lu, Xie, Huang, Zou and He24 with elastic moduli of 150 GPa for the film and 120 GPa for the substrate, and the yield strengths of 15 GPa for the film and 5.5 GPa for the substrate, respectively. The material properties used allowed us to obtain an excellent agreement between experimental and simulation P–h curves.Reference Lu, Xie, Huang, Zou and He24
The adhesion at the interface between a film and a substrate was modeled using the cohesive elementsReference Hu, Chou and Thompson31–Reference Needleman34 that follow an exponential traction-separation law. The friction coefficient between the film and the substrate was set to be sufficiently large to avoid sliding, i.e., no friction energy dissipation was assumed (f = 0.4 used in our FEM model). The cohesive energy, or the true work for delamination, J, was governed by a constitutive equation known as the traction-separation law35:
 $$J{\rm{}}({\rm{\delta }}n){\rm{}} = e{\rm{\sigma }}_{{\rm{max}}} {{\bar \delta }}_n [1 - (1 + \Delta _n )e^{ - \Delta _n } ]\quad ,$$
 $$T_n = {{\partial {\rm{\Gamma}}({\rm{\delta }})} \over {\partial {\rm{\delta }}_n }} = e{\rm{\sigma }}_{{\rm{max}}} \Delta _n e^{ - \Delta _n } \quad ,$$
where σmax is the maximum normal traction at the interface,  $\Delta _n = {\textstyle{{{\rm{\delta }}_n } \over {{{\bar \delta }}_n }}}$, δn is the normal and tangential interfacial separation,
 ${{\bar \delta }}_n $ is the cohesive length, or the normal separation across the interface where the maximum normal traction is attained. T n is the normal traction acting on the interface. Detailed information on the modeling of the interface can be found elsewhere.Reference Lu, Xie, Huang, Zou and He24
B. FEM simulation results
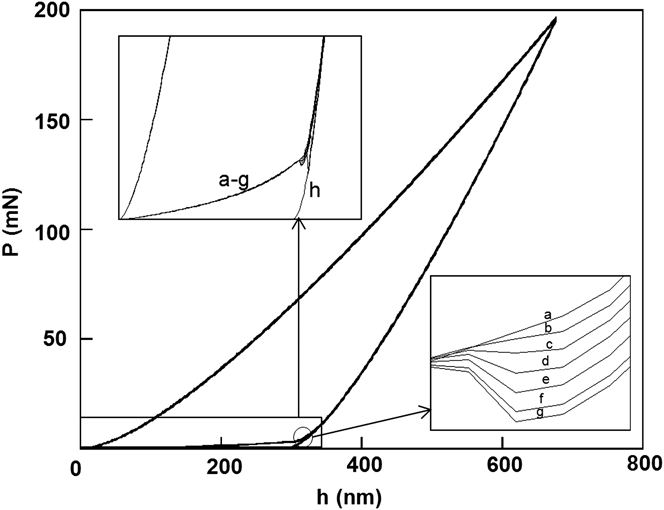
The load–displacement curves obtained from the FEM simulation are shown in Fig. 5, where different cohesive energies were used in the model to examine their effect on the extra linear recovery. All the loading curves are perfectly overlapped as sliding in the tangential direction and the friction dissipation were not included in the model.
The P–h curves for various cohesive energies of 0 [curve (a), which is equivalent to the interface with a preexisting crack], 0.46 (b), 0.91 (c), 1.37 (d), 1.83 (e), 2.28 (f), 2.74 (g), and 3.20 J/m2 (h).
It is seen in Fig. 5 that all the curves have extra linear recoveries at the end of unloading, except for the case with a cohesive energy of 3.2 J/m2. In that case, the indentation load was insufficiently great to induce delamination, in other words, the interface was too strong to be detached from the substrate under the present load of 195 mN. Careful examination revealed that “humps” exist at the bottom of the unloading curve or the starting of extra linear recovery for higher cohesive energies used.
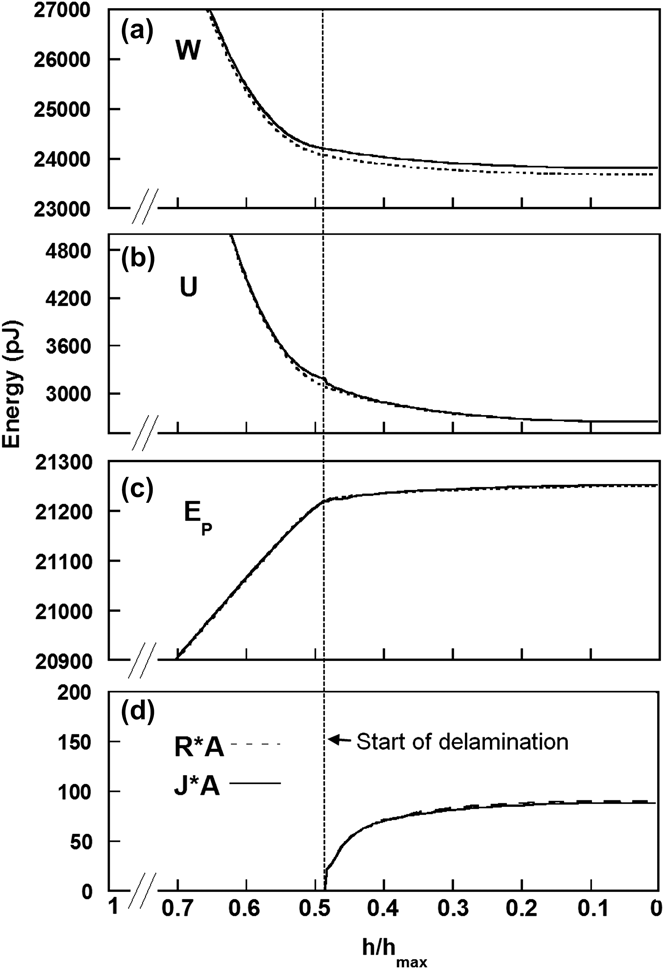
W, U, E p, J·A, and R·A were computed for both systems 1 and 2. The work done by the indenter (W) was calculated by integrating the indentation load (P) against the indenter displacement (h). The elastic energy (U) and plastic energy (E p) were obtained from the FEM simulation. J·A and R·A were obtained from Eqs. (3) and (6), respectively. Figure 6 shows the typical time histories (plotted as a function of indenter displacement h/h max) for system 1 that has a finite strength interface, i.e., J = 2.74 J/m2, and system 2 with a precracked interface, i.e., J = 0 J/m2. As shown in Fig. 6(b), the elastic energies of the two systems remained the same till delamination occurred. Right prior to delamination, system 1 had slightly greater elastic energy than system 2, but they reach the same value at the end of indentation. This clearly demonstrated that our assumption, U 1 ≈ U 2, was appropriate.
(a) The work done by the indenter, W, (b) the elastic energy, U, (c) the plastic energy, E p, and (d) the true work, J × A, for delamination as a function of indenter displacement. Solid line: the system with an interfacial strength of 2.74 J/m2; dotted line: the precracked system with an interfacial strength of 0 J/m2.
Figure 6(c) shows the plastic energy curves of the two systems, which are almost identical. Figure 6(d) shows the true and practical works for delamination, where J and R are almost equal too. This is because the difference in energy consumed for plastic deformation during indentation between the systems with and without interfacial adhesion was extremely small, as shown in Fig. 6(c), indicating that there was insignificant plastic energy consumed in the delamination. However, for bilayers with relatively low ratio of yield strength over interfacial strength, the plastic energy dissipation for system 1 should be distinctly higher than that for system 2 because plastic deformation is associated with delamination. In that case, the practical work would be slightly greater than the true work for delamination. Figure 6 also demonstrates that the total work equals to the summation of the elastic energy, the energy for plastic deformation, and the true work for delamination, i.e., W = U + E p + JA.
To demonstrate if the loading curve of system 2 can be replaced by that of system 1 and its unloading curve can be replaced by that of system 3, the indenting processes of a bilayer system with interfacial strengths of 2.74 and 0 J/m2 (or systems 1 and 2) and the secondary indenting process of system 1 (or system 3) were simulated and their P–h curves are shown in Figs. 7(a)–7(c), respectively. In Fig. 7(b), the loading and unloading curves of the secondary indentation are overlapped, indicating that the delaminated film behaved like a suspended membrane. For comparison, those three curves are also replotted in Fig. 7(d). It is seen that the loading curves of systems 1 and 2 and the unloading curves of systems 2 and 3 are in excellent agreement, clearly suggesting that our assumption (2) was correct.
The P–h curves of (a) the first indentation on a bilayer system with interfacial strength of 2.74 J/m2, i.e., system 1, (b) the secondary indentation on system 1 and (c) the first indentation on a bilayer system with a closed preexisting crack, i.e., system 2. (d) All the curves in (a), (b), and (c) are replotted for comparison.
For different cohesive energies initially input into the FEM model, the values of J·A were obtained from the FEM simulation and are plotted as a function of the input J in Fig. 8(a). The crack length r c was obtained from the Hertz contact loaded model and plotted in Fig. 8(b). Dividing J·A by the delamination area  $A = {\rm{\pi }}r_c^2 $, the true works from the simulation were obtained and are plotted as a function of the input J in Fig. 8(c). It is apparent that the computed J is approximately equal to the input J, suggesting that the assumptions made are appropriate and the estimation of delamination area is sufficiently accurate.
(a) The true work for delamination, (b) the crack radius, and (c) the interfacial strength obtained from FEM simulation are plotted as a function of cohesive energy input initially into the model.
To further examine the accuracy of the crack radius estimation, the FEM simulation was used to generate the P–h curves and compute the delamination area. Figure 9 shows the P–h curves for different indentation loads. By substituting the crack radii obtained from FEM into Eq. (7), the deflection of the delaminated film was calculated using the Hertz model shown in Fig. 3. The inseted plot in Fig. 9 shows the comparison of the extra linear recoveries between the FEM and the Hertz model. The deflection estimated using the Hertz model is in excellent agreement with the FEM simulation, with R 2 values in the range of 0.94–0.98.
The P–h curves obtained from the FEM simulation under different indentation loads for the system of interfacial energy of 2.74 J/m2.
IV. EXPERIMENTAL TESTING
Three different SiNx/GaAs bilayer specimens were used in this study. The GaAs substrates have a sufficient thickness of several millimeters. The SiNx films have thicknesses of 523, 489, and 495 nm, respectively. The films were deposited using plasma-enhanced chemical vapor deposition (PECVD) on GaAs substrates using a Trikon PECVD system (SPTS Technologies, Newport, Wales). The deposition temperature for the dense and compressive SiN films was 250 °C and that for the DL-com SiN was 300 °C. The deposition was performed in a nitrogen atmosphere with a gaseous mixture of SiN4, NH3, and N2 at different flow rates. The deposition temperature was 250 °C. Detailed information on the three specimens is shown in Table I.
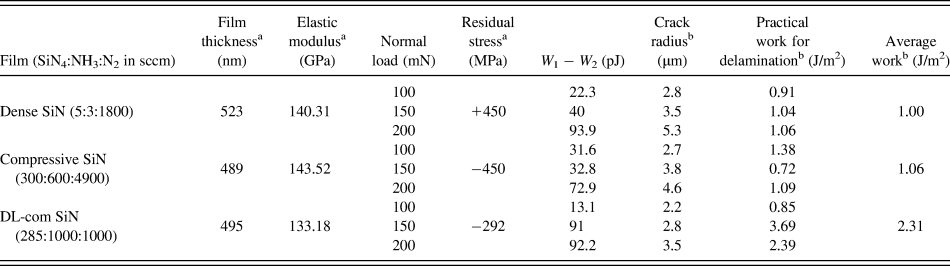
Specimen and indentation conditions and the calculated values of crack radius and practical work for delamination.
a Measured.
b Calculated.
Nanoindentation tests were performed at room temperature on a Triboindenter (Hysitron TI900, MN). A Berkovich indenter of an included angle of 142.3° and a tip radius of 100 nm was used to measure the elastic moduli of the GaAs bare wafer and two SiNx/GaAs bilayer specimens using the method described in Ref. Reference Lu, Xie, Huang, Zou and He24. The measured values of elastic modulus are shown in Table I too. A conical indenter of an included angle of 60° with a spherical tip of 5.6 μm in radius was used. Different indentation loads of 100, 150, and 200 mN were used. The load function used was 10 s for loading, 10 s for holding at the maximum load, and 15 s for unloading. For each specimen, both the first and second indentations were performed on the same spot using same loading conditions.
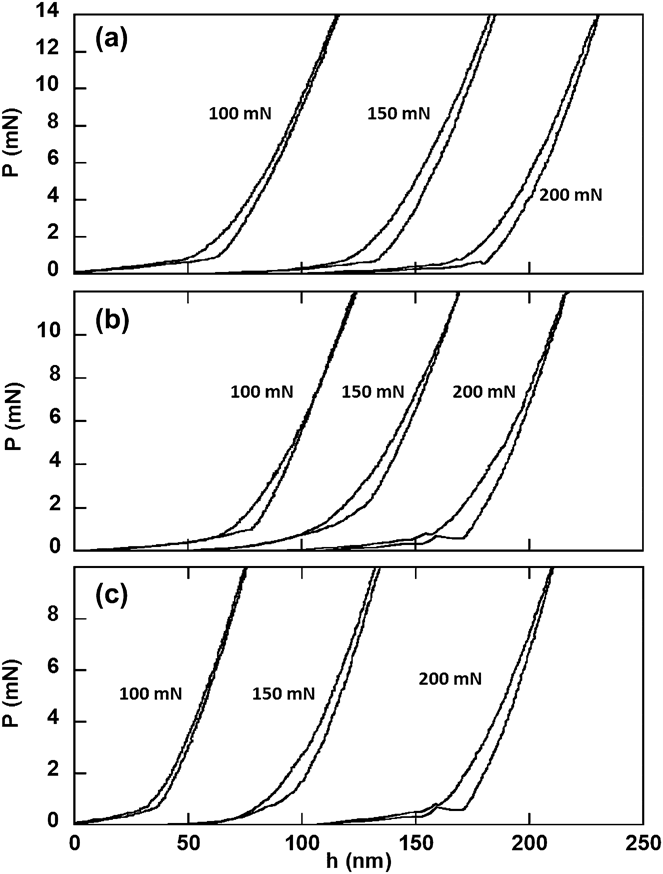
The P–h curves of the first and the second indentations of all the three samples were obtained. The first indentation curve was subtracted by the secondary indentation curve and all those curves obtained after subtraction are plotted in Fig. 10. The area enclosed by the curves gives the value of W 1 − W 2 for a given load. It should be noted that in Fig. 10, the displacement coordinate was shifted to separate the curves generated using different loads, but such shifting would not affect the calculation of W 1 − W 2. It is seen that “humps” occasionally occurred during the unloading of the first indentation, but the unloading curves of the secondary indentation are smooth. The areas enclosed were calculated using trapezoidal integration with MATLAB. The crack radius was estimated by fitting the extra linear recovery curve using Eq. (7). The practical works for delamination, R, were thus calculated using Eq. (6). All the computed results are summarized in Table I.
The subtracted P–h curves for calculating W 1 − W 2 under three different indentation loads of 100, 150, and 200 mN for the three SiN films (a) dense, (b) compressive, and (c) DL-com.
As shown in Table I, for the dense SiN, the works obtained varied from 0.91 to 1.06 J/m2, giving an average value of 1 ± 0.05 J/m2 and the works for the compressive SiN varied from 0.72 to 1.38 J/m2, giving an average value of 1.06 ± 0.33 J/m2. The data appear to be reasonably consistent for the same film. The works obtained from the three different indentation locations of the DL-com SiN specimen were 0.85, 2.39, and 3.69 J/m2, giving an average value of 2.31 J/m2 with a deviation of 1.42 J/m2. The data for the DL-com SiN appear scattered. The scattering was likely attributed to the microstructural inhomogeneity of the film being tested as nanoindentation detects highly localized property at the submicron scale, and the method proposed is sensitive to the area enclosed by the indentation P–h curves that reflect the localized property. It should be noted that the average works for delamination that were obtained from our other work using a different experimental approachReference Lu and Huang36 were 1.6 ± 0.21 J/m2 for compressive SiN and 0.98 ± 0.15 J/m2 for DL-com SiN, respectively. For the DL-com specimen, the lowest value of 0.85 J/m2 obtained from this method is close to the average value of 0.98 ± 0.15 J/m2 from the experimental approach,Reference Lu and Huang36 but fairly great difference does exist in average values from the two methods. Considering the relatively inhomogeneous property of the PECVD SiNx films fabricated at low temperatures and the complex nature of interfacial adhesion characterization, the results obtained from this study are in reasonably good agreement with those in Ref. Reference Lu and Huang36. Future work should be carried out to understand the effect of microstructure of the film/substrate systems on interfacial adhesion, which would help improve the accuracy of the testing.
It should be noted that residual stress in a film would affect the accuracy in estimating the practical work for delamination. Residual compressive stress in a film was found to obstruct interfacial delamination, whereas tensile stress often enhanced delamination.Reference Abdul-Baqi and Giessen18 The residual stress in a film being bent can be decomposed into out-of-plane and in-plane components. For the dense SiN film, tensile stress should enhance unbending and hence delamination. On the other hand, for the compressive and DL-com SiN specimens, residual compressive stress would obstruct delamination. Therefore, the practical work for delamination would be overestimated for the compressive and DL-com SiN but underestimated for the dense SiN. Apparently, inhomogeneity in stress distribution would also affect the testing accuracy.
V. CONCLUSIONS
An energy balance method was proposed to determine the practical work for delamination for a film/substrate bilayer system. The load–displacement curves from the first and second indentations of the bilayer system were used to calculate the practical work done for delamination, and the Hertz contact loaded model was used to estimate the delaminated area. The FEM simulation demonstrated that the energy balance method developed was reliable and the estimation of delamination area using the Hertz model was accurate. The developed method was used to measure the interfacial adhesion of the PECVD SiNx/GaAs film/substrate systems. The practical works for delamination for the three SiNx film specimens were 1, 1.06, and 2.3 J/m2, which are in reasonably good agreement with those obtained using a different testing method.Reference Lu and Huang36
ACKNOWLEDGMENTS
The authors would like to acknowledge the financial support of WIN Semiconductors Co. and Australian Research Council (ARC). They are grateful to Mingyuan Lu and Shiliang Wang for their valuable comments and Anshun He and Chengwei Kang for experimental assistance. HH is financially supported by ARC under the Future Fellow Program.