Introduction
Insects are the most diverse class of organisms (Grimaldi and Engel Reference Grimaldi and Engel2005). Within Insecta, Hymenoptera are one of the most successful orders, comprising ~120 000 described species. This high diversity places it just behind Coleoptera and Lepidoptera, but some hymenopterists argue that if undescribed species were included, Hymenoptera would be a more species-rich taxon than any other insect order. Hymenoptera are presently divided into two suborders: Symphyta, a paraphyletic grouping that comprises the basal lineages branching off from the branch leading to the second suborder, the monophyletic Apocrita (Grimaldi and Engel Reference Grimaldi and Engel2005; Sharkey Reference Sharkey2007). Symphyta includes 8353 described species (Taeger et al. Reference Taeger, Blank and Liston2010; Taeger and Blank Reference Taeger and Blank2011), all of which, except those in Orussidae, are phytophagous at the larval stage (Grimaldi and Engel Reference Grimaldi and Engel2005; Sharkey Reference Sharkey2007).
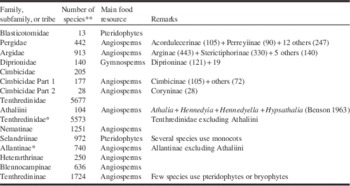
Tenthredinoidea, the most species-rich superfamily in Symphyta, comprises six families with ~7400 species (Taeger et al. Reference Taeger, Blank and Liston2010; Taeger and Blank Reference Taeger and Blank2011). Each family or subfamily is associated with a main host plant group. Argidae, Cimbicidae, Pergidae, and Tenthredinidae (except for Selandriinae) include ~6300 species (85% in Tenthredinoidea) and mainly use angiosperms as a host. The families not using angiosperms as host plants are less species-rich, e.g., Diprionidae (2%; 140 species) use gymnosperms, and Blasticotomidae and Selandriinae (Tenthredinidae) (13%; ~1000 species) mainly use pteridophytes (Table 1; e.g., Goulet and Huber Reference Goulet and Huber1993; Costa and Louque Reference Costa and Louque2001; Naito Reference Naito2004; Grimaldi and Engel Reference Grimaldi and Engel2005; Schmidt and Smith Reference Schmidt and Smith2006; Yoshida Reference Yoshida2006; Badenes-Perez and Johnson Reference Badenes-Perez and Johnson2007; Blank et al. Reference Blank, Groll, Liston, Prous and Taeger2012). The species richness of Tenthredinoidea may have resulted from its use of angiosperms as host plants because insect groups that feed on angiosperms are generally species-rich (Futuyma and Agrawal Reference Futuyma and Agrawal2009). Several studies have reported the relationship between a host plant group and lineage diversity. For example, Farrell (Reference Farrell1998) reported that diversity in Coleoptera was caused by a host shift to angiosperms from gymnosperms, and Wiegmann et al. (Reference Wiegmann, Regier and Mitter2002) reported that in Lepidoptera, the number of species in the basal lineage that feeds on gymnosperms is much smaller than that in a sister lineage that feeds on angiosperms. Janz et al. (Reference Janz, Nylin and Wahlberg2006) showed that species diversity in Nymphalinae (Lepidoptera: Nymphalidae) was driven by host plant diversity.
The number of species, main food resource and remark for Tenthredinoidea.

Note: *According to result from molecular phylogeny in this study (see Fig. 2).
Note: **According to Taeger and Blank (Reference Taeger and Blank2011).
Thus, heterogeneity in species richness among tenthredinoid species could be related to host plant usage, and the shift in diversification could have occurred during the evolution of Tenthredinoidea. To clarify heterogeneity in species richness among families and subfamilies belonging to Tenthredinoidea, we performed a comparative analysis of species richness among sister taxa similar to the analysis of Mayhew (Reference Mayhew2002) and also used in several other studies of species richness in insects and plants (Davies et al. Reference Davies, Barraclough, Chase, Soltis, Soltis and Savolainen2004; Hunt et al. Reference Hunt, Bergsten, Levkanicova, Papadopoulou, St. John and Wild2007; Davis et al. Reference Davis, Baldauf and Maythew2009, Reference Davis, Baldauf and Maythew2010). Among these studies, Davis et al. (Reference Davis, Baldauf and Maythew2010) demonstrated the supertree method and the comparison of species richness in sister taxon analysis to identify the origin of species richness in Hymenoptera. Their results indicated that the possible drivers of specific adaptive radiations included key anatomical innovations, the exploitation of species-rich host groups, and an association with angiosperms. In contrast, low species richness may have resulted from geographical isolation, specialisation for a narrow ecological niche, a habitat loss, and competition. In Tenthredinoidea, Davis et al. (Reference Davis, Baldauf and Maythew2010) attributed the low species richness of Blasticotomidae to the specialised ecological niche occupied by this family.
To compare species richness among sister taxa, a phylogenetic tree must first be constructed. Recent phylogenetic analyses of Tenthredinoidea have been based on molecular data (Heraty et al. Reference Heraty, Ronquist, Carpenter, Hawks, Schulmeister and Dowling2011); molecular and morphological data (Schulmeister et al. Reference Schulmeister, Wheeler and Carpenter2002; Schulmeister Reference Schulmeister2003b; Sharkey et al. Reference Sharkey, Carpenter, Vilhelmsen, Heraty, Liljeblad and Dowling2012); or molecular, morphological, and fossil data (Ronquist et al. Reference Ronquist, Klopfstein, Vilhelmsen, Schulmeister, Murray and Rasnitsyn2012). The resulting phylogenetic trees have some features in common, namely the monophyly of Tenthredinoidea, Argidae, Pergidae, and Argidae+Pergidae; the ancestral state of Tenthredinoidea represented by Blasticotomidae; and construction of a single lineage from Diprionidae, Cimbicidae, and Tenthredinidae. They disagree on the phylogenetic relationships among Diprionidae, Cimbicidae, and Tenthredinidae and on the monophyly of Tenthredinidae (including Athalia). Thus, several phylogenetic relationships within Tenthredinoidea require clarification. Vilhelmsen (Reference Vilhelmsen2006) suggested that to resolve these relationships, a large sample of Tenthredinidae, in particular, would be needed because Tenthredinidae is the most diversified family in Tenthredinoidea. Of the six subfamilies in Tenthredinidae, these previous phylogenetic analyses mainly used the three most species rich (Tenthredininae, Allantinae, and Nematinae). Although Selandriinae are relatively species rich, few species belonging to this subfamily were included. As a result of this omission, these phylogenies may not have been reconstructed correctly. Recently, two more relevant molecular phylogenetic studies have appeared. Malm and Nyman (Reference Malm and Nyman2014) present a new, extremely interesting phylogeny of Symphyta with emphasis on Tenthredinoidea using ~6.8 kilobases (kb) of molecular data obtained 164 Symphyta specimens. Boevé et al. (Reference Boevé, Blank, Meijer and Nyman2013) examined phylogenetic correlations among ecological and defensive traits in Tenthredinoidea, and suggested that the evolution and radiation of several tenthredinid subgroups have been driven by invertebrate rather than vertebrate predators. We expected that the findings of these studies will improve the reliability of our phylogenetic reconstruction and aid in our analysis of diversification of Tenthredinoidea.
The shift in diversification should be uncovered by analysing a combination of independent data sets (e.g., phylogenetic relationships among families and subfamilies and the number of species in each family or subfamily along with their divergence date and the divergence date of their host plant group). In this study, we obtained specimens from as many tenthredinoids species distributed in Japan as possible and reconstructed molecular phylogeny of Tenthredinoidea by using not only previously reported DNA sequences (e.g., Schulmeister et al. Reference Schulmeister, Wheeler and Carpenter2002; Schulmeister Reference Schulmeister2003b; Ronquist et al. Reference Ronquist, Klopfstein, Vilhelmsen, Schulmeister, Murray and Rasnitsyn2012) but also sequences from new specimens belonging to 14 genera (31 species). We used ~2 kb of the DNA sequence from five gene regions to reconstruct the molecular phylogeny. Then, based on the resulting our molecular phylogeny and focussing on the host plant group used by each lineage, we tested the hypothesis that diversification of Tenthredinoidea was related to their use of angiosperms as a host plant. Specifically, we tested the hypothesis by estimating divergence times, assessing ancestral host usage, and comparing species richness among sister taxa.
Materials and methods
Taxon sampling and DNA extraction
In total (i.e., including both new and old samples), we analysed 56 species and 40 genera belonging to six extant families of Tenthredinoidea, plus four species of Xyeloidea and Pamphilioidea as outgroups. In addition to the Tenthredinoidea taxa used in previous phylogenetic reconstructions (Schulmeister et al. Reference Schulmeister, Wheeler and Carpenter2002; Schulmeister Reference Schulmeister2003b; Ronquist et al. Reference Ronquist, Klopfstein, Vilhelmsen, Schulmeister, Murray and Rasnitsyn2012), we included 31 new specimens recorded mainly in eastern Asia from 14 genera not used before: Trichiosoma Leach (Cimbicinae: Cimbicidae); Allantus Panzer and Empria Lepeletier and Serville (Allantinae: Tenthredinidae); Paracharactus MacGillivray (Blennocampinae: Tenthredinidae); Aneugmenus Hartig, Stromboceros Konow, Nipponorhynchus Takeuchi, Rocalia Takeuchi, and Thrinax Konow (Selandriinae: Tenthredinidae); and Lagidina Malaise, Macrophya Dahlbom, Pachyprotasis Hartig, Rhogogaster Konow, and Siobla Cameron (Tenthredininae: Tenthredinidae) and from seven genera included previously: Blasticotoma Klug (Blasticotomidae), Athalia Leach (Allantinae: Tenthredinidae), Nematinus Rohwer (Nematinae: Tenthredinidae), Dolerus Panzer and Strongylogaster Dahlbom (Selandriinae: Tenthredinidae), and Aglaostigma Kirby and Tenthredo Linnaeus (Tenthredininae: Tenthredinidae).
Of the 56 species, 31 were collected in the field and fixed and preserved in 99.5% ethanol until dissection. They were then identified by their morphological characteristics, and the target genes sequenced for them. For the remaining 25 species belonging to Tenthredinoidea, we used GenBank data. We also used the GenBank data of four species of superfamilies closely related Tenthredinoidea as outgroups (Xyeloidea and Pamphilioidea).
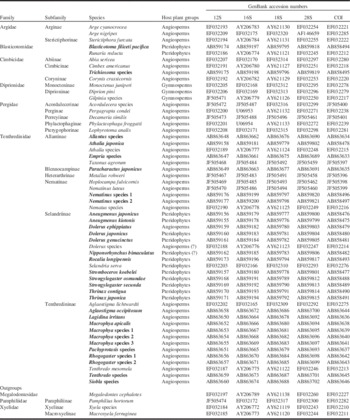
Total genomic DNA was extracted from the samples of ethanol-preserved insects using a salting-out protocol (Sunnucks and Hales Reference Sunnucks and Hales1996). We targeted five gene regions, ribosomal 12S, 16S, 18S, and 28S sequences, and the mitochondrial cytochrome oxidase I (COI), using ~2 kb of the DNA sequence. We amplified five gene regions by polymerase chain reaction (PCR) using primer sets and protocols described by Schulmeister et al. (Reference Schulmeister, Wheeler and Carpenter2002), Schulmeister (Reference Schulmeister2003b), and Nyman et al. (Reference Nyman, Farrell, Zinovjev and Vikberg2006). After amplification, the PCR products were purified using ExoSAP-IT (USB, Cleveland, Ohio, United States of America). Cycle sequencing reactions for both strands were performed using a BigDye Terminator v.3.1 Cycle Sequencing Kit (ABI; Applied Biosystems, Forster City, California, United States of America) on an Applied Biosystems 3130 Genetic Analyzer (ABI). The taxa analysed in this study are listed with their GenBank accession numbers in Table 2, and the PCR primer sets are listed in Table S1.
Taxa analysed in this study, with information on host plant groups and GenBank accession numbers.
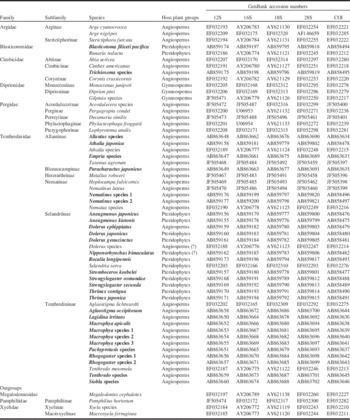
Note: New specimen not included in previous molecular phylogenetic study (Schulmeister et al. Reference Schulmeister, Wheeler and Carpenter2002; Schulmeister Reference Schulmeister2003b; Ronquist et al. Reference Ronquist, Klopfstein, Vilhelmsen, Schulmeister, Murray and Rasnitsyn2012) shown with bold character.
Molecular phylogeny
The partial DNA sequences were aligned with ClustalX (Larkin et al. Reference Larkin, Blackshields, Brown, Chenna, McGettigan and McWilliam2007) using default parameter settings, and ambiguously aligned regions were removed before further analysis. A total of 2356 sites from the 12S (426 sites), 16S (243 sites), 18S (748 sites), 28S (538 sites), and COI (401 sites) sequences were used for the phylogenetic analysis. Bayesian molecular phylogenies were reconstructed with MrBayes v.3.1.7 (Ronquist and Huelsenbeck Reference Ronquist and Huelsenbeck2003) using a substitution model for each ribosomal gene and each codon position belonging to COI calculated by Kakusan4 (Tanabe Reference Tanabe2007). Information on the sequences used to reconstruct the molecular phylogeny is given in Table S2.
In MrBayes, the molecular phylogeny was reconstructed with default priors, and each of the seven partitions (12S, 16S, 18S, 28S, and COI first, second, and third position) was allowed to have its own unlinked substitution model (Table S2). Two parallel Markov Chain Monte Carlo (MCMC) runs having six incrementally heated chains were computed for five million generations, while sampling trees from the current cold chain every 100 generations. Log files of the runs were inspected in Tracer v.1.5 (Rambaut and Drummond Reference Rambaut and Drummond2009) to confirm reaching chain stationarity and adequate effective sample sizes (ESS; >200) for the estimated parameters. After ESS were identified, the first 12 501 of the sampled trees were discarded as burn-in from both runs, and the last 75 000 trees were used to calculate 51 percentage Bayesian majority rule consensus tree.
Optimisation of host plant usage
The host plant use in tenthredinoid species was evaluated in relation to mainly three large plant groups, angiosperms, gymnosperms, and pteridophytes. To optimise the host plant usage in Tenthredinoidea, ancestral associations were reconstructed with parsimony optimisation across the in-group part of the MrBayes phylogeny using Mesquite v.2.75 (Maddison and Maddison Reference Maddison and Maddison2011). Host plants (angiosperms, gymnosperms, or pteridophytes) for each species were selected according to the Electronic World Catalog of Symphyta (ECatSym) v.4.0 beta (Blank et al. Reference Blank, Groll, Liston, Prous and Taeger2012), but host plant groups of the unidentified species were given host characteristics inferred from the data on what host plants were used by other members of the genus listed in ECatSym v.4.0 beta (Blank et al. Reference Blank, Groll, Liston, Prous and Taeger2012), or they were described in general.
Divergence time estimation
Divergence times were estimated using BEAST v.1.8.0 (Drummond and Rambaut Reference Drummond and Rambaut2007) and the substitution model for an unpartitioned matrix (12S+16S+18S+28S+COI) calculated by Kakusan4 (Tanabe Reference Tanabe2007, Table S2). When seven partitions, a matrix similar to the reconstructed phylogeny, or five partitions (12S, 16S, 18S, 28S, and COI) were used, there were too many parameters to perform the analysis on BEAST. An uncorrelated lognormal relaxed molecular clock model (Drummond et al. Reference Drummond, Ho, Philips and Rambaut2006) was implemented as a tree before using the Birth–Death process (Gernhard Reference Gernhard2008). This analysis provided two credible internal node points for calibration with fossil records (Ronquist et al. Reference Ronquist, Klopfstein, Vilhelmsen, Schulmeister, Murray and Rasnitsyn2012) with lognormal priors: Pamphilioidea (161 million years ago (Ma); Rasnitsyn and Zhang Reference Rasnitsyn and Zhang2004) with applied Log(Mean)=4.3, Log(SD)=0.5, and offset=161 and Tenthredinoidea excluding Blasticotomidae (140 Ma; Zhang Reference Zhang1985) with applied Log(Mean)=4.1, Log(SD)=0.5, and offset=140. In addition, Xyelidae, all specimen excluding Xyelidae, Pamphilioidea (Megalodontesidae and Pamphiliidae), Tenthredinoidea excluding Blasticotomidae, Argidae+Pergidae, Cimbicidae+Diprionidae, Athaliini (Athalia), Tenthredinidae* (Tenthredinidae excluding Athaliini), and Selandriinae were constrained as monophyletic based on the MrBayes phylogeny (see Results, Fig. 1), because an unconstrained analysis of an unpartitioned matrix would lead to a different phylogeny than the one using the seven partitions matrix (see Fig. S1). Two independent MCMC runs were performed for 50 million generations while sampling trees and parameter estimates once every 1000 generations. Log files of the runs were inspected in Tracer v.1.5 (Rambaut and Drummond Reference Rambaut and Drummond2009) to confirm that chain stationarity was reached and that the ESS was adequate (>200) for each estimated parameter. The tree files were then combined using LogCombiner v.1.8.0 (part of the BEAST package), with the burn-in set to 12 501 trees and resampling trees every 10 000 generations. The remaining 7500 trees were thereafter used to generate maximum clade credibility trees with mean node heights using TreeAnnotator v.1.8.0 (part of the BEAST package).
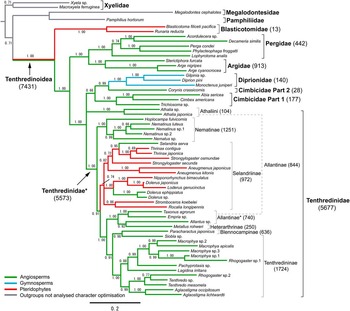
The reconstructed molecular phylogeny calculated a 51 percentages Bayesian majority rule. Numbers above or below the branches are posterior probabilities. Each number in parentheses on the taxon name indicates the number of species. Branch colours show host plant groups (angiosperms, gymnosperms, or pteridophytes inferred from character optimisation analysis).

Diversification analyses
Based on simple null models of cladogenesis, the comparison of species richness in the sister taxon analysis (Mayhew Reference Mayhew2002) was performed using BEAST phylogeny. If two sister taxa radiated at equal (but not necessarily constant) rates through time (Nee et al. Reference Nee, May and Harvey1994), the all possible partitions of N species into two clades were equally probable (Farris Reference Farris1976). The (two-tailed) probability of an equal or greater magnitude of split under the null model is given by the following formula: 2[N small/(N small+N large−1)]. Caution is advised before attributing a significant result to the shift in diversification at that node; a shift occurring only among derived taxa will automatically raise the species richness of higher clades to which they belong. It is therefore essential to examine the components of species-rich taxa to determine if the most primitive members of the group are also species-rich. If not, it is probable that the actual shift occurred at some more derived node (Sanderson and Donaghue Reference Sanderson and Donaghue1994). This analysis was performed by observing if any further significant results occur within the most species-rich taxon and, if so, the test was repeated excluding those taxa. In addition, the diversification rate was estimated from the clade’s current age (t) and current species richness (n; Mayhew Reference Mayhew2002).
For this analysis, the number of species in each tenthredinoid family or subfamily was taken from the ECatSym v.3.10 (Taeger and Blank Reference Taeger and Blank2011). Then, because the molecular phylogenetic analysis showed that most of the lineages were monophyletic (see Results, Fig. 2), we were able to use the number of species directly from those data. Nonetheless, five lineages (Cimbicidae Part1 and Part 2, Athaliini, Tenthredinidae*, and Allantinae*; see Table 1) resulted in a complex number of species as follows. Cimbicidae Part 1 (177 species); this lineage consists of Cimbicidae (205 species) but excludes Coryninae. Cimbicidae Part 2 (28 species); this lineage consists of Coryninae (28 species) contributed by Corynis Thunberg. Athaliini (104 species); this lineage consists of all species of Hennedyia Cameron, Hennedyella Forsius, Hypsathalia Benson, and Athalia. These species were included in Athaliini by Benson (Reference Benson1963). Tenthredinidae* (5573 species); this lineage consists of Tenthredinidae (5677 species) excluding Athaliini (104 species). Allantinae* (740 species); this lineage consists of Allantinae (844 species) excluding Athaliini (104 species).
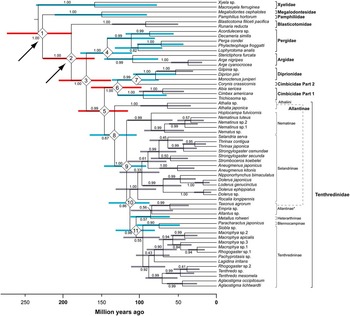
Relaxed molecular clock phylogeny of Tenthredinoidea and representative outgroup taxa of Megalodontesidae, Pamphiliidae, and Xyelidae. Numbers above or below the branches are posterior probabilities. The divergence time of each crown group above the subfamily level in Tenthredinoidea is based on the 95% higher posterior density intervals of the node ages. Red bars represent node ages of groups above family level, blue bars represent node ages of families and nodes below family level, and grey bars represent node ages at the other levels. The numbers enclosed in rhombuses at the nodes correspond to the node numbers in Table 3. Arrows indicate points of calibration against fossil records.

Results
Molecular phylogeny
The molecular phylogeny reconstructed using MrBayes (Fig. 1) supports the monophyletic status of Tenthredinoidea and of four of the six families in Tenthredinoidea (Argidae, Blasticotomidae, Diprionidae, and Pergidae) with high posterior probabilities (PP=1.00). Cimbicidae was not supported as monophyletic because Corynis was found to be more closely related to the diprionids than to other genera in Cimbicidae (Trichiosoma, Cimbex Olivier, and Abia Leach). Tenthredinidae also was not supported as monophyletic because it was divided into Athaliini and Tenthredinidae*, and their basal node which consisted of them and the Cimbicidae+Diprionidae clade, was unresolved in the majority-rule consensus.
In the reconstructed phylogeny, three of the six subfamilies in Tenthredinidae (Nematinae, Tenthredininae, and Selandriinae) analysed in this study were monophyletic. Allantinae, however, was non-monophyletic because Athalia was found not to be closely related to the other Allantinae genera (Allantus, Empria, and Taxonus). No conclusions could be made about the monophyly of Blennocampinae or Heterarthrinae because they were each represented by only one species.
Optimisation of host plant usage in Tenthredinoidea
Host plant usage and ancestral states inferred by the parsimony method in Tenthredinoidea analysed in this study are shown with coloured branches in Fig. 1 (and Fig. S2). The results show that the host used at the origin of Tenthredinoidea was angiosperms or pteridophytes. Nonetheless, two major shifts in host usage were observed at the branching of Diprionidae or Selandriinae. These results suggested that Tenthredinoidea used angiosperms or pteridophytes ancestrally; however, when Blasticotomidae originated, the ancestral Tenthredinoidea excluding Blasticotomidae would change the main host to angiosperms. Thus, angiosperm usage would be the basal plan in Tenthredinoidea excluding Blasticotomidae. Therefore, when Diprionidae or Selandriinae originated, they changed the host to gymnosperms or pteridophytes from angiosperms, respectively.
Divergence time estimation
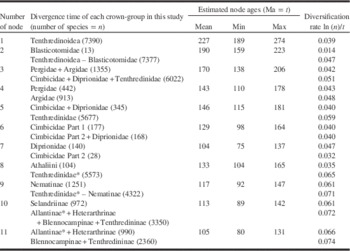
To estimate divergence time, we first confirmed that the molecular phylogeny reconstructed with BEAST using the no partitions strategy (Fig. 2) was generally congruent with that reconstructed by the MrBayes phylogeny using seven partitions (Fig. 1). The difference was that in the BEAST phylogeny, Tenthredinidae was monophyletic, albeit with low support (PP=0.67). The BEAST analysis estimated the split between Blasticotimidae and the rest of the superfamily at 190 Ma (95% high posterior density (HPD), 159–223), Argidae and Pergidae 143 Ma (95% HPD, 110–178), Diprionidae 104 Ma (95% HPD: 75–137), Cimbicidae Part 1 129 Ma (95% HPD: 98–164), and Tenthredinidae 146 Ma (95% HPD: 115–181; Table 3 and Fig. 2). Thus, the mean estimated time of origin of families in Tenthredinidae ranged from 190 to 104 Ma, meaning the early Jurassic to the early Cretaceous period. In addition, Athaliini and Tenthredinidae* originated at 133 Ma (95% HPD, 104–165).
Estimated node ages and 95% highest posterior density intervals for the divergence time of each crown-group in this study and the diversification rate.
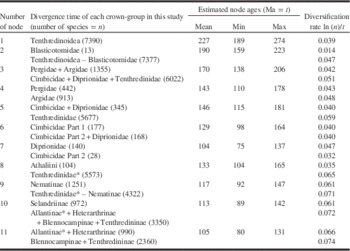
Note: Each number of node corresponds to it in Fig. 2.
Diversification analysis
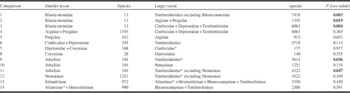
Results of sister taxon comparison based on the BEAST phylogeny are shown in Table 4. In five tests, significant differences were found, and in the others, no significant difference was observed.
Sister taxon comparisons between tenthredinoid lineages and associated probabilities under the null model of equal (but not necessarily constant) rate of speciation and extinction in the two lineages (smaller and larger taxon).

Note: P-value with bold character indicates significant shift in diversification.
There was no evidence that the origin of Cimbicidae+Diprionidae and Tenthredinidae represents a shift in diversification. Neither the sister taxon comparison nor the estimation of the divergence rate yielded unexpected results (Table 3, node 5; Table 4, comparison 6). The comparison between Pergidae+Argidae and Cimbicidae+Diprionidae+Tenthredinidae also did not yield significant differences (Table 3, node 3; Table 4, comparison 4). This result suggested that the high species richness of Tenthredinoidea excluding Blasticotomidae is a general property of that group and is not a feature of just a few derived clades (Table 3, node 2; Table 4, comparison 1); thus, the species richness of Tenthredinoidea excluding Blasticotomidae represents a shift in diversification. On the other hand, although this result indicates a relative shift in diversification, it cannot tell us whether we were dealing with a shift to a slower speciation rate (be species-poor) in Blasticotomidae or to a faster rate (be species-rich) in Tenthredinoidea excluding Blasticotomidae.
In the same way, one suggestion was applied to comparative analyses related to the split between Athaliini and Tenthredinidae* (Table 3, node 8; Table 4, comparison 9, 10, and 11). In particular, with respect to the split between Athaliini and Tenthredinidae*, if there were defined putative sister taxa Athaliini and Nematinae or Athaliini and Tenthredinidae* excluding Nematinae, the former set did not show significant results, but the latter one did (Table 4, comparison 10 and 11). These results suggested that the shift in diversification found among Tenthredinidae* was caused by a shift to a faster speciation rate among Tenthredinidae* excluding Nematinae.
Discussion
Molecular phylogeny
The molecular phylogenies reconstructed in this study using MrBayes (Fig. 1) and BEAST (Fig. 2) are supported fairly well by the morphology-based classification of Tenthredinoidea (Goulet and Huber Reference Goulet and Huber1993). Our data confirm some results (namely, that Tenthredinoidea, Argidae, Pergidae, and Argidae+Pergidae are monophyletic; Blasticotomidae is sister to the rest of Tenthredinoidea; and Diprionidae, Cimbicidae, and Tenthredinidae belong to the same lineage group) reported by other recent molecular phylogenetic studies (Schulmeister et al. Reference Schulmeister, Wheeler and Carpenter2002; Schulmeister Reference Schulmeister2003b; Heraty et al. Reference Heraty, Ronquist, Carpenter, Hawks, Schulmeister and Dowling2011; Ronquist et al. Reference Ronquist, Klopfstein, Vilhelmsen, Schulmeister, Murray and Rasnitsyn2012; Sharkey et al. Reference Sharkey, Carpenter, Vilhelmsen, Heraty, Liljeblad and Dowling2012; Malm and Nyman Reference Malm and Nyman2014). This observation indicated that the molecular phylogenies reconstructed in this study were reliable.
An important difference between phylogenies reconstructed using MrBayes and BEAST is the monophyletic status of Tenthredinidae. The MrBayes phylogeny indicates that Tenthredinidae is non-monophyletic (Fig. 1) whereas the BEAST phylogeny shows it as monophyletic (Fig. 2). This discrepancy is due to the unpartitioned matrix and constraint setting used in BEAST, because the MrBayes phylogeny that was reconstructed using an unpartitioned matrix without constraints, showed that Tenthredinidae was non-monophyletic (Fig. S2).
On the other hand, our BEAST phylogeny showed that Tenthredinidae is likely to be monophyletic (Fig. 2). Previous studies (Schulmeister et al. Reference Schulmeister, Wheeler and Carpenter2002; Schulmeister Reference Schulmeister2003b; Heraty et al. Reference Heraty, Ronquist, Carpenter, Hawks, Schulmeister and Dowling2011; Ronquist et al. Reference Ronquist, Klopfstein, Vilhelmsen, Schulmeister, Murray and Rasnitsyn2012; Sharkey et al. Reference Sharkey, Carpenter, Vilhelmsen, Heraty, Liljeblad and Dowling2012), however, reported that Tenthredinidae*, and accordingly, Tenthredinidae was non-monophyletic. In morphological phylogenetic studies (Vilhelmsen Reference Vilhelmsen2001; Schulmeister Reference Schulmeister2003a), Tenthredinidae is also considered non-monophyletic because morphological information on Athalia (Allantinae) is complex; Athalia has morphological characteristics that correspond to those found in Blasticotomidae. Benson (Reference Benson1963), however, in his description of Athaliini (comprising four genera, Athalia, Hennedyia, Hennedyella, and Hypsathalia), considered Athalia to be near the base of the Tenthredinidae stem because it shows some primitive features. Thus, although our results differ from those of previous work – in that we found Tenthredinidae to be possibly monophyletic – they are consistent with the above comment by Benson (Reference Benson1963) because our phylogeny has Athalia in a basal position in the Tenthredinidae topology. This status of Athalia is also supported by Malm and Nyman (Reference Malm and Nyman2014). The inclusion of additional rarely analysed species, such as additional Selandriinae species, in future molecular phylogenetic studies may help to resolve this discrepancy.
At the family level, our results for Cimbicidae were not congruent with the morphological classification because we found Corynis to be closer to the diprionid genera than to other genera in Cimbicidae (Trichiosoma, Cimbex, and Abia; Fig. 1). This result shows that Cimbicidae may be related to Diprionidae. The nature of the relationships among Cimbicidae, Diprionidae, and Tenthredinidae is controversial (Schulmeister et al. Reference Schulmeister, Wheeler and Carpenter2002; Schulmeister Reference Schulmeister2003b; Heraty et al. Reference Heraty, Ronquist, Carpenter, Hawks, Schulmeister and Dowling2011; Ronquist et al. Reference Ronquist, Klopfstein, Vilhelmsen, Schulmeister, Murray and Rasnitsyn2012; Sharkey et al. Reference Sharkey, Carpenter, Vilhelmsen, Heraty, Liljeblad and Dowling2012). In particular, Schulmeister (Reference Schulmeister2003b) suggested that the topological relationships among these three families are not stable because the difference in the number of steps between the Tenthredinidae*+Diprionidae clade and the Cimbicidae+Diprionidae clade was only one in the most parsimonious reconstruction of the molecular phylogeny. Malm and Nyman (Reference Malm and Nyman2014) have proposed a resolution for these problems. In their study, these three families and clade comprised of Cimbicidae and Diprionidae are monophyletic. The results of our phylogenetic analyses are mostly consistent with this proposal. Therefore, the findings of Malm and Nyman (Reference Malm and Nyman2014) indicate that the results we obtained by our analysis of DNA sequences available to us are generally reliable.
Diversification of Tenthredinoidea
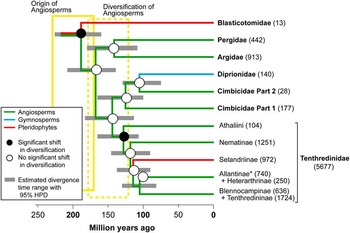
The summarised result of this study is shown in Figure 3. It suggests that Tenthredinoidea have used angiosperms since their origin, two nodes showed a shift in diversification on the BEAST phylogeny of Tenthredinoidea and an overlap with the periods of origin and diversification of angiosperms. Therefore, diversification of Tenthredinoidea seems to have been related to the origin and diversification of angiosperms and by adaptation to them.
Summarised results of this study. Phylogeny shows relationships within the Tenthredinoidea and tenthredinid subfamilies. Circles on the phylogeny indicate the mean values of estimated divergence time with a significant (black) or not a significant (white) shift in diversification. Grey bars show 95% highest posterior density intervals for a node age. Each number in parentheses on the taxon name indicates the number of species. The branch colour shows a host plant group (angiosperms, gymnosperms, or pteridophytes inferred from character optimisation analysis). Each yellow square indicates intervals for the origin and diversification of angiosperms.

The character optimisation analysis indicated that angiosperms probably have been used as a host from the origin of Tenthredinoidea excluding Blasticotomidae to the present. At the same time, in basal nodes of Diprionidae or Selandriinae we found a host shift from angiosperms to gymnosperms or pteridophytes, respectively. The result of the optimisation seems to be approximate but it is plausibly correct, although not all tenthredinoid species were included. Although most of the tenthredinoid species excluding gymnosperm or pteridophyte feeders (~6300 species) could have used angiosperms, some of them have no reliable host information. Their hosts are possibly angiosperms according to the host information of the species related to them in ECatSym v.4.0 beta (Blank et al. Reference Blank, Groll, Liston, Prous and Taeger2012). Even if all tenthredinoid species that use angiosperms, gymnosperms, or pteridophytes as a host could be included in this analysis, the species using angiosperms would be dominated and lead to the same result in the parsimony optimisation analysis.
We consider the estimated ages to be mainly reliable even though our divergence time estimation analysis was excluded derived lineage Unicalcarida (Cephoidea+Siricoidea+Xiphydrioidea+Vespina; Schulmeister et al. Reference Schulmeister, Wheeler and Carpenter2002). Since the estimated ages of some of the major tenthredinoid subclades (Table 3, node 2, 3, and 4) were in the range estimated based on the fossil record (Rasnitsyn Reference Rasnitsyn2010) and similar to those estimated by the most recent divergence time estimation for symphytan clades (Ronquist et al. Reference Ronquist, Klopfstein, Vilhelmsen, Schulmeister, Murray and Rasnitsyn2012), we believe that our results are relatively reliable even though our divergence time estimation analysis excluded the derived lineage Unicalcarida (Schulmeister et al. Reference Schulmeister, Wheeler and Carpenter2002).
The divergence time of the nodes Blasticotomidae–Tenthredinoidea excluding Blasticotomidae and Athaliini–Tenthredinoidea* (which shows a significant shift in diversification) was estimated at 190 Ma (95% HPD, 159–223) and 133 Ma (95% HPD, 104–165) respectively. The 95% HPD interval of the former overlaps with the periods of origin of angiosperms and the latter with the periods of diversification of angiosperms. Recent studies show widely varying estimates of the origin of the crown clade Angiospermae, ranging from the late Triassic (Bell et al. Reference Bell, Soltis and Soltis2010; Smith et al. Reference Smith, Beaulieu and Donoghue2010) to the early Jurassic period (Clarke et al. Reference Clarke, Warnock and Donoghue2011), with some signs that Bell et al. (Reference Bell, Soltis and Soltis2010) is converging on the range 229–170 Ma. In addition, estimates of the time of diversification of angiosperms converged on the range 179–120 Ma, according to a suggestion that crown angiosperms were in existence for some 50 Ma (or longer) before their radiation (Smith et al. Reference Smith, Beaulieu and Donoghue2010). We therefore inferred that the shift in the diversification of Tenthredinoidea was related to the origin and diversification of angiosperms. Alternatively, there is some evidence that angiosperms originated 145 Ma estimated with fossil records (Crane et al. Reference Crane, Friis and Pedersen1994; Friis et al. Reference Friss, Pedersen and Crane2006). If the origin of angiosperms had been later, then the diversification of Tenthredinoidea, especially of the most species-rich Tenthredinidae, would have occurred contemporaneously, coinciding with the evolutionary event of angiosperms.
The sister taxon comparison results showed a significant shift in diversification between Blasticotomidae and Tenthredinoidea excluding Blasticotomidae and between Athaliini and Tenthredinidae*. The first significant shift in the diversification was probably due to a shift to a slower speciation rate in Blasticotomidae. Though we suggested slower shift related to not using angiosperms (see above), Davis et al. (Reference Davis, Baldauf and Maythew2010) reported that the shift to a slower speciation rate in Blasticotomidae was caused by its stem minor strategy of their larvae, which is unique among Tenthredinoidea (Shcherbakov Reference Shcherbakov2006). The significant shift in diversification between Athaliini and Tenthredinoidea* (Table 4, comparison 9) was caused by a shift to a faster speciation rate in Tenthredinidae* excluding Nematinae (Table 4, comparison 10 and 11). These data indicate that the whole Tenthredinidae* has a stronger propensity for diversification, especially in later periods. We suggested that this shift to a faster speciation was related to diversification of angiosperms (see above), whereas Boevé et al. (Reference Boevé, Blank, Meijer and Nyman2013) suggested diversification of especially Nematinae, Selandriinae, and Tenthredininae had been related to predatation. We also performed sister taxon comparison based on the latest molecular phylogeny (Malm and Nyman Reference Malm and Nyman2014), and found shifts to faster speciation rates (Table S3 and 4). These results suggest that diversification of Tehthredinoidea was related to multiple, interrelated factors: not only origin and diversification of angiosperms but also predation pressure and ecological niches of tenthredinoids species.
The insect group that feeds on angiosperms is generally species-rich (Farrell Reference Farrell1998; Wiegmann et al. Reference Wiegmann, Regier and Mitter2002; Futuyma and Agrawal Reference Futuyma and Agrawal2009). In fact, in Tenthredinoidea, the number of species of angiosperm eaters was 85%, gymnosperm eaters 2%, and pteridophyte eaters (some Selandriinae feed on angiosperms) 13%. Futuyma and Agrawal (Reference Futuyma and Agrawal2009) pointed out that increasing host diversity might contribute to speciation by enabling geographic expansion and therefore increasing opportunities for spatial isolation and genetic divergence. It is known that angiosperms are the most species-rich plant group compared with gymnosperms or pteridophytes (angiosperms: 250 000–300 000 species, gymnosperms: ~1000 species, and pteridophytes ~10 000 species; Crane et al. Reference Crane, Friis and Pedersen1994; Schneider et al. Reference Schneider, Schuettpelz, Pryer, Cranfill, Magallón and Lupia2004; Christopher Reference Christopher2013). Therefore, it is plausible that species diversification in Tenthredinoidea may be related to the species richness or general abundance of angiosperms.
Leppänen et al. (Reference Leppänen, Altenhofer, Liston and Nyman2012) reported that the diversification of Heterarthrinae (Tenthredinidae) is related to their host plant groups, and some of them have diversified through a host shift, while others did so in tandem with the diversification of host plants (codiversification; Quek et al. Reference Quek, Davies, Itino and Pierce2004). In addition Isaka and Sato (Reference Isaka and Sato2014) suggested that the diversification of Selandriinae (Tenthredinidae) was also related to their host plant groups. Similarly, some tenthredinoid species may have diversified in lock step with their host plant group, mainly angiosperms.
Conclusion
Our phylogenetic analysis indicates that diversification in Tenthredinoidea may have been related to the origin and diversification of angiosperms. Because Tenthredinoidea excluding Blasticotomidae has used angiosperms since its origin, phylogeny of Tenthredinoidea has a significant shift in diversification at two nodes, and the 95% HPD interval of those nodes overlaps with the periods of origin and diversification of angiosperms. Molecular phylogeny in this study showed relationships among tenthredinoid families that are generally congruent with recent molecular phylogenetic studies (Schulmeister et al. Reference Schulmeister, Wheeler and Carpenter2002; Schulmeister Reference Schulmeister2003b; Heraty et al. Reference Heraty, Ronquist, Carpenter, Hawks, Schulmeister and Dowling2011; Ronquist et al. Reference Ronquist, Klopfstein, Vilhelmsen, Schulmeister, Murray and Rasnitsyn2012; Sharkey et al. Reference Sharkey, Carpenter, Vilhelmsen, Heraty, Liljeblad and Dowling2012; Malm and Nyman Reference Malm and Nyman2014). Phylogenetic analyses in this study assessed the diversification process in Tenthredinoidea by means of character optimisation, sister taxon comparison, and estimation of diversification time. In future, to elucidate diversification in Symphyta, phylogenetic analyses involving various taxon levels would be warranted.
Acknowledgements
The authors greatly appreciate valuable suggestions from and discussions with Tikahiko Naito (Kobe University), who also provided additional specimens. Kazuo Nakamura (Utsunomiya University) provided some of the rare specimens. They are grateful to Takao Itino, Koji Tojo, Shizuo Fujiyama, Shouhei Ueda, and Yurika Ujiié (Shinshu University), who gave invaluable advice on the data analysis. The authors also thank Yuki Kanamori (Hokkaido University) and Junko Isaka for their hands-on assistance with this study. The authors would like to thank Susan Duhon (Rujuke Editorial Service) and Enago (www.enago.jp) for the English language review.
Supplementary material
To view supplementary material for this article, please visit http://dx.doi.org/10.4039/tce.2014.60.