


Introduction
Fruit flies (Diptera: Tephritidae) are among the most economically important pests of edible fruits worldwide (White & Elson-Harry, Reference White and Elson-Harris1992) and also are considered to be pests of quarantine importance. Their control has been the focus of many fruit fly research programmes, especially in biological control through the use of parasitic Hymenoptera (Knipling, Reference Knipling1992; Waterhouse, Reference Waterhouse1993). Among the most commonly used fruit fly biological control agents are members of the Opiinae (Hymenoptera: Braconidae). The Opiines are koinobiont endoparasitoids of the egg or larval stages of Diptera and have been introduced and released as classical biological control agents of fruit flies in many regions (Wharton & Gilstrap, Reference Wharton and Gilstrap1983; Wharton, Reference Wharton, Robinson and Hooper1989; Waterhouse, Reference Waterhouse1993; Ovruski et al., Reference Ovruski, Aluja, Sivinski and Wharton2000) with substantial biological control success (Willard & Mason, Reference Willard and Mason1937; Clausen et al., Reference Clausen, Clancy and Chock1965). They have also been used in manipulative and inundative release programmes against fruit flies (Messing et al., Reference Messing, Klungness, Purcell and Wong1993; Purcell et al., Reference Purcell, Herr, Messing and Wong1998; Ramadan, Reference Ramadan2004). Some African fruit flies, such as the Medfly, Ceratitis capitata (Wiedemann) (Diptera: Tephritidae), Natal fruit fly, C. rosa Karsch, and the lesser pumpkin fly, Dacus ciliatus Loew (Diptera: Tephritidae), are known to have escaped from the continent and established elsewhere. As a result, Africa has been the destination of many exploratory programmes to find parasitoids that have co-evolved with these pests for classical biological control. These foreign explorations are still continuing (Wharton et al., Reference Wharton, Trostle, Messing, Copeland, Kimani-Njogu, Lux, Overholt, Mohamed and Sivinski2000), and Africa is probably experiencing its first foreign exploration for fruit fly parasitoids for use against the recently detected ‘African invader fly’, Bactrocera invadens Drew, Tsuruta and White (Diptera: Tephritidae) from Asia (Lux et al., Reference Lux, Copeland, White, Manrakhan and Billah2003; Drew et al., Reference Drew, Tsuruta and White2005).
Among the opiine parasitoids commonly reared from fruit-infesting flies are those from the genus Psyttalia Walker, which has several distinct groups identified within it (Fischer, Reference Fischer1972, Reference Fischer1987; Wharton, Reference Wharton1987, Reference Wharton1988, Reference Wharton1997a). Despite the importance of these parasitoids in applied entomology, one of the biggest problems is the difficulty associated with their proper identification and establishing their taxonomic identities (Wharton, Reference Wharton1987, Reference Wharton1997a; Kimani-Njogu et al., Reference Kimani-Njogu, Trostle, Wharton, Woolley and Raspi2001; Billah et al., Reference Billah, Kimani-Njogu, Overholt, Wharton, Wilson and Cobblah2005). Recent reviews of opiine parasitoids from various regions of the world (Chinajariyawong et al., Reference Chinajariyawong, Clark, Jirasurat, Kritsaneepiboon, Lahey, Vijaysegaran and Walter2000; Ovruski et al., Reference Ovruski, Aluja, Sivinski and Wharton2000; Carmichael et al., Reference Carmichael, Wharton and Clarke2005) and the trial of new potential candidates, such as Fopius ceratitivorus Wharton (Bokonon-Ganta et al., Reference Bokonon-Ganta, Ramadan, Wang and Messing2005) described from East Africa and previously unknown to science (Wharton, Reference Wharton1999; Wharton et al., Reference Wharton, Trostle, Messing, Copeland, Kimani-Njogu, Lux, Overholt, Mohamed and Sivinski2000; Kimani-Njogu & Wharton, Reference Kimani-Njogu and Wharton2002), indicate the resurging interest in biological control as an integral part of fruit fly control strategies. To maximize the use of these parasitoids, there is the critical need to understand their ecology and to ascertain their taxonomic identities.
Taxonomic history of the genus
The genus Psyttalia was originally described by Walker (Reference Walker1860) and then forgotten until Muesebeck (Reference Muesebeck1931) treated it as a synonym of Opius Wesmeal. Fischer (Reference Fischer1972) resurrected it as a subgenus of Opius, and Wharton (Reference Wharton1987) elevated it to generic rank. Psyttalia contains approximately 50 described species, which are all endemic to the Old World (Fischer, Reference Fischer1972, Reference Fischer1987; Wharton, Reference Wharton1987), with several distinct groups identified within the genus (Fischer, Reference Fischer1972, Reference Fischer1987; Wharton, Reference Wharton1987, Reference Wharton1988, Reference Wharton1997a). Of particular interest is a series of closely-related species from Africa – the P. concolor (Szépligeti) species complex – which are very difficult to distinguish (Silvestri, Reference Silvestri1914; Wharton & Gilstrap, Reference Wharton and Gilstrap1983). This group includes (among others) P. concolor sensu stricto, which was described (in Opius) from olives in Tunisia (Machal, Reference Machal1910; Szépligeti, Reference Szépligeti1910), P. perproximus (Silvestri) and P. humilis (Silvestri), which were described three years later from fruits infested by tephritids in Benin and South Africa, respectively (Silvestri, Reference Silvestri1913). Historically, the two most important species are P. concolor and P. humilis, which have been used in the Mediterranean region for augmentative releases against the olive fly and to some extent against medfly (Greathead, Reference Greathead and Greathead1976). Psyttalia humilis was introduced to Hawaii in 1913 (together with other species) and was able to suppress medfly populations to an extent described as a substantial biological control success (Willard & Mason, Reference Willard and Mason1937; Clausen et al., Reference Clausen, Clancy and Chock1965). The two species are virtually identical and there have been problems distinguishing between them since the 1930s. They have frequently been treated as synonyms, and just as frequently as separate species. According to Kimani-Njogu et al. (Reference Kimani-Njogu, Trostle, Wharton, Woolley and Raspi2001), the matter is far from resolved. Having been described from the two ends of the continent (Tunisia and South Africa), there has been the temptation of referring to materials collected in Kenya or other areas in-between these two places in the historical literature as either P. concolor or P. humilis (Bianchi & Krauss, Reference Bianchi and Krauss1937; Clausen et al., Reference Clausen, Clancy and Chock1965). However, the true P. humilis has never been collected again from South Africa since the time of its original collection in 1913 by Silvestri. According to Wharton et al. (Reference Wharton, Trostle, Messing, Copeland, Kimani-Njogu, Lux, Overholt, Mohamed and Sivinski2000), Kenyan material should be referred to as P. concolor or as P. cf. concolor, unless it can sufficiently and conclusively be demonstrated as different species.
Distinguishing characters and character states
The genus Psyttalia belongs to the family Braconidae, subfamily Opiinae, tribe Opiini and subtribe Opiina. Features used in identifying this subfamily include the basal displacement of the radial cross vein r in the fore wing, loss of the epicnemial carina and part of the occipital carina, and the tergal gland morphology. The arrangement of veins in the fore and hind wings is also used as one of the most important character systems in identification of the Braconidae because they are properly separated out (Wharton, Reference Wharton, Wharton, Marsh and Sharkey1997b). Psyttalia species are distinguished from other species by a combination of features, which include a relatively shorter second metasomal tergum than the third, presence of a short clypeus, which is widely separated from the mandibles, and a large hypopygium that is strongly attenuate or tapers, with the apex drawn out to a sharp point. Details of other distinguishing features can be found in Fischer (Reference Fischer1972, Reference Fischer1987), Wharton & Gilstrap (Reference Wharton and Gilstrap1983), Wharton (Reference Wharton1987, Reference Wharton1997a,Reference Wharton, Wharton, Marsh and Sharkeyb) and Wharton et al. (Reference Wharton, Yoder, Gillespie, Patton and Honeycutt2006). Extensive intra-specific variation has limited the use of characters other than the ovipositor length for distinguishing between species of the P. concolor group and, hence, the use of AFLP as an additional diagnostic tool in our study to tell the groups apart.
Two decades after the introduction of P. concolor to Italy to control the olive fly Bactrocera oleae (Gmelin), Monastero (Reference Monastero1931) described Psyttalia siculus from Sicily as a parasitoid of B. oleae. This generated considerable debate as to whether P. siculus was actually distinct from P. concolor (Monastero, Reference Monastero1934; Delucchi, Reference Delucchi1957). Fischer (Reference Fischer1958) compared several hundred specimens from across northern Africa, half of which were reared from the olive fly and half from the medfly. He compared the number of flagellomeres, venation, ovipositor length, shape of metasomal tergites and body colour but found no consistent differences. Fischer (Reference Fischer1958), therefore, placed P. humilis, P. perproximus and P. siculus as synonyms of P. concolor. Later, however, Fischer (Reference Fischer1963, Reference Fischer1971, Reference Fischer1972) treated P. siculus as a subspecies of P. concolor (with a slightly longer ovipositor) and retained P. humilis as distinct from P. concolor ‘because of differences in morphology of developmental stages’.
In the past, separation of closely-related species was by comparison of morphological variation, phenological data and host preferences. Recent developments in molecular technologies now provide additional techniques, which can be used in conjunction with the other tools to determine the relatedness of such species (Hillis, Reference Hillis1987; Unruh et al., Reference Unruh, White, Gonzalez and Woolley1989; Vos et al., Reference Vos, Hogers, Bleeker, Reijans, van de Lee, Hornes, Frijters, Pot, Peleman, Kuiper and Zabeau1995; Reineke et al., Reference Reineke, Karlovsky and Zebitz1999; Masiga et al., Reference Masiga, Tait and Turner2000), although in some cases finding discriminating molecular differences might not be straightforward (Alvarez & Hoy, Reference Alvarez and Hoy2002; Quicke, Reference Quicke2004; Will & Rubinoff, Reference Will and Rubinoff2004). To establish the true limits of species in Psyttalia, the use of multiple tools will be critical to the diagnoses of the group. For example, the recent transfer of Exodontiella and the Exodontiellini (formerly included in the subfamily Opiinae) to the subfamily Gnamptodontinae by Wharton et al. (Reference Wharton, Yoder, Gillespie, Patton and Honeycutt2006) was based on results of molecular analyses and detailed assessment of morphology. In this study, we compare five allopatric populations of fruit fly parasitoids from coffee fields in different localities and countries with two distinct and valid species (P. concolor and P. cosyrae) in order to establish their identities using morphological, molecular and ecological data and to assign populations of unknown identity to groups.
Materials and methods
Sources of biological materials
Psyttalia concolor (Szépligeti) was obtained from Pisa, Italy and maintained at the International Centre of Insect Physiology and Ecology (ICIPE) on Ceratitis capitata (Wiedemann) larvae in Nairobi, Kenya. Three Kenyan populations from coffee were collected from Ruiru, Central Province (01°5′72″S, 36°54′22″E; elevation 1609 m); Rurima, Central province (00°38′39″S, 37°29′69″E; elevation 1228 m); and Shimba Hills, Coast Province (04°15′64″S, 039°23′25″E; elevation 59 m), while one population each from coffee was collected from Nkolbisson, Cameroon (03°53′0″N, 11°27′0″E; elevation 700 m) and Tafo, Ghana (06°13′20″N, 00°21′29″W; elevation 220 m). Ruiru and Rurima are to the east of the Great Rift-Valley and among the principal coffee-growing areas in Kenya (Masaba et al., Reference Masaba, Owuor and Gathaara1986). The populations from these two locations are morphologically similar to P. concolor and were reared from Ceratitis MacLeay species, while those from Nkolbisson and Tafo (reared from Trirhithrum (Bezzi) species (Diptera: Tephritidae)) are identified as Psyttalia perproximus (Silvestri). The population from Shimba Hills (also reared from Trirhithrum species) was of unknown identity. Two non-coffee populations from Kenya: Muhaka, Coast Province (04°18′27″S, 039°29′98″E; elevation 74 m) and Burguret Forest, Central Province (00°06′720″S, 37°02′342″E; elevation 1961 m), identified as Psyttalia cosyrae (Wilkinson) and P. lounsburyi (Silvestri) were added to the morphometric and molecular comparisons, respectively. Psyttalia lounsburyi is the main species obtained from Bactrocera oleae (Gmelin) flies (Diptera: Tephritidae), the host from which P. concolor was originally described. This addition was to enable investigation into whether or not parasitoids from B. oleae are P. concolor species which have re-established association with their original host and changed in colour.
Slide preparation and measurement
The procedure followed the general processes of slide preparation of Billah et al. (Reference Billah, Kimani-Njogu, Overholt, Wharton, Wilson and Cobblah2005). Thirty specimens each (unless otherwise stated) from the five coffee populations, P. concolor and P. cosyrae were dissected using a Leica Wild M3Z Microscope and mounted in Canada balsam. Imaging of mounted specimens was done using video microscopy – Leica MZ APO dissecting Microscope fitted with a scanning camera ProgRes® 3008 (JENOPTIK Laser, Optik, Systeme, Germany) – and measurements were taken using Optimas® software programme. This software had the capability of measuring both straight line and curved measurements. Nineteen landmarks on the wing were selected to represent unambiguous homologous locations on all specimens (Bookstein et al., Reference Bookstein, Chernoff, Elder, Humphries, Smith and Strauss1985) and 25 distances between the landmarks computed to characterize the wing as estimations of the size and shape differentiation in the specimens (fig. 1). Ovipositor, ovipositor sheath and hind tibia lengths were measured (fig. 2), while the number of flagellomeres per antenna (excluding scape and pedicel) was counted as an additional characteristic to determine the status of the species (Fischer, Reference Fischer1963, Reference Fischer1972). Voucher specimens are maintained at ICIPE and the Zoology Department of the University of Ghana, Legon-Accra (Accession Nos: BSU/Pcn/02 (series 1–40), BSU/Pcs/02 (series 1–30), BSU/Pru/02 (series 1–30), BSU/Prm/02 (series 1–30), BSU/Psh/02 (series 1–30), BSU/Pgh/02 (series 1–5); BSU/Ppx/02 (series 1–10) and BSU/Plo/02 (series 1–20)).
Right forewing of Psyttalia concolor (Szépligeti) showing landmarks (1–19) used in morphometric analyses. Variables consisted of straight-line distances between points.

Points of reference for the measurement of body parts of Psyttalia species. (a), Ovipositor and sheath; (b), right hind leg showing measurement of the tibia.

DNA extraction, amplification and electrophoresis
Total DNA was extracted separately from ten males and ten females of each population using protocols of Sheppard et al. (Reference Sheppard, Steck and McPheron1992) and Han and McPheron (Reference Han and McPheron1997) for fresh/frozen or alcohol-preserved specimens. Extracted DNA was double-digested with restriction enzymes HindIII (Roche Diagnostics, Germany) and TaqI (MBI Fermentas, Lithuania) in a total reaction volume of 20 μl. After that, end-specific complementary adaptors (double-stranded oligonucleotides serving as recognition primer sites for subsequent amplification reactions) were ligated to the digested samples by the addition of 0.1 μl T4 Ligase (10 U μl−1), 6.0 μl T4 DNA ligase buffer (5X) and 1.0 μl HindIII adaptor (H-adaptor 1+H-adaptor 2) at 37°C for 4 h. Amplification of enzyme-restricted fragments in AFLP is accomplished in two steps: (a) pre-selective amplification, which in our case involved use of primers with single selective nucleotides at the 3′-end; and (b) selective amplification, which employed primers with two or three selective nucleotides. Polymerase Chain Reactions (PCR) were carried out in a Programmable Thermal Controller machine (PTC-100™, M.J. Research Inc., USA). Sequences of adaptors and primers used are listed in table 1.
Detailed sequences of adaptors, primers and their selective extension bases used in this study.

* H-CTA was fluorescent-labelled with a blue dye [FAM] at the 5’-end to facilitate fragment visualization.
Pre-selective amplification reaction was set to a thermal profile of 4°C for 2 min, followed by 35 cycles of 94°C for 30 s, 50°C for 30 s, 72°C for 1 min and a final holding temperature of 4°C. Samples were then diluted 1:20 in sterile double-distilled water (ddH2O) for use in selective amplification, which involved the use of three TaqI primer combinations (Taq-CA, Taq-CC and Taq-TT). Ten nanograms of fluorescent-labelled primer ([FAM] H-CTA, a blue dye obtained from MWG-Biotech, Germany) were added to 100 ng of each of the primers, resulting in combinations ([FAM] H-CTA+Taq-CA), ([FAM] H-CTA+Taq-CC) and ([FAM] H-CTA+Taq-TT). The PCR profile was 94°C for 2 min, followed by 94°C for 30 s, 66°C for 30 s, and 72°C for 1 min. The annealing temperature (66°C) was then decreased by 1.0°C in the next nine cycles, followed by another 20 cycles of 94°C for 30 s, 56°C for 30 s, 72°C for 2 min, 60°C for 30 min and a final holding temperature of 4°C. Both amplification reactions were performed in a total reaction volume of 20 μl with negative controls. PCR products were diluted 3-fold (i.e. 1:2) and 0.3 μl of the product added to 1.5 μl loading buffer (one part GeneScan 500 ROX size standard, three parts deionized formamide, one part loading dye, i.e. 1:3:1). Samples were heated to 95°C for 3 min in microAmp® PCR plates and quickly chilled on ice before loading. The total volume of each sample (1.8 μl) was loaded onto a 5% denaturing LongRanger® polyacrylamide gel with 1×TBE running buffer and electrophoresed using an ABI PRISM 377 Sequencing machine (Applied BioSystems) at 55W for 4 h.
Data analysis
Morphometric analyses were performed using the Statistical Analysis System software version 8.2 (SAS Institute Inc., 2001). Measurements of different body parts (wing, ovipositor and tibia) were analyzed separately to allow covariances between distances to interact in a more meaningful way (Woolley et al., Reference Woolley, Rose, Krauter and Rosen1994). Principal component analysis was performed on the variance-covariance matrix for the 25 wing variables (log10 transformed) to determine the effects of size and shape on the distribution of scores along the first two principal component axes (Sokal & Rohlf, Reference Sokal and Rohlf1995) and observe their distribution without constraints of prior assignment to particular populations. The data matrix was also subjected to canonical variate analysis to visualize shape differences and evaluate the value of the variables for discrimination among the populations. Ovipositor and ovipositor sheath lengths were divided by the hind tibia length (Sneath & Sokal, Reference Sneath and Sokal1973) and arcsine-root transformed before analyzing with a general linear model (PROC GLM; SAS Institute Inc., 2001). Where significant (P=0.05), means were separated using Student-Newman-Keuls (SNK) test (Kimani-Njogu et al., Reference Kimani-Njogu, Trostle, Wharton, Woolley and Raspi2001). Binary data (presence or absence of bands) from the AFLP were scored with a Genotyper 2.0 machine (Applied BioSystems) and analyzed using the population genetic analysis software (PopGen32, Release version 1.31, 1997). Nei's (Reference Nei1978) genetic distances (D) were calculated and cluster analysis performed following the unweighted pair group method with arithmetic averages (UPGMA) (Sneath & Sokal, Reference Sneath and Sokal1973) in MEGA (Version 3.1) (Kumar et al., Reference Kumar, Tamura and Nei2004).
Results
Principal components and canonical variates analyses
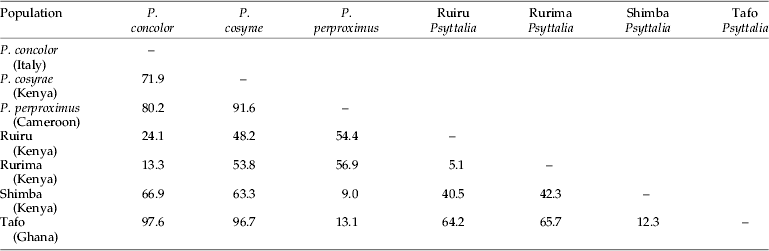
Projection of the specimens on the first two principal axes showed partial or fuzzy separation of the populations (fig. 3a). The first two components contributed to 87.8% of the total variance (PC 1=78.9% and PC 2=8.9%). The third, fourth and fifth components contributed 3.0%, 1.7% and 1.6%, respectively, which did not improve separation of the populations. However, projection of the points onto the first two canonical axes distinctly separated the populations into three clusters: (i) P. concolor-Ruiru-Rurima; (ii) P. perproximus-Tafo-Shimba Hills; and (iii) P. cosyrae alone (fig. 3b). The first two canonical variates contributed a total of 85.7% (CV 1=48.5% and CV 2=37.2%) to the total variance, with the third, fourth and fifth variates contributing 10.5%, 1.8% and 1.2%, respectively (table 2). Table 3 shows the raw, standardized and total canonical structure coefficients for the canonical variate analysis of the populations. The product of the pooled within-class standard deviation and the canonical vector coefficient for each variable is indicated as the standardized canonical coefficient (Heraty & Woolley, Reference Heraty and Woolley1993) (table 3) and represents the amount of change in the canonical variate source for every change in the original variable by one standard deviation (Neff & Marcus, Reference Neff and Marcus1980). Total-sample correlations between the original variables and the canonical structure scores are represented by the total canonical structure values (Umphrey, Reference Umphrey1996). The largest Mahalanobis squared distance (D2=97.6) is between P. concolor and the Tafo population, followed by P. concolor–P. perproximus (80.2), P. concolor–P. cosyrae (71.9) and P. concolor–Shimba Hills (66.9) (table 4), indicating the extent of variation between the populations. The Shimba population (of unknown identity) showed distances of 9.0 and 12.3 from P. perproximus and the Tafo population, respectively. The smallest distance (5.1) was between Rurima and Ruiru, which are also the closest to P. concolor (with distances 13.3 and 24.1, respectively). In all cases (linear and ratio calculations), P. cosyrae was found to be significantly different from all others (table 5). When the five coffee populations were compared alone (table 6), the relationship was clearer. Ovipositor and sheath lengths could not completely separate the populations, but tibia lengths showed significant difference between the two highland populations from Ceratitis species (Ruiru and Rurima) and the three lowland populations from Trirhithrum species (Shimba, Tafo and P. perproximus) (F=16.82; df=4, 89; P<0.0001). Ovipositor sheath-to-tibia ratio (STR) also showed significant difference between the two groups (F=21.68; df=4, 89; P<0.0001) compared with the ovipositor-to-tibia ratio (OTR), which separated only two of the lowland populations (Tafo and P. perproximus) from the highland ones. The third lowland population (Shimba) was not different from Rurima, but was significantly different from the Tafo, P. perproximus and Ruiru populations. Antennal flagellomere count separated the populations into two broad categories: (i) P. concolor, Rurima, Ruiru, Shimba Hills, P. perproximus and the Tafo population (forming the P. concolor-group); and (ii) P. cosyrae alone separated as a group. The number of flagellomeres in the P. concolor-group had a maximum of 39 (⩽39), while those in the P. cosyrae-group had 40 or more flagellomeres (≥40). The total number of flagellomeres for all the populations ranged from 26–50 (table 7).
Projection of wing data of the five Psyttalia populations from coffee (P. perproximus (Cameroon), Ruiru, Rurima, Shimba Hills (Kenya) and Tafo (Ghana)) compared with P. concolor and P. cosyrae. (a) First two principal components showing a fuzzy separation of the populations. (●, P. concolor;  , P. cosyrae; ▲, Rurima Psyttalia; △, Ruiru Psyttalia; ■, Shimba Psyttalia;
 , Tafo Psyttalia; ○, P. perproximus.) (b) First two canonical variates showing separation of the populations into three clusters. (●, P. concolor; , P. cosyrae; ▲, Rurima Psyttalia; △, Ruiru Psyttalia; ■, Shimba Psyttalia; , Tafo Psyttalia; ○, P. perproximus.)

Eigenvalues and weights of the first two principal components, computed from log-transformed wing data of the five Psyttalia populations from coffee, compared with those of P. concolor and P. cosyrae. Note the small range (0.15–0.25) and magnitude (all positive) of the first principal component values.
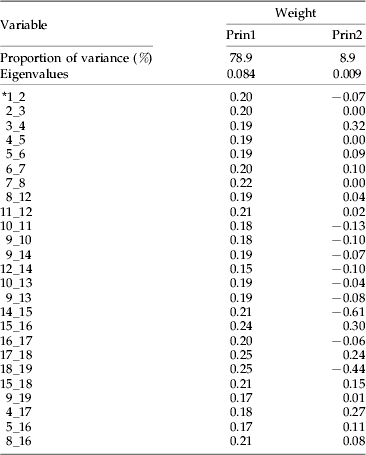
* 1_2, straight line distance between points 1 and 2.
Raw, standardized and total canonical structure coefficients for canonical variates analysis on log–transformed wing data for the five Psyttalia populations from coffee and those of P. concolor and P. cosyrae.

* 1_2, straight line distance between points 1 and 2.
Mahalanobis squared distances (D2) between clusters representing the five Psyttalia populations from coffee compared with those of P. concolor and P. cosyrae.
Mean linear measurements and ratio calculations of individuals of the five Psyttalia populations from coffee compared with those of P. concolor and P. cosyrae.

* Means in the same column followed by the same letters are not significantly different (P=0.05), using Student-Newman-Keuls (SNK) test. ANOVA performed on arcsine-transformed proportion values.
Mean linear measurements and ratio calculations of individuals of the five Psyttalia populations from coffee.

* Means in the same column followed by the same letters are not significantly different (P=0.05), using Student-Newman-Keuls (SNK) test. ANOVA performed on arcsine-transformed proportion values.
Comparison of flagellomere range values and tibia lengths in the Psyttalia populations.
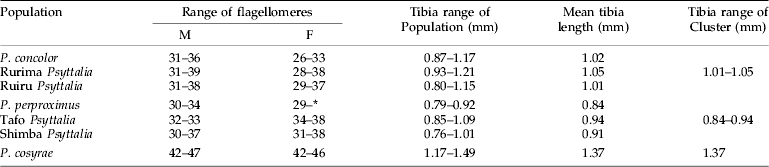
* Antennae with some lost segments.
AFLP
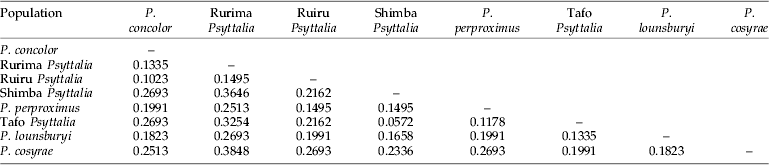
A total of 47 polymorphic markers were identified and scored. Using primers H-CTA+Taq-CA and H-CTA+Taq-TT, 16 polymorphic bands were detected, while H-CTA+Taq-CC revealed 15, showing comparable efficiency of the different primer combinations. Table 8 shows the genetic distances generated from a distance matrix based on the presence or absence of markers. The genetic distances (D) between P. concolor and the Ruiru and Rurima populations are 0.1023 and 0.1335, respectively (table 8), while the Shimba population (of unknown identity) has the smallest genetic distance (0.0572) between it and the Tafo population. In fig. 4, the populations were grouped into two: (1) P. concolor, Ruiru and Rurima; and (2) Shimba, Tafo and P. perproximus (together with P. lounsburyi and P. cosyrae). Psyttalia concolor and Ruiru are placed as the most closely related populations in the first group, with Rurima joining as a sister group to the two. In the second group, Shimba and Tafo are the most closely related populations, with P. perproximus serving as the sister group. Psyttalia lounsburyi and P. cosyrae, which were used as outgroups (non-coffee populations), were placed as such, with P. lounsburyi serving as outgroup to the second group and P. cosyrae as the first branch to the second group. Furthermore, grouping of the populations in fig. 4 (based on genetic distances) does match the clustering defined by the morphometric projections (fig. 3b). For all the populations together (table 8), Shimba and Tafo are placed as the closest to each other, followed by P. concolor-Ruiru, Tafo-P. perproximus and P. concolor-Rurima. P. concolor, Ruiru and Rurima are considered as belonging to the same species-group.
Phenogram of Nei's (Reference Nei1978) genetic distances between the eight Psyttalia populations used in the study (using UPGMA clustering from table 8). Two groups were formed: Group 1) P. concolor, Ruiru and Rurima; and Group 2) Shimba, Tafo and P. perproximus(together with P. lounsburyi and P. cosyrae). Psyttalia concolor and Ruiru are placed as the most closely related populations in the first group, with Rurima joining as a sister group to the two. In the second group, Shimba and Tafo are the most closely related populations, with P. perproximus serving as the sister group. Psyttalia lounsburyi and P. cosyrae, (non-coffee populations), which were used as outgroups, were placed as such, with P. lounsburyi serving as outgroup to the second group and P. cosyrae as the first branch to the second group.

Nei's (Reference Nei1978) unbiased measures of genetic distance between the eight Psyttalia populations generated from a distance matrix based on the presence or absence of markers.
Discussion
Principal components and canonical variates analyses
Large specimens tend to have larger dimensions (in the absence of allometry) and have a great deal of variance associated with overall size (Woolley et al., Reference Woolley, Rose, Krauter and Rosen1994). To minimize this effect, wing vein measurements were log10 transformed (Sokal & Rohlf, Reference Sokal and Rohlf1995) to equalize the standard deviations across differently-sized variables and ensure multivariate normality of the data (Woolley & Browning, Reference Woolley and Browning1987), while ovipositor and ovipositor sheath lengths were expressed as ratios (by dividing with hind tibia length) to represent a standard measure of size (Sneath & Sokal, Reference Sneath and Sokal1973). Separations along the first principal axes are usually associated with overall size, while those along the second principal axes are associated with shape. This is especially so when the weights of the variables for the first principal components are all positive and similar in magnitude (Jolicoeur & Mosimann, Reference Jolicoeur and Mosimann1960). Table 2 shows the weights of the first principal component as all positive and within the range 0.15–0.25, an indication of the role played by overall size in separation of the populations. Mixed magnitudes and large range values are situations where separations along the first and second principal axes are more than the simplistic association with overall size and shape (Bookstein et al., Reference Bookstein, Chernoff, Elder, Humphries, Smith and Strauss1985; Rohlf & Bookstein, Reference Rohlf and Bookstein1987, Reference Rohlf and Bookstein1990). The major contributing variables were vein segments 15_16, 17_18 and 18_19 (with the highest positive values of 0.24, 0.25 and 0.25, respectively) and segments 12_14, 9_19 and 5_16 (with the lowest positive values of 0.15, 0.17 and 0.17, respectively). Segments 15_16 and 17_18 (representing veins 2M and 3RSa) are the two lengths of the second submarginal cell, while 18_19 is the cross vein r, which joins the second submarginal cell to the stigma at the anterior end. Segment 12_14 (representing vein m-cu) is attached to a short inter-connecting vein (RS+M)b, which links it to the lower anterior part of the second submarginal cell. Segment 9_19 is the straight line distance from the point of attachment of the cross vein r on the stigma to the meeting point of veins1RS and 1 M, while 5–16 (representing vein 3M) is the distance from the lower apical point of the second submarginal cell to the tip of the forewing. This observation is explained by the fact that, as the cross vein r (18_19) becomes longer, it attaches further down onto the stigma and subsequently decreases the distance between it and landmark 9 (i.e. 9_19). The same effect is observed for segment 15_16 (vein 2M), which increases in length and results in the shortening of segment 5_16 (vein 3M).
The strong positive standardized coefficient scores for variables 12_14, 3_4, 10_13, 15_16 and 4_17 (1.13, 1.24, 1.59, 2.59 and 3.25, respectively) in the first canonical variate (table 3) indicate that these variables (vein segments) are longer in members of clusters 2 (P. perproximus-Tafo-Shimba Hills) and 3 (P. cosyrae) and play major roles in distinguishing them from members of cluster 1 (P. concolor-Ruiru-Rurima). For example, variable 10_13 measures the diagonal distance of the first discal cell, from landmark 10 to the point of curvature of the medio-cubital cross vein, m-cu (12_14). The increment in length indicates the extent of curvature of vein m-cu. A strong curvature of m-cu to the right (convex) means the vein bulges outwards and increases the diagonal distance of the discal cell. The strong negative scores for variables 5_16, 8_16, 1_2 and 9_14 (−1.62, −1.79, −2.03 and −2.37, respectively) indicate that members of cluster 1, especially individuals of P. concolor (which lie furthest in the negative range of the canonical variate plot in fig. 3b) have vein segments 9_14 [vein (RS+M)a], 1_2 [vein C+Sc+R], 8_16 and 5_16 [vein 3M], which play major roles in distinguishing them from others. These analyses show that most of the changes accounting for separation of the populations are centered on the second submarginal cell (landmarks 15, 16, 17 and 18) and the veins attached to it. This observation is consistent with and re-affirms the heavy dependence on use of the size and shape of the second submarginal cell as one of the most reliable practical taxonomic identification characters in the Opiinae (Wharton & Gilstrap, Reference Wharton and Gilstrap1983; Wharton, Reference Wharton1987, Reference Wharton1988, Reference Wharton1997a). Values of the Mahalanobis distances provide multivariate measure of the relative distance between groups, taking into account the variation within each one of them (Woolley et al., Reference Woolley, Rose, Krauter and Rosen1994). This provides supplementary supporting evidence to the defined clusters. The identity of an unknown population can be determined from comparison of the Mahalanobis distances between the centroids of the clusters and assigning it to the population with the smallest value (Marcus, Reference Marcus1990) (table 4).
Ovipositor and sheath lengths alone could not completely separate the populations, but they have been used in conjunction with other body measurements to separate Psyttalia species. For example, ovipositor sheath with thoracic length (Wharton & Gilstrap, Reference Wharton and Gilstrap1983) and ovipositor and/or ovipositor sheath with hind tibia (Kimani-Njogu et al., Reference Kimani-Njogu, Trostle, Wharton, Woolley and Raspi2001; Billah, Reference Billah2004; Billah et al., Reference Billah, Kimani-Njogu, Overholt, Wharton, Wilson and Cobblah2005). In a study of the ovipositor lengths in a guild of braconid parasitoids attacking Anastrepha Schiner fruit fly species (Diptera: Tephritidae) in southern Mexico, Sivinski et al. (Reference Sivinski, Vulinec and Aluja2001) advanced various hypotheses that might account for differences in ovipositor lengths. The most consistent explanation from their findings was that ‘ovipositor lengths have evolved to meet special, presently unspecified needs within niches that originally diverged on the basis of different phenomena that are unrelated to host accessibility and perhaps to factors such as temperature, humidity and/or host-fruit abundance and diversity’. It is, therefore, not surprising that the hind tibia is a better linear discriminant feature than the ovipositor and sheath lengths. When the ovipositor and sheath lengths are expressed as ratios to minimize the effect of size (Sneath & Sokal, Reference Sneath and Sokal1973), their discriminating powers become improved and can be used in addition to the hind tibia. While the OTR could not completely separate the lowland and highland populations, the STR completely separated the two population groups (table 6). This means the STR was a better discriminatory feature and can be used with, or in place of, the OTR. These structures are difficult to measure in dry specimens as a result of their partial withdrawal at death, but dissection of fresh or alcohol-preserved specimens gives wonderful results – the ovipositor sheath is distinctly coloured from the rest of the abdomen, offering no ambiguity about the length and minimizing chances of cutting it off at the wrong joint. It can also be straightened easily on a slide for mounting.
Genetic diagnosis
In the absence of sequence data providing polymorphic single locus markers, AFLP was chosen in order to access multiple loci across the entire genome. Forty-seven polymorphic markers were detected, demonstrating the utility of AFLP in revealing genetic diversity even among closely related organisms. Table 8 shows a distance matrix generated from markers scored for presence/absence using the three primer combinations (results not shown). Results of cluster analysis are shown in fig. 4, identifying distinct groups that are consistent with data generated by morphometry, showing complementation between genetic and morphometric data. Table 8 also corroborates findings from the morphological studies and allows placement of the Shimba population with those from Tafo (Ghana) and Nkolbisson (Cameroon). Placement of P. lounsburyi, as an outgroup to the second group, shows how different the two species are. Furthermore, both species have been reared from Bactrocera oleae collected from Olea europaea cuspidata (Oleaceae) in Kenya (Copeland et al., Reference Copeland, White, Okumu, Machera and Wharton2004) and, therefore, negates the suspicion that material collected from B. oleae might be colour forms of P. concolor. Use of molecular methods in conjunction with other tools have played key roles in determining relatedness or separating various insect species (Brown et al., Reference Brown, Pellmyr, Thompson and Harrison1994; Kimani-Njogu et al., Reference Kimani-Njogu, Overholt, Woolley and Omwega1998; Landry et al., Reference Landry, Powell and Sperling1999; Baker et al., Reference Baker, Loxdale and Edwards2003; Baer et al., Reference Baer, Tripp, Bjorksten and Antolin2004; Kazachkova et al., Reference Kazachkova, Fahleson and Meijer2004; Barari et al., Reference Barari, Ferguson, Piper, Smith, Quicke and Williams2005). Some of the methods used in general entomology are reviewed by Loxdale and Lushai (Reference Loxdale and Lushai1998) and Caterino et al. (Reference Caterino, Cho and Sperling2000), while Greenstone (Reference Greenstone2006) listed those for particular use in detecting and discriminating between parasitoid species.
Studies enabling direct phylogenetic comparison of these species are limited, and our AFLP work is probably the first attempt for African Psyttalia species. This comparison of populations suggests that it will be possible to identify and use a single locus marker that will help define the relationship between the groups. Taxonomic and molecular evidence in the parasitic hymenoptera have targeted five gene regions, the D2 expansion segment of the 28S ribosomal RNA gene (28S-D2), the Internal Transcribed Spacer regions 1 and 2 (ITS-1 and ITS-2) and the mitochondrial DNA cytochrome oxidase I and II (COI and COII), to help differentiate species (Campbell et al., Reference Campbell, Heraty, Rasplus, Chan, Stephan-Campbell, Babcock, Austin and Dowton2000; Gillespie et al., Reference Gillespie, Munro, Heraty, Yoder, Owen and Carmichael2005; Triapitsyn et al., Reference Triapitsyn, Vickerman, Heraty and Logarzo2006). Generally, the 28S ribosomal region is considered to sustain a slow rate of mutation and is more conserved than the ITS or cytochrome oxidase regions (Heraty, Reference Heraty, Ehler, Sforza and Mateille2004). Molecular characterization of wasps has also been done using microsatellites (Kankaare et al., Reference Kankare, Jensen, Kester and Saccheri2004), but there is a need for development of further (nuclear) markers that are informative at the deeper phylogenetic levels. Additionally, the monophyly of most genera is untested because most studies have tended to represent such genera by only a few species, and more comprehensive phylogenetic analysis will require the inclusion of additional nucleotide characters and more taxa.
Identity of the Shimba Hills population
The Shimba population was collected from an experimental plantation of lowland or robusta coffee, Coffea canephora (Rubiaceae) from the Coastal lowlands of Kenya. Coffea canephora is the main variety grown in West Africa (Oerke et al., Reference Oerke, Dehne, Schönbeck and Weber1994), and the most commonly reared tephritid flies from the berries are Trirhithrum species and a few Ceratitis anonae (Graham) (Steck et al., Reference Steck, Gilstrap, Wharton and Hart1986; Billah et al., Reference Billah, Kimani-Njogu, Overholt, Wharton, Wilson and Cobblah2005). Linear measurements of the Shimba population and P. perproximus showed no significant difference between them (table 6). Compared with the population from Tafo, the two differed only in the ovipositor sheath length while their hind tibia measurements showed no differences. The ratio values showed no difference between P. perproximus and Tafo, but the two differed from Shimba Hills in the OTR values (F=10.76; df=4, 89; P<0.0001) (table 6). These results indicate a situation in which P. perproximus (from Nkolbisson) seems to lie between the Tafo and Shimba populations. Populations from Cameroon and Ghana have on different occasions been identified as P. perproximus by Steck et al. (Reference Steck, Gilstrap, Wharton and Hart1986) and by one of us (R.A.W.). To date, the literature of fruit fly parasitoids shows no valid assertion of P. perproximus from Kenya. It was mentioned among collections of early explorers to Africa (Bianchi & Krauss, Reference Bianchi and Krauss1937), which were shipped to Hawaii for biological control purposes. However, in their review of the 42 species of opiine braconids previously collected in biological control programmes (up to the 1980s), Wharton & Gilstrap (Reference Wharton and Gilstrap1983) reported that some of the material introduced to Hawaii from East Africa under the names of P. perproximus and P. phaeostigma in Bianchi & Krauss (Reference Bianchi and Krauss1937) and Clausen et al. (Reference Clausen, Clancy and Chock1965) were actually P. cosyrae. Current records indicate 11 Psyttalia species names recognized in Africa, of which P. perproximus is not mentioned as having been collected in Kenya (Wharton, Reference Wharton1997a,Reference Wharton, Wharton, Marsh and Sharkeyb; Wharton et al., Reference Wharton, Trostle, Messing, Copeland, Kimani-Njogu, Lux, Overholt, Mohamed and Sivinski2000; Kimani-Njogu et al., Reference Kimani-Njogu, Trostle, Wharton, Woolley and Raspi2001; Billah et al., Reference Billah, Kimani-Njogu, Overholt, Wharton, Wilson and Cobblah2005), although there are a few new and potentially undescribed opiine species reared from various fruits (Wharton, Reference Wharton1999; Kimani-Njogu & Wharton, Reference Kimani-Njogu and Wharton2002; Copeland et al., Reference Copeland, White, Okumu, Machera and Wharton2004, Reference Copeland, Wharton, Luke, De Meyer, Lux, Zenz, Machera and Okumu2006). We believe that the Shimba population belongs to the P. perproximus group based on the consistent morphological similarities, morphometric analyses and ecological evidence. The use of multivariate analyses to describe taxonomic relationships within insect species groups have often been criticized (e.g. Wool & Hales, Reference Wool and Hales1997) that the environmental component of variation may be large and, as a result, morphological differences may not have genetic basis. Our results show that the relationship between the populations is corroborated by genetic evidence from AFLP data, and the Shimba population is suggested as the first true record of P. perproximus occurrence in Kenya and East Africa, which adds to the biodiversity inventory records and environmental conservation efforts in the region.
Acknowledgements
The following are acknowledged for their contributions and support: ICIPE and the African Fruit Fly Initiative (AFFI), A. Raspi (Pisa, Italy), R. Messing (Kauai, Hawaii), M. Yoder and S. Claycamp (Texas A&M University, College Station, Texas), D. Wilson and M. Cobblah (University of Ghana, Legon, Accra) and P. Nderitu (ICIPE). Our thanks also go to the anonymous reviewers, whose comments helped improve the flow of presentation. Funding was by the Dutch Government (DSO) through the African Regional Postgraduate Programme in Insect Science (ARPPIS) and in part by the International Foundation for Science (IFS), Sweden (Grant No. C3190/1 to M.K. Billah, University of Ghana, Legon-Accra/ICIPE).



