





1. Introduction
Flows across thin permeable structures are encountered in a wide range of engineering situations and nature, see, for example, the stable glide of dandelion seeds thanks to their hairy parachute called pappus (Cummins et al. Reference Cummins, Seale, Macente, Certini, Mastropaolo, Viola and Nakayama2018; Ledda et al. Reference Ledda, Siconolfi, Viola, Camarri and Gallaire2019) and the recirculating patterns inside deep-sea porous sponges, which are beneficial for organisms living within their structure (Falcucci et al. Reference Falcucci, Amati, Fanelli, Krastev, Polverino, Porfiri and Succi2021, Reference Falcucci, Amati, Bella, Facci, Krastev, Polverino, Succi and Porfiri2024). The filtration properties of these sponges are crucial in defining these patterns and consequently the transport of nutrients.
Related to this, fluidic systems are widely employed for separation and filtration processes (Catarino et al. Reference Catarino, Rodrigues, Pinho, Miranda, Minas and Lima2019). The flow is usually laminar but, in certain applications, advection may play an important role in the transport of solute (Tripathi et al. Reference Tripathi, Bala Varun Kumar, Prabhakar, Joshi and Agrawal2015). Advection effects are quantified through two non-dimensional numbers: the Reynolds number, the ratio between inertial and viscous scales for the fluid flow, and the Péclet number, the ratio between the advective and diffusive scales for the transport of solute in a solvent. In membrane filters for the collection of particles, the Reynolds number can reach values of up to  $20$ (Yang et al. Reference Yang, Yang, Tai and Ho1999). In hydrogen fuel cells, the Péclet number inside a proton-exchange membrane can be of the order of
 $10$ (Suresh & Jayanti Reference Suresh and Jayanti2016). Microfluidic mixing processes can be enhanced by adding microstructured patterns within the micro-channels (Stroock et al. Reference Stroock, Dertinger, Ajdari, Mezić, Stone and Whitesides2002). However, filtration processes do not only involve lab-scale systems. As a matter of fact, nets and harps are attracting interest in harvesting water from fog in arid environments (Park et al. Reference Park, Chhatre, Srinivasan, Cohen and McKinley2013; Labbé & Duprat Reference Labbé and Duprat2019; Moncuquet et al. Reference Moncuquet, Mitranescu, Marchand, Ramananarivo and Duprat2022).
Accurately modelling the transport phenomena across porous membranes in the presence of inertial effects thus affects a variety of applications ranging across several length and time scales. Numerical studies concerning the interaction between fluid flows and permeable structures belong to two approaches: full-scale solutions and averaged models. Direct full-scale solutions, such as that reported by Icardi et al. (Reference Icardi, Boccardo, Marchisio, Tosco and Sethi2014), although very accurate, require a non-trivial computational effort from the geometry and mesh generation to the actual numerical solution. This approach rapidly becomes prohibitive for flows at industrial scales or in the case of biological systems with extreme scale separation, e.g. cell membranes, where pores are nanometric and membranes are micrometric (Verkman & Mitra Reference Verkman and Mitra2000). In addition, full-scale solutions offer sometimes little insight into the general physics governing the processes and they are not scalable in the case of parametric studies or optimization routines. Conversely, simplified models are preferred in some contexts. Some authors have studied analytically the specific case of flow normal to the membrane (Conca Reference Conca1987; Bourgeat & Marusic-Paloka Reference Bourgeat and Marusic-Paloka1998), while others have developed theories for flow through infinitesimally thin porous membranes and deduced some range of applicability of Stokes’ approximation (Tio & Sadhal Reference Tio and Sadhal1994), or considered simplified pore geometries and arrangements (Jensen, André & Stone Reference Jensen, André and Stone2014a). A specific class of simplified flow descriptions consists of averaged models. Early models describe the fluid flow and solute transport across a bulk porous medium with a solvent flow description analogous to Darcy's law (Darcy Reference Darcy1856, see Dagan Reference Dagan1987 for a review). Despite being computationally less expensive, these models converge to the actual fluid flow field only in an average sense and rely on empirical coefficients, like the permeability, difficult to quantify from a theoretical point of view, and thus limit the model's predictive power. Multi-scale techniques such as the volume-averaged method (Whitaker Reference Whitaker1996) and homogenization (Hornung Reference Hornung1997) enable a more accurate and predictive description of such flows. In homogenization, the medium properties are the spatially averaged solution of closure problems at the pore-scale level. Zampogna & Gallaire (Reference Zampogna and Gallaire2020) proposed an homogenization-based formal approach to predict the permeability properties of thin porous membranes, including the transport of diluted species (Zampogna, Ledda & Gallaire Reference Zampogna, Ledda and Gallaire2022). Ledda et al. (Reference Ledda, Boujo, Camarri, Gallaire and Zampogna2021) showed that this methodology can be used not only for flow analysis, but also for membrane design and optimization. Homogenization thus provides a formal approach for studying and designing porous structures when the flow at the pore scale has negligible inertia. However, at the current state of the art, homogenization cannot handle pore-scale inertial flows since it requires the linearity of the governing pore-scale equations. To overcome this limitation, Zampogna et al. (Reference Zampogna, Pluvinage, Kourta and Bottaro2016) and Luminari, Airiau & Bottaro (Reference Luminari, Airiau and Bottaro2018) proposed an Oseen-like momentum equation to close the pore-scale problem in the case of flows through bulk porous media.
Actual applications in thin membrane flows can significantly benefit from extending beyond the inertia-less regime the modelling and optimization strategies associated with homogenization to better upscale transport and filtration phenomena occurring at the pore scale. In the present work, we generalize the framework proposed by Zampogna et al. (Reference Zampogna, Ledda and Gallaire2022) for inertial pore-scale flows. In § 2, we present the mathematical derivation of the homogenization procedure. Section 3 presents the solution to the problems we solve at the microscopic level to obtain the effective permeability and diffusivity coefficients, while in § 4, we use these solutions to predict the mean flow behaviour past permeable membranes. We compare our homogeneous model with simulations solved at all scales. In § 5, we improve the computational efficiency of our methodology by introducing a machine learning algorithm to minimize the number of microscopic problems to be solved. In § 6, we discuss our results and future perspectives.
2. Homogenized model and quasi-linear inertial flow extension
We consider the incompressible flow of a Newtonian fluid (so-called solvent) of density  $\rho$ and viscosity
 $\mu _0$ travelling across a thin microstructured porous membrane and transporting a diluted solute of diffusivity
 $D$. We introduce the solute concentration
 $\hat {c}$ and the solvent velocity and pressure fields
 $\hat {u}_i,\hat {p}$. Because of the presence of the diluted solute, the viscosity
 $\mu$ of the solvent–solute ensemble varies linearly with the concentration (Einstein Reference Einstein1906). However, actual variations of viscosity strongly depend on the considered couple solvent–solute. To remain within a general framework, we consider a constant viscosity of the ensemble (Geback & Heintz Reference Geback and Heintz2019; Royer Reference Royer2019), which, for example, can be its average value. The range of dilution in which this hypothesis holds clearly depends on the considered case (cf. for example, the experimental curves by Goldsack & Franchetto Reference Goldsack and Franchetto2011), but it allows us to focus on the effect of inertia at the pore scale. The fluid domain and porous structure are depicted in figure 1. Denoting as
 $\ell$ and
 $L$ the pore (micro-scale) and the membrane (macro-scale) length scales, respectively, we define the separation of scales parameter as
 $\epsilon =\ell /L$. The full-scale problem is governed by the Navier–Stokes equations for the solvent velocity and pressure, as well as by the advection–diffusion equation for the solute concentration,
 \begin{equation} \left.\begin{array}{c@{}}
\rho(\hat{\partial}_{\mathsf{t}}\hat{u}_i+\hat{u}_j\hat{\partial}_j
\hat{u}_i)={-}\hat{\partial}_i \hat{p}+\mu
\hat{\partial}_{ll}^2 \hat{u}_i,\\ \hat{\partial}_i
\hat{u}_i=0,\\
\hat{\partial}_{\mathsf{t}}\hat{c}={-}\hat{u}_i
\hat{\partial}_i \hat{c}+D\hat{\partial}^2_{ll} \hat{c},
\end{array}\right\}
\end{equation}
where the Einstein index notation is adopted. As shown in the following sections, homogenization relies on the following steps (figure 2): (i) define the inner equations and normalization, which apply at the pore scale; (ii) define the outer equations and normalizations, which apply far from the membrane; (iii) match the inner and outer domains; (iv) solve the inner (microscopic) problem; (v) average the inner solution and deduce the macroscopic condition.
Porous thin membrane. ( $a$) Membrane as it appears in the physical world. The fluid flow (blue streamlines) crosses the membrane via its pores and the concentration field (yellow contour) interacts with the membrane surface at the pore scale. (
 $b$) Purely macroscopic domain, where the membrane is substituted by its mean surface
 $\mathbb {C}$ and where the details of the pores have been coarse-grained:
 $\mathbb {C}$ is a fictitious surface, separating two domains, where equivalent boundary conditions are imposed to reproduce the average effect of the membrane on the fluid flow and concentration fields.

Diagram of the procedure used to deduce the macroscopic model. The green box highlights the novel iterative part of the procedure.

2.1. The inner problem
We refer to the domain  $\mathbb {F}$ in figure 1(a) as the microscopic domain, in opposition to the outer, macroscopic domain, formed by the fluid region far from the membrane (figure 1b). In the inner domain, we employ the following scaling:
 \begin{equation} \hat{p}=\Delta \mathcal{P} p=\frac{\mu \mathcal{U}}{\ell}p, \quad \hat{u}=\mathcal{U}u, \quad \hat{\mathsf{t}}=T\mathsf{t}=\frac{\ell}{\mathcal{U}}\mathsf{t}, \quad \hat{c}=Cc, \end{equation}
where  $\Delta \mathcal {P}, \mathcal {U}, T$ and
 $C$ are the scales of pressure difference, velocity, time and concentration at the pore level, respectively. The equations governing the physics within the microscopic elementary cell,
 $\mathbb {F}$, are
 \begin{equation} \left.\begin{array}{c@{}}
Re_{\ell}(\partial_{\mathsf{t}}u_i+ u_j\partial_j
u_i)={-}\partial_i p+ \partial_{ll}^2 u_i,\\ \partial_i
u_i=0,\\ Pe_{\ell}\partial_{\mathsf{t}} c={-}Pe_{\ell} u_i
\partial_i c+\partial^2_{ll} c, \end{array}\right\}
\end{equation}
where  $Pe_{\ell }=\mathcal {U}\ell /D$ and
 $Re_{\ell }=\mathcal {U}\ell /\nu$ are the Péclet and Reynolds numbers referring to the microscopic length
 $\ell$, respectively. The flow is assumed to be periodic along the tangential-to-the-membrane directions. No-slip (
 $u_i=0$) and chemostat-like (
 $c=0$) boundary conditions are imposed on the fluid–solid interface
 $\partial \mathbb {M}$. These Dirichlet boundary conditions are contained in the more general set of Robin boundary conditions presented by Zampogna et al. (Reference Zampogna, Ledda and Gallaire2022). The inner flow is assumed continuous with the outer flow, in terms of velocity, stress, concentration and solute flux at the upward
 $\mathbb {U}$ and downward
 $\mathbb {D}$ sides (cf. figure 1) of the microscopic domain.
2.2. The outer problem
In the macroscopic domain, we employ the following non-dimensionalization to scale the equations:
 \begin{equation} \hat{p}=\Delta \mathcal{P}^{\mathbb{O}} p^{\mathbb{O}}=\rho {\mathcal{U}^{\mathbb{O}}}^2 p^{\mathbb{O}}, \quad \hat{u}=\mathcal{U}^{\mathbb{O}} u^{\mathbb{O}}, \quad \hat{\mathsf{t}}=T^{\mathbb{O}} \mathsf{t}^{\mathbb{O}}=\frac{L}{\mathcal{U}^{\mathbb{O}}}\mathsf{t}^{\mathbb{O}}, \quad \hat{c}=C^{\mathbb{O}}c^{\mathbb{O}}. \end{equation}
The governing equations of the outer problem are
 \begin{equation} \left.\begin{array}{c@{}}
\partial_{\mathsf{t}}u_i^{\mathbb{O}}+u_j^{\mathbb{O}}\partial_j
u_i^{\mathbb{O}} ={-}\partial_i p^{\mathbb{O}}+
\dfrac{1}{Re_L}\partial_{ll}^2 u^{\mathbb{O}}_i,\\
\partial_i u^{\mathbb{O}}_i=0,\\ Pe_L\partial_{\mathsf{t}}
c^{\mathbb{O}}={-}Pe_L u_i^{\mathbb{O}} \partial_i
c^{\mathbb{O}}+\partial^2_{ll} c^{\mathbb{O}},
\end{array}\right\}
\end{equation}
where  $Pe_L=\mathcal {U}^{\mathbb {O}}L/D$ and
 $Re_L=\mathcal {U}^{\mathbb {O}}L/\nu$.
2.3. Matching the inner and outer domains
To observe inertial effects at the pore scale, we require at least  $Re_L\sim Pe_L\sim 1/\epsilon$ and
 $Re_{\ell }\sim Pe_{\ell }\sim 1$, and thus we assume
 $\mathcal {U}\sim \mathcal {U}^{\mathbb {O}}$. Consequently, the ratio of microscopic and macroscopic time scales reads
 \begin{equation} \frac{T}{T^{\mathbb{O}}}=\frac{\ell}{\mathcal{U}}\frac{\mathcal{U}^{\mathbb{O}}}{L}=\epsilon \frac{\mathcal{U}^{\mathbb{O}}}{\mathcal{U}}\sim \epsilon. \end{equation}
Equation (2.6) suggests that variations at the micro-scale occur in a much shorter time compared with the characteristic time variations at the macro-scale, and thus the pore-scale problem can be considered steady if no unsteadiness is triggered at the micro-scale,
 \begin{equation} \left.\begin{array}{c@{}}
Re_{\ell} u_j\partial_j u_i={-}\partial_i p+
\partial_{ll}^2 u_i,\\ \partial_i u_i=0,\\ -Pe_{\ell} u_i
\partial_i c+\partial^2_{ll} c=0.
\end{array}\right\}\end{equation}
On the upward  $\mathbb {U}$ and downward
 $\mathbb {D}$ sides of
 $\mathbb {F}$, the dimensional outer and inner fluid flow and concentration fields match, i.e.
 \begin{align} \hat{\varSigma}_{ij}n_j &= \hat{\varSigma}^{\mathbb{O}}_{ij}n_j \Rightarrow [-\hat{p}\delta_{ij}+\mu(\hat{\partial}_i \hat{u}_j+\hat{\partial}_j \hat{u}_i)]n_j = [-\hat{p}^{\mathbb{O}}\delta_{ij}+\mu(\hat{\partial}_i \hat{u}^{\mathbb{O}}_j+\hat{\partial}_j \hat{u}^{\mathbb{O}}_i)]n_j\nonumber\\ &\Rightarrow\left[-\frac{\mu \mathcal{U}}{\ell}p\delta_{ij}+\frac{\mu \mathcal{U}}{\ell}(\partial_i u_j+\partial_j u_i)\right]n_j = \left[-\rho {\mathcal{U}^{\mathbb{O}}}^2 p^{\mathbb{O}}\delta_{ij}+\frac{\mu \mathcal{U}^{\mathbb{O}}}{L}(\partial_i u_j^{\mathbb{O}}+\partial_j u_i^{\mathbb{O}})\right]n_j\nonumber\\ &\Rightarrow \varSigma_{ij}n_j=\epsilon \,Re_L \frac{\mathcal{U}^{\mathbb{O}}}{ \mathcal{U}}\varSigma_{ij}^{\mathbb{O}}n_j, \end{align}
 \begin{align} \hat{F}_i n_i&=\hat{F}_i^{\mathbb{O}} n_i\Rightarrow [ \hat{u}_i\hat{c}-D\hat{\partial}_i \hat{c} ]n_i=[ \hat{u}^{\mathbb{O}}_i\hat{c}^{\mathbb{O}}-D\hat{\partial}_i \hat{c}^{\mathbb{O}} ]n_i \nonumber\\ &\Rightarrow\left[ \mathcal{U}C u_i c-D\frac{C}{\ell}\partial_i c \right]n_i=\left[ \mathcal{U}^{\mathbb{O}}C^{\mathbb{O}} u_i^{\mathbb{O}} c^{\mathbb{O}}-D\frac{C^{\mathbb{O}}}{L}\partial_i c^{\mathbb{O}} \right]n_i\nonumber\\ &\Rightarrow F_in_i=\epsilon\frac{C^{\mathbb{O}}}{C}F_i^{\mathbb{O}}n_i, \end{align}
 \begin{align} u&=\frac{\mathcal{U}^{\mathbb{O}}}{\mathcal{U}}u^{\mathbb{O}}, \quad c=\frac{C^{\mathbb{O}}}{C}c^{\mathbb{O}}, \end{align}
where  $\varSigma _{jk}=-p\delta _{jk}+(\partial _j u_k+\partial _k u_j)$,
 $\varSigma _{jk}^{\mathbb {O}}=-p^{\mathbb {O}}\delta _{jk}+\frac {1}{Re_L}(\partial _j u^{\mathbb {O}}_k+\partial _k u^{\mathbb {O}}_j)$,
 $F_j=Pe_{\ell } u_i c - \partial _i c$ and
 $F_j^{\mathbb {O}}=Pe_L u_i^{\mathbb {O}} c^{\mathbb {O}} - \partial _i c^{\mathbb {O}}$ are the fluid stresses and solute fluxes in the inner and outer domains, respectively.
2.4. Solving the inner problem
To apply homogenization to the problem in (2.7), the Stokes approximation assumes  $Re_{\ell }\sim Pe_{\ell }\sim \epsilon$ (Zampogna et al. Reference Zampogna, Ledda and Gallaire2022). In this paper, we introduce finite Péclet and Reynolds numbers at the pore scale, i.e.
 $Re_{\ell }\sim 1$ and
 $Pe_{\ell }\sim 1$. Consequently, the problem in (2.7) is a set of nonlinear partial differential equations. Exploiting the separation of scales, we perform the following asymptotic expansion:
 \begin{equation} \left.\begin{array}{c@{}}
x_i=x_i+\epsilon X_i, \quad \partial_i =\partial_i+\epsilon
\partial_I, \\
(u_i,p,c)=(u_i^{(0)},p^{(0)},c^{(0)})+\epsilon
(u_i^{(1)},p^{(1)},c^{(1)})+\mathcal{O}(\epsilon^2).
\end{array}\right\}
\end{equation}
Substituting (2.9) into (2.7), we obtain the leading order equation,
 \begin{equation} \left.\begin{array}{c@{}}
Re_{\ell} u_j^{(0)}\partial_j u_i^{(0)}={-}\partial_i
p^{(0)}+ \partial_{ll}^2 u_i^{(0)},\\ \partial_i
u_i^{(0)}=0,\\ -Pe_{\ell} u_i^{(0)} \partial_i
c^{(0)}+\partial^2_{ll} c^{(0)}=0,\\
\varSigma_{ij}^{(0)}n_j=\varSigma_{ij}^{\mathbb{O}}n_j
\quad \text{on } \mathbb{U},\mathbb{D},\\ u_i^{(0)}=0 \quad
\text{on } \partial\mathbb{M},\\ u_i^{(0)},p^{(0)} \quad
\text{periodic along } \boldsymbol{t},\boldsymbol{s}.
\end{array}\right\}
\end{equation}
To write the solution of (2.10) as a linear combination of the boundary fluxes, we introduce the closure advective velocity  $U_j$ such that
 \begin{equation} \left.\begin{array}{c@{}}
Re_{\ell} U_j\partial_j u_i^{(0)}={-}\partial_i p^{(0)}+
\partial_{ll}^2 u_i^{(0)},\\ \partial_i u_i^{(0)}=0,\\
-Pe_{\ell} U_j \partial_j c^{(0)}+\partial^2_{ll}
c^{(0)}=0,\\
\varSigma_{ij}^{(0)}n_j=\varSigma_{ij}^{\mathbb{O}}n_j
\quad \text{on } \mathbb{U},\mathbb{D},\\ u_i^{(0)}=0 \quad
\text{on } \partial\mathbb{M},\\ u_i^{(0)},p^{(0)} \quad
\text{periodic along } \boldsymbol{t},\boldsymbol{s}.
\end{array}\right\}\end{equation}
The term  $U_j$ needs to be specified to close (2.11). However, we refer to § 2.6 for the closure of
 $U_j$. The solution of (2.11) can be formally written as a linear combination of the boundary fluxes,
 \begin{equation} \left.\begin{array}{c@{}}
u_i^{(0)}=\epsilon Re_L
\dfrac{\mathcal{U}^{\mathbb{O}}}{\mathcal{U}}(M_{ij}\varSigma_{jk}^{\mathbb{O,U}}n_k+N_{ij}\varSigma_{jk}^{\mathbb{O,D}}n_k),\\
p^{(0)}=\epsilon Re_L
\dfrac{\mathcal{U}^{\mathbb{O}}}{\mathcal{U}}(Q_{j}\varSigma_{jk}^{\mathbb{O,U}}n_k+R_{j}\varSigma_{jk}^{\mathbb{O,D}}n_k),\\
c^{(0)}=\epsilon \dfrac{C^{\mathcal{O}}}{C} (T
F_j^{\mathbb{O,U}}n_j+S F_j^{\mathbb{O,D}}n_j).
\end{array}\right\}\end{equation}
Substituting (2.12) into (2.11), we obtain the set of solvability conditions:
 \begin{gather} \left.\begin{array}{c@{}}
Re_{\ell} U_m \partial_m M_{ij}={-}\partial_i Q_{j}
+\partial^2_{ll}M_{ij} \quad \text{in } \mathbb{F},\\
\partial_i M_{ij}=0 \quad \text{in } \mathbb{F},\\
\varSigma_{pq}(M_{\cdot j},Q_{j})n_q=\delta_{jp}n_q \quad
\text{on } \mathbb{U},\\ \varSigma_{pq}(M_{\cdot
j},Q_{j})n_q=0 \quad \text{on } \mathbb{D},\\ M_{ij}=0
\quad \text{on } \partial \mathbb{M},\\ M_{ij},Q_{j} \quad
\text{periodic along } \boldsymbol{t},\boldsymbol{s},
\end{array}\right\}
\end{gather}
 \begin{gather} \left.\begin{array}{c@{}}
Re_{\ell} U_m \partial_m N_{ij}={-}\partial_i R_{j}
+\partial^2_{ll}N_{ij} \quad \text{in } \mathbb{F},\\
\partial_i N_{ij}=0 \quad \text{in } \mathbb{F},\\
\varSigma_{pq}(N_{\cdot j},R_{j})n_q=0 \quad \text{on }
\mathbb{U},\\ \varSigma_{pq}(N_{\cdot
j},R_{j})n_q=\delta_{jp}n_q \quad \text{on } \mathbb{D},\\
N_{ij}=0 \quad \text{on } \partial \mathbb{M},\\
N_{ij},R_{j} \quad \text{periodic along }
\boldsymbol{t},\boldsymbol{s}, \end{array}\right\}
\end{gather}
 \begin{gather} \left.\begin{array}{c@{}}
Pe_{\ell} U_j \partial_j T-\partial^2_{ll}T = 0 \quad
\text{in } \mathbb{F}, \\ (Pe_{\ell} U_j T-\partial_jT)n_j
= 1 \quad \text{on } \mathbb{U},\\ (Pe_{\ell} U_j
T-\partial_jT)n_j = 0 \quad \text{on } \mathbb{D},\\ T = 0
\quad \text{on } \partial\mathbb{M}, \\ T \quad
\text{periodic along } \boldsymbol{t},\boldsymbol{s},
\end{array}\right\}\quad \left.\begin{array}{c@{}} Pe_{\ell}
U_j \partial_j S-\partial^2_{ll} S = 0 \quad \text{in }
\mathbb{F},\\ (Pe_{\ell} U_j S-\partial_j S)n_j = 0 \quad
\text{on } \mathbb{U}, \\ (Pe_{\ell} U_j S-\partial_j S)n_j
= 1 \quad \text{on } \mathbb{D}, \\ S = 0 \quad \text{on }
\partial\mathbb{M}, \\ S \quad \text{periodic along }
\boldsymbol{t},\boldsymbol{s},
\end{array}\right\} \end{gather}
where  $\varSigma _{pq}(M_{\cdot j},Q_j)=-Q_j\delta _{pq}+(\partial _q M_{pj} + \partial _p M_{qj})$ and similarly for
 $N_{ij},R_j$. Since
 $\varSigma _{pq}$ contain the quantities
 $Q_j, R_j$, no additional boundary condition is needed for the closing of these equations. The first (second) problem in (2.13) represents the pore-level solvent transport in response to normal and tangential unitary stresses on the upward side
 $\mathbb {U}$ (downward side
 $\mathbb {D}$) of the membrane. Conversely, the third (fourth) problem represents the pore-level solute transport across the membrane caused by a unitary solute flux entering the upward side
 $\mathbb {U}$ (downward side
 $\mathbb {D}$) of the membrane. We notice that by integrating in
 $\mathbb {F}$ the last two problems in (2.13) and applying the divergence theorem, we obtain an integral balance of solute fluxes which states that the solute flux entering from the
 $\mathbb {U}$ or
 $\mathbb {D}$ side is removed from the domain at the boundary
 $\partial \mathbb {M}$ because of its boundary condition. The solvability conditions in (2.13) slightly differ from those introduced by Zampogna et al. (Reference Zampogna, Ledda and Gallaire2022) because of the presence of the advective term. In the case of flows on rough, impermeable surfaces, Bottaro (Reference Bottaro2019) and Lācis et al. (Reference Lācis, Sudhakar, Pasche and Bagheri2020) showed that the systems in (2.13) are equivalent to the following set of equations:
 $$\begin{gather} \left.\begin{array}{c@{}}
Re_{\ell} U_m \partial_m M_{ij}={-}\partial_i Q_{j}
+\partial^2_{ll}M_{ij} +\delta_{\mathbb{C}}\delta_{ij},\\
\partial_i M_{ij}=0,\\ \varSigma_{pq}(M_{\cdot
j},Q_{j})n_q=0 \quad \text{on } \mathbb{U}, \mathbb{D},\\
M_{ij}=0 \quad \text{on } \partial \mathbb{M},\\
M_{ij},Q_{j} \quad \text{periodic along }
\boldsymbol{t},\boldsymbol{s}, \end{array}\right\}
\end{gather}$$
 $$\begin{gather}\left.\begin{array}{c@{}}
Re_{\ell} U_m \partial_m N_{ij}={-}\partial_i R_{j}
+\partial^2_{ll}N_{ij}-\delta_{\mathbb{C}}\delta_{ij},\\
\partial_i N_{ij}=0,\\ \varSigma_{pq}(N_{\cdot
j},R_{j})n_q=0 \quad \text{on } \mathbb{U}, \mathbb{D},\\
N_{ij}=0 \quad \text{on } \partial \mathbb{M},\\
N_{ij},R_{j} \quad \text{periodic along }
\boldsymbol{t},\boldsymbol{s}, \end{array}\right\}
\end{gather}$$
 $$\begin{gather}\left.\begin{array}{c@{}}
Pe_{\ell} U_j \partial_j
T-\partial^2_{ll}T+\delta_{\mathbb{C}} = 0 \quad \text{in }
\mathbb{F}, \\ (Pe_{\ell} U_j T-\partial_jT)n_j = 0 \quad
\text{on } \mathbb{U}, \mathbb{D},\\ T = 0 \quad \text{on }
\partial\mathbb{M}, \\ T \quad \text{periodic along }
\boldsymbol{t},\boldsymbol{s}, \end{array}\right\}
\end{gather}$$
 $$\begin{gather}\left.\begin{array}{c@{}}
Pe_{\ell} U_j \partial_j S-\partial^2_{ll}
S-\delta_{\mathbb{C}} = 0 \quad \text{in } \mathbb{F},\\
(Pe_{\ell} U_j S-\partial_j S)n_j = 0 \quad \text{ on }
\mathbb{U}, \mathbb{D}, \\ S = 0 \quad \text{ on }
\partial\mathbb{M}, \\ S \quad \text{periodic along }
\boldsymbol{t},\boldsymbol{s}, \end{array}\right\}
\end{gather}$$
where  $\delta _{\mathbb {C}}$ is a Dirac impulse centred in
 $x_{\mathbb {C}}$. The physical significance of the problems in (2.13) and (2.14) is similar, but here the forcing is represented by a unitary volume source appearing in the momentum and advection–diffusion equations. The quantities
 $M_{ij},N_{ij},Q_i,R_i,T$ and
 $S$ depend parametrically on the closure advective velocity
 $U_j$. In the present paper, we adopt the formulation in (2.14) to compute the microscopic solution.
2.5. Averaging step and macroscopic condition
To upscale the microscopic solutions, we introduce the following averages at both the upstream and downstream sides of the membrane:
 \begin{equation} \bar{M}_{ij}=\frac{1}{|\mathbb{U}|}\int_{\mathbb{U}} M_{ij} \,{\rm d}\kern 0.06em x_t \,{\rm d}\kern 0.06em x_s, \quad \bar{N}_{ij}=\frac{1} {|\mathbb{D}|}\int_{\mathbb{D}} N_{ij} \,{\rm d}\kern 0.06em x_t \,{\rm d}\kern 0.06em x_s. \end{equation}
We clarify the physical significance of the  $\bar {M}_{ij}$ tensors in a two-dimensional domain:
 $\bar {M}_{nn}$ and
 $\bar {M}_{tn}$ represent the ability of the fluid to move along the positive normal and tangential directions as a consequence of a normal unitary forcing. Instead,
 $\bar {M}_{nt}$ and
 $\bar {M}_{tt}$ represent the ability of the fluid to move along the positive normal and tangential directions as a consequence of a tangential unitary forcing. The same applies for
 $\bar {N}_{ij}$, with negative normal and tangential directions. Thus,
 $\bar {M}_{nn}$ and
 $\bar {M}_{tt}$ can be interpreted as a permeability and a slip coefficient, respectively. The same average definitions apply to the quantities
 $T$ and
 $S$,
 \begin{equation} \bar{T}=\frac{1}{|\mathbb{U}|}\int_{\mathbb{U}} T \,{\rm d}\kern 0.06em x_t \,{\rm d}\kern 0.06em x_s, \quad \bar{S}=\frac{1} {|\mathbb{D}|}\int_{\mathbb{D}} S \,{\rm d}\kern 0.06em x_t \,{\rm d}\kern 0.06em x_s. \end{equation}
These quantities can be interpreted as effective solute diffusivities relative to a unitary solute flux in the positive ( $\bar {T}$) and negative (
 $\bar {S}$) directions. Quantities
 $\boldsymbol {M},\boldsymbol {N}, T, S$ are not solely properties of the geometry (as in the inertia-less case of Zampogna & Gallaire Reference Zampogna and Gallaire2020), but also of the fluid flow since they depend on the closure advective velocity.
Applying averages ((2.15), (2.16)) to (2.12), the following macroscopic boundary conditions are obtained:
 \begin{equation} \left.\begin{array}{c@{}}
\bar{u}_i^{\mathbb{O}}=\epsilon
Re_L(\bar{M}_{ij}\varSigma_{jk}^{\mathbb{O,U}}n_k+\bar{N}_{ij}\varSigma_{jk}^{\mathbb{O,D}}n_k),\\
\bar{c}^{\mathbb{O}}=\epsilon (\bar{T}
F_j^{\mathbb{O,U}}n_j+\bar{S} F_j^{\mathbb{O,D}}n_j).
\end{array}\right\}
\end{equation}
We specify that (2.17) is obtained from (2.12) by re-normalizing with the outer scales in (2.8).
2.6. The closure advective velocity
The solution to (2.14) lies in the closure advective velocity that gives rise to an inertia-driven coupling between the macroscopic and microscopic flows. Two different definitions have been considered in the present work:
(i) a constant advective velocity in the microscopic cell
(2.18)which leads to an Oseen-like equation (constant advection closure). This approach has already been proposed in the volume-averaged and homogenization frameworks by other authors for the flow over rough surfaces (Bottaro Reference Bottaro2019; Zampogna, Magnaudet & Bottaro Reference Zampogna, Magnaudet and Bottaro2019); \begin{equation} U_i=\bar{u}_i^{\mathbb{O}}, \end{equation}
(ii) a spatially dependent closure advective velocity, reconstructed from the outer stresses (variable advection closure),
(2.19)A similar approach has been proposed for the flow in bulk porous media (Valdés-Parada & Lasseux Reference Valdés-Parada and Lasseux2021; Sánchez-Vargas et al. Reference Sánchez-Vargas, Valdés-Parada, Trujillo-Roldán and Lasseux2023).\begin{equation} U_i=\epsilon Re_L ( M_{ij}\varSigma_{jk}^{\mathbb{O,U}}n_k+N_{ij}\varSigma_{jk}^{\mathbb{O,D}}n_k). \end{equation}


The equations for  $M_{ij}, Q_j, T$ in the microscopic problems thus become:
(i) for the constant advection closure approach in (2.18):
(2.20a)
$$\begin{gather} \left.\begin{array}{c@{}}
\epsilon Re_L
\dfrac{\mathcal{U}}{\mathcal{U}^{\mathbb{O}}}\bar{u}_m^{\mathbb{O}}
\partial_m M_{ij}={-}\partial_i Q_{j}
+\partial^2_{ll}M_{ij} +\delta_{\mathbb{C}}\delta_{ij},\\
\partial_i M_{ij}=0,\\ \varSigma_{pq}(M_{\cdot
j},Q_{j})n_q=0 \quad \text{on } \mathbb{U}, \mathbb{D},\\
M_{ij}=0 \quad \text{on } \partial \mathbb{M},\\
M_{ij},Q_{j} \quad \text{periodic along }
\boldsymbol{t},\boldsymbol{s}; \end{array}\right\}
\end{gather}$$(2.20b)
$$\begin{gather}\left.\begin{array}{c@{}}
\epsilon Re_L
\dfrac{\mathcal{U}}{\mathcal{U}^{\mathbb{O}}}\bar{u}_m^{\mathbb{O}}
\partial_m N_{ij}={-}\partial_i R_{j}
+\partial^2_{ll}N_{ij} -\delta_{\mathbb{C}}\delta_{ij},\\
\partial_i N_{ij}=0,\\ \varSigma_{pq}(N_{\cdot
j},R_{j})n_q=0 \quad \text{on } \mathbb{U}, \mathbb{D},\\
N_{ij}=0 \quad \text{on } \partial \mathbb{M},\\
N_{ij},R_{j} \quad \text{periodic along }
\boldsymbol{t},\boldsymbol{s}; \end{array}\right\}
\end{gather}$$(2.20c)
$$\begin{gather}\left.\begin{array}{c@{}}
\epsilon Pe_L
\dfrac{\mathcal{U}}{\mathcal{U}^{\mathbb{O}}}\bar{u}_i^{\mathbb{O}}
\partial_j T-\partial^2 _{ll}T+\delta_{\mathbb{C}} = 0,\\
(\epsilon Pe_L \bar{u}_i^{\mathbb{O}} T-\partial_jT)n_j = 0
\quad \text{on } \mathbb{U}, \mathbb{D},\\ T = 0 \quad
\text{on } \partial\mathbb{M}, \\ T \quad \text{periodic
along } \boldsymbol{t},\boldsymbol{s}; \end{array}\right\}
\end{gather}$$(2.20d)
$$\begin{gather}\left.\begin{array}{c@{}}
\epsilon Pe_L
\dfrac{\mathcal{U}}{\mathcal{U}^{\mathbb{O}}}\bar{u}_i^{\mathbb{O}}
\partial_j S-\partial^2 _{ll}S-\delta_{\mathbb{C}} = 0,\\
(\epsilon Pe_L \bar{u}_i^{\mathbb{O}} S-\partial_j S)n_j =
0 \quad \text{on } \mathbb{U}, \mathbb{D}, \\ S = 0 \quad
\text{on } \partial\mathbb{M}, \\ S \quad \text{periodic
along } \boldsymbol{t},\boldsymbol{s}; \end{array}\right\}
\end{gather}$$(ii) for the variable advection closure approach in (2.19):
(2.21a)
\begin{gather} \left.\begin{array}{c@{}}
\epsilon^2 Re_L^2
\dfrac{\mathcal{U}}{\mathcal{U}^{\mathbb{O}}}(M_{mn}\varSigma_{nl}^{\mathbb{O,U}}n_l+N_{mn}\varSigma_{nl}^{\mathbb{O,D}}n_l)
\partial_m M_{ij}={-}\partial_i Q_{j}
+\partial^2_{ll}M_{ij} +\delta_{\mathbb{C}}\delta_{ij},\\
\partial_i M_{ij}=0,\\ \varSigma_{pq}(M_{\cdot
j},Q_{j})n_q=0 \quad \text{on } \mathbb{U}, \mathbb{D},\\
M_{ij}=0 \quad \text{on } \partial \mathbb{M},\\
M_{ij},Q_{jk} \quad \text{periodic along }
\boldsymbol{t},\boldsymbol{s}; \end{array}\right\}
\end{gather}(2.21b)
\begin{gather} \left.\begin{array}{c@{}}
\epsilon^2 Re_L^2
\dfrac{\mathcal{U}}{\mathcal{U}^{\mathbb{O}}}(M_{mn}\varSigma_{nl}^{\mathbb{O,U}}n_l+N_{mn}\varSigma_{nl}^{\mathbb{O,D}}n_l)
\partial_m N_{ij}={-}\partial_i R_{j}
+\partial^2_{ll}N_{ij} -\delta_{\mathbb{C}}\delta_{ij},\\
\partial_i N_{ij}=0,\\ \varSigma_{pq}(N_{\cdot
j},R_{j})n_q=0 \quad \text{on } \mathbb{U}, \mathbb{D},\\
N_{ij}=0 \quad \text{on } \partial \mathbb{M},\\
N_{ij},R_{j} \quad \text{periodic along }
\boldsymbol{t},\boldsymbol{s}; \end{array}\right\}
\end{gather}(2.21c)
\begin{gather} \left.\begin{array}{c@{}}
\epsilon^2 Pe_L
\dfrac{\mathcal{U}}{\mathcal{U}^{\mathbb{O}}}(M_{mn}\varSigma_{nl}^{\mathbb{O,U}}n_l+N_{mn}\varSigma_{nl}^{\mathbb{O,D}}n_l)
\partial_j T-\partial^2_{ll} T+\delta_{\mathbb{C}} = 0,\\
(\epsilon^2 Pe_L
(M_{mn}\varSigma_{nl}^{\mathbb{O,U}}n_l+N_{mn}\varSigma_{nl}^{\mathbb{O,D}}n_l)
T-\partial_jT)n_j = 0 \quad \text{on } \mathbb{U},
\mathbb{D},\\ T = 0 \quad \text{on } \partial\mathbb{M}, \\
T \quad \text{periodic along }
\boldsymbol{t},\boldsymbol{s}; \end{array}\right\}
\end{gather}(2.21d)
\begin{gather} \left.\begin{array}{c@{}}
\epsilon^2 Pe_L
\dfrac{\mathcal{U}}{\mathcal{U}^{\mathbb{O}}}(M_{mn}\varSigma_{nl}^{\mathbb{O,U}}n_l+N_{mn}\varSigma_{nl}^{\mathbb{O,D}}n_l)
\partial_j S-\partial^2_{ll} S-\delta_{\mathbb{C}} = 0,\\
(\epsilon^2 Pe_L
(M_{mn}\varSigma_{nl}^{\mathbb{O,U}}n_l+N_{mn}\varSigma_{nl}^{\mathbb{O,D}}n_l)
S-\partial_j S)n_j = 0 \quad \text{on } \mathbb{U},
\mathbb{D},\\ S = 0 \quad \text{on } \partial\mathbb{M}, \\
S \quad \text{periodic along }
\boldsymbol{t},\boldsymbol{s}. \end{array}\right\}
\end{gather}


The tensors and scalars used in (2.17) are found either by solving (2.20) or (2.21). A computational iterative strategy to interface the macroscopic fields with the microscopic problems is required.
3. Solution of the microscopic problems
We investigate the influence of the closure advective velocity on the microscopic fields  $M_{ij}, N_{ij}, T$ and
 $S$, in the constant and variable advection closure cases. We introduce the porosity
 $\theta =|\mathbb {C_F}|/|\mathbb {C_F}\cup \mathbb {C_M}|$ as the fluid-to-total ratio at the membrane centreline
 $\mathbb {C}$ (cf. figure 1a). As a benchmark, we consider a circular inclusion of porosity
 $\theta =0.7$ (cf. figure 3a). The solution of (2.14) is computed numerically using the finite-element software COMSOL Multiphysics 6.0. We refer to Appendix A for further details about the numerical solution.
Flow fields within the microscopic domain with different advective velocities  $\check {u}_i$ obtained by solving the first two problems in the constant advection closure in (2.20) around a circular solid inclusion. (a) Microscopic domain. (b–g) Magnitude contours and streamlines (red) of
 $(M_{nn},M_{tn})$ for (b)
 $\check {u}_n=0,\check {u}_t=0$, (c)
 $\check {u}_n=50,\check {u}_t=0$, (d)
 $\check {u}_n=50,\check {u}_t=50$. Magnitude contours and streamlines of the tensors
 $(M_{nt},M_{tt})$ for (e)
 $\check {u}_n=0,\check {u}_t=0$, (f)
 $\check {u}_n=50,\check {u}_t=0$, (g)
 $\check {u}_n=50,\check {u}_t=50$.

3.1. Constant advection closure
In the constant advection closure problem, we specify the advective velocity in (2.14) as a constant field (2.18), obtaining (2.20). The solutions for the couples  $(M_{nn},M_{tn}),(M_{nt},M_{tt})$ are presented in figure 3. To compact the notation, we introduce
 $\check {u}_i=\epsilon Re_L ({\mathcal {U}}/{\mathcal {U}^{\mathbb {O}}})\bar {u}_i^{\mathbb {O}}$ in the term in front of the convective term on the left-hand side of (2.20), the inertia-driven coupling term with the macroscopic problem. We consider three values of
 $\check {u}_i$, corresponding to the pure diffusive case (
 $\check {u}_i=0$; panels
 $b,e$), a case of pure normal advection (
 $\check {u}_n\neq 0$ and
 $\check {u}_t=0$; panels
 $c,f$), and a case of normal and tangential advection (
 $\check {u}_n\neq 0$,
 $\check {u}_t\neq 0$; panels
 $d,g$). Recirculating zones propagate downstream the inclusion in the direction of the advective flow. Note that the same microscopic behaviour is noticed for
 $N_{ij}$, which satisfies
 $N_{ij}(\check {u}_i)=-M_{ij}(-\check {u}_i)$, and it is hence not shown.
By applying the averaging operators (2.15) and (2.16) to these fields for  $\check {u}_i$ in the range
 $[-50,50]$, we obtain the maps of
 $\bar {M}_{ij}, \bar {N}_{ij}$. Figure 4 shows the contours of
 $\bar {M}_{ij}$ and
 $\bar {N}_{ij}$ as functions of
 $\check {u}_i$. The off-diagonal components of
 $\bar {M}_{ij},\bar {N}_{ij}$ are zero when
 $\check {u}_i=0$. The
 $\cdot_{nt}$ and
 $\cdot _{tt}$ components show a strong asymmetry with respect to
 $\check {u}_n$. The permeability
 $\bar {M}_{nn}$ (figure 4a) is instead symmetric with respect to both components of
 $\check {u}_i$ and shows a maximum for
 $\check {u}_i=0$. This suggests that inertia always decreases the permeability unless both the off-diagonal components are non-zero and partially compensate for the diminished
 $\bar {M}_{nn}$. Similar considerations apply to
 $\bar {N}_{ij}$, since
 $\bar {M}_{ij}(\check {u}_k)=-\bar {N}(-\check {u}_k)$. To confirm this observation, we propose a comparison of
 $\bar {M}_{nn}$ values with theoretical and experimental results from Jensen, Valente & Stone (Reference Jensen, Valente and Stone2014b) in Appendix D.
Average hydrodynamic tensor components, obtained by applying (2.15) to a range of constant advection closure solutions like those presented in figure 3. (a)  $\bar {M}_{nn}$, (b)
 $\bar {M}_{nt}$, (c)
 $\bar {M}_{tn}$, (d)
 $\bar {M}_{tt}$, (e)
 $\bar {N}_{nn}$, (f)
 $\bar {N}_{nt}$, (g)
 $\bar {N}_{tn}$, (h)
 $\bar {N}_{tt}$.

We consider now the problem for  $T$ and
 $S$. We parametrize
 $T$ and
 $S$ in terms of the quantities appearing in the advective term, compacted as
 $\tilde {u}_i=\epsilon Pe_L ({\mathcal {U}}/{\mathcal {U}^{\mathbb {O}}}) \bar {u}_i^{\mathbb {O}}$. Figure 5 shows
 $T$ and
 $S$ in the pure diffusive case (panels a,d), an advective case with
 $\tilde {u}_n=100, \tilde {u}_t=0$ (panels b,e) and a case with
 $\tilde {u}_n=\tilde {u}_t=100$ (panels c,f).
Solute concentration fields within the microscopic domain with different advective velocities  $\tilde {u}_i$ obtained by solving the second two problems in the constant advection closure (2.20) around a circular solid inclusion. Contours of (a–c)
 $T$ and (d–f)
 $S$ for (a,d)
 $\tilde {u}_n=\tilde {u}_t=0$,
 $(\textit {b},\textit {e})\, \tilde {u}_n=100$,
 $\tilde {u}_t=0$ and (c,f)
 $\tilde {u}_n=\tilde {u}_t=100$ obtained using the constant advection closure approach.

Maps of  $\bar {T}$ are obtained by averaging
 $T$ using (2.15) and (2.16) for
 $\tilde {u}_i\in [-100,100]$ (figure 6). We notice that
 $\bar {T}(\tilde {u}_i,\tilde {u}_t)=\bar {T}(\tilde {u}_n,-\tilde {u}_t)$ and that the maximum (minimum) of
 $\bar {T}$ (
 $\bar {S}$) is attained for a non-zero
 $\tilde {u}_n$. This suggests that advection increases the effective diffusivity
 $\bar {T}$. Similar considerations apply for
 $S$ fields, which obey
 $\bar {S}(\tilde {u}_i)=-\bar {T}(-\tilde {u}_i)$. Eventually, the advective velocity can cause recirculating zones or concentration wakes downstream of the inclusions, with non-zero off-diagonal components of the tensors even in the absence of geometrical asymmetry (cf. figure 4b,c,f,g).
Average effective diffusivities, obtained by applying (2.16) to a range of constant advection closure solutions like those presented in figure 5. Contours of (a)  $\bar {T}$ and (b)
 $\bar {S}$ as a function of the advection velocity components
 $\tilde {u}_n,\tilde {u}_t$ obtained using the constant advection closure approach. (c) A zoom-in on the region where the maximum and minimum of
 $\bar {T}$ (blue) and
 $\bar {S}$ (red) are attained.

3.2. Variable advection closure
In the variable advection closure problem, we specify the advective velocity in (2.14) as a variable field, see (2.19), obtaining (2.21). The solutions for  $M_{ij}$ and
 $N_{ij}$ are presented in figure 3. The advective term depends on four parameters,
 $\check {\varSigma }^{\mathbb {U},\mathbb {D}}_{ij}=\epsilon ^2Re_L^2 ({\mathcal {U}}/{\mathcal {U}^{\mathbb {O}}}) \varSigma ^{\mathbb {U},\mathbb {D}}_{ij}n_j$ for the hydrodynamic problem and four parameters
 $\tilde {\varSigma }^{\mathbb {U},\mathbb {D}}_{ij}=\epsilon ^2 Pe_L ({\mathcal {U}}/{\mathcal {U}^{\mathbb {O}}}) \varSigma ^{\mathbb {U},\mathbb {D}}_{ij}n_j$ for the advection–diffusion problem (
 $T,S$). In figure 7, the effect of
 $\check {\varSigma }_{ij}^{\mathbb {U},\mathbb {D}}$ is shown for variations of some sample components of
 $M_{ij}$. The application of a non-zero stress component along a given direction causes the flow to deviate along that direction, eventually developing a laminar separation bubble downstream (for
 $\check {\varSigma }_{nn}$ with the same sign of the Dirac forcing) or upstream the inclusion (for
 $\check {\varSigma }_{nn}$ with opposed sign with respect to the Dirac forcing). By applying the averaging operators (2.15) and (2.16) to
 $M_{ij}$ and
 $N_{ij}$, the iso-levels of
 $\bar {M}_{ij},\bar {N}_{ij}$ are obtained for varying
 $\check {\varSigma }_{ij}^{\mathbb {U},\mathbb {D}}$ (cf. figure 8). This figure represents a sampling on a two-dimensional (2-D) sub-manifold of the four-dimensional (4-D) manifold where the averaged tensors live. Further sub-manifolds are presented in Appendix B for other values of
 $\check {\varSigma }_{ij}^{\mathbb {U},\mathbb {D}}$. The
 $\bar {M}_{nn}$ and
 $\bar {N}_{nn}$ terms show symmetry about two axes also in this case, while
 $\bar {M}_{ij}(\check {\varSigma }^{\mathbb {U},\mathbb {D}}_{ij})=-N(-\check {\varSigma }^{\mathbb {U},\mathbb {D}}_{ij})$. The maxima of permeability (
 $\bar {M}_{nn}$) are found in the case of Stokes flow (i.e. balanced
 $\check {\varSigma }_{ij}^{\mathbb {U}}$ and
 $\check {\varSigma }_{ij}^{\mathbb {D}}$ contributions). Slip (
 $\bar {M}_{tt}$) has a maximum for values of
 $\check {\varSigma }^{\mathbb {U}}_{nn}$ close to
 $\check {\varSigma }^{\mathbb {D}}_{nn}$, but not exactly corresponding to Stokes’ flow.
Flow fields within the microscopic domain with different advective velocities  $\check {\varSigma }_{ij}$ obtained by solving the first two problems in the constant advection closure (2.21) around a circular solid inclusion. Magnitude iso-contours and streamlines (red) of (a–e)
 $(M_{nn},M_{tn})$ and (
 $\,f$–
 $j$)
 $(M_{nt},M_{tt})$ for five different combinations of
 $\check {\varSigma }^{\mathbb {U},\mathbb {D}}_{ij}$. (a,f)
 $\check {\varSigma }^{\mathbb {U},\mathbb {D}}_{ij}=\epsilon ^2Re_L^2\varSigma ^{\mathbb {U},\mathbb {D}}_{ij}=0$; (b,g)
 $\check {\varSigma }^{\mathbb {U}}_{nn}=2500$, (c,h)
 $\check {\varSigma }^{\mathbb {U}}_{tn}=2500$, (d,i)
 $\check {\varSigma }^{\mathbb {D}}_{nn}=2500$ and (e,j)
 $\check {\varSigma }^{\mathbb {D}}_{tn}=2500$. For each case, the components of
 $\check {\varSigma }^{\mathbb {U},\mathbb {D}}_{ij}$ not specified are equal to zero. The variable advection closure is employed.

Average hydrodynamic tensor components, obtained by applying (2.15) to a range of variable advection closure solutions like those presented in figure 7. Iso-contours of average tensor component ( $a$)
 $\bar {M}_{nn}$, (
 $b$)
 $\bar {M}_{nt}$, (
 $c$)
 $\bar {M}_{tn}$, (
 $d$)
 $\bar {M}_{tt}$, (
 $e$)
 $\bar {N}_{nn}$, (
 $\,f$)
 $\bar {N}_{nt}$, (
 $g$)
 $\bar {N}_{tn}$, (
 $h$)
 $\bar {N}_{tt}$ for
 $(\check {\varSigma }^{\mathbb {U}}_{nn},\check {\varSigma }^{\mathbb {U}}_{tn})\in [-2500,2500]$, while
 $\check {\varSigma }^{\mathbb {D}}_{\cdot n}=0$. The variable advection closure approach is exploited.

The variable advection approach applied to the problem for  $T$ and
 $S$ in (2.14) gives (2.21). Its solution requires the tensors
 $M_{ij}$ and
 $N_{ij}$ to be known. For simplicity, we consider the case of diffusive momentum transport (
 $Re_L=0$, panel
 $a$, corresponding to
 $\bar {M}_{nn}=0.05$,
 $\bar {M}_{nn}=0.01$,
 $\bar {M}_{nt}=\bar {M}_{tn}=0$ and
 $\bar {N}_{ij}=-\bar {M}_{ij}$). The microscopic field
 $T$ is presented in figure 9 for different values of
 $\tilde {\varSigma }_{ij}^{\mathbb {U},\mathbb {D}}$. Here,
 $T$ exhibits a wake directed as the dominant inertial component for each case. By applying the average operator (2.15) and (2.16), we obtain the contours of
 $\bar {T}$ for
 $\tilde {\varSigma }^{\mathbb {U},\mathbb {D}}_{ij}\in [-50,50]$. Interestingly, in the considered range, there is a negligible influence of
 $\tilde {\varSigma }^{\mathbb {U},\mathbb {D}}_{tn}$, while
 $\tilde {\varSigma }^{\mathbb {U},\mathbb {D}}_{nn}$ is dominant in this problem. Similar considerations apply to
 $\bar {S}$, since
 $\bar {T}(\tilde {\varSigma }^{\mathbb {U},\mathbb {D}}_{nn})=-\bar {S}(-\tilde {\varSigma }^{\mathbb {U},\mathbb {D}}_{nn})$.
Solute concentration fields within the microscopic domain with different advective velocities  $\tilde {\varSigma }_{ij}$ obtained by solving the second two problems in the variable advection closure (2.21) around a circular solid inclusion. Iso-contours of the effective diffusivity
 $T$ computed using the variable advection closure model. (
 $a$)
 $\tilde {\varSigma }^{\mathbb {U},\mathbb {D}}_{ij}=0$, (
 $b$)
 $\tilde {\varSigma }^{\mathbb {U}}_{nn}=100$, (
 $c$)
 $\tilde {\varSigma }^{\mathbb {U}}_{tn}=100$, (
 $d$)
 $\tilde {\varSigma }^{\mathbb {D}}_{nn}=100$ and (
 $e$)
 $\tilde {\varSigma }^{\mathbb {D}}_{tn}=100$. For each panel, the components of
 $\tilde {\varSigma }_{ij}^{\mathbb {U},\mathbb {D}}$ not mentioned are equal to zero.

In this section, we presented relevant features of the microscopic flow occurring for non-negligible inertia. The microscopic solutions depend on the pore geometry and flow characteristics. A comparison of figures 6 and 10 shows that  $T$ depends strongly on
 $\tilde {u}_t$ but not on
 $\tilde {\varSigma }_{tn}^{\mathbb {U},\mathbb {D}}$. However, this apparent discrepancy can be explained by considering that not all points in figure 6 are images of points in figure 10 through (2.17). The range represented in figure 10 thus corresponds only to a thin zone around the axis
 $\tilde {u}_t=0$ in figure 6.
Average effective diffusivities, obtained by applying (2.16) to a range of variable advection closure solutions like those presented in figure 9. Contours of (a–d)  $\bar {T}$ and (e–h)
 $\bar {S}$. Each panel is obtained for a different value of
 $\tilde{\varSigma }^{\mathbb {U},\mathbb {D}}_{ij}$; (a,e)
 $\tilde {\varSigma }^{\mathbb {D}}_{nn}=\tilde {\varSigma }^{\mathbb {D}}_{tn}=0$, (b,f)
 $\tilde {\varSigma }^{\mathbb {D}}_{nn}=\tilde {\varSigma }^{\mathbb {D}}_{tn}=50$, (c,g)
 $\tilde {\varSigma }^{\mathbb {U}}_{nn}=\tilde {\varSigma }^{\mathbb {U}}_{tn}=0$, (d,h)
 $\tilde {\varSigma }^{\mathbb {U}}_{nn}=\tilde {\varSigma }^{\mathbb {U}}_{tn}=50$. The stress tensor components not mentioned in each panel are equal to zero. The variable advection closure approach is considered.

4. Comparison between full-scale simulations and homogenized model
In this section, we compare the macroscopic solution against simulations of the flow solved at all scales. We consider a two-dimensional flat membrane composed of circular inclusions with spacing  $\ell /L=\epsilon =0.1$, invested by a uniform stream. The computational domain is depicted in figure 11. Dirichlet boundary conditions on the velocity
 $(u_x,u_y)=(\sin \alpha, \cos \alpha )$ are imposed on the bottom and left sides of the domain, while a Neumann condition
 $\varSigma _{ij}n_j=0$ is imposed at the top and right sides of the domain. The no-slip condition
 $u_i=0$ is imposed on the surface of the inclusions
 $\partial \mathbb {M}$. For the solute concentration
 $c$, the Dirichlet condition
 $c=1$ applies on the left side of the domain, while
 $c=0$ is imposed on
 $\partial \mathbb {M}$. Zero-flux conditions apply on the external sides of the domain. The domain decomposition method (Quarteroni Reference Quarteroni2017) is employed to solve the macroscopic configuration by splitting the domain into two regions (cf. figure 11b) connected by the membrane's homogenized condition (2.17) on
 $\mathbb {C}$. Continuity of velocity and stresses are imposed on the fluid–fluid interfaces, identified by the dashed lines in figure 11(b). The macroscopic simulations are solved iteratively using a fixed-point scheme:
(i) the macroscopic problem is solved using the Stokes solution;
(ii) the values of
$\check {u}_i,\tilde {u}_i$ (for the constant advection closure approach) or $\check {\varSigma }_{ij}^{\mathbb {U},\mathbb {D}},\tilde {\varSigma }_{ij}^{\mathbb {U},\mathbb {D}}$ (for the variable advection closure approach) are sampled along the surface $\mathbb {C}$ cell-by-cell (i.e. by computing their average value in each segment of length $\ell$ on $\mathbb {C}$). This additional averaging of the velocity profile aligns with the need to match the continuous macroscopic solution with a discrete number of microscopic cells that form the membrane and is asymptotically coherent as long as variations of the local velocity from the average are of order ${O}(\epsilon ^2)$. In the ideal theoretical limit as $\epsilon \rightarrow 0$, the point-wise macroscopic velocity would replace the cell-by-cell average; however, this scenario is never encountered in real membrane geometries. We assumed $\mathcal {U}/\mathcal {U}^{\mathbb {O}}\sim 1$ in the present computations. However, when $\mathcal {U}/\mathcal {U}^{\mathbb {O}}\ll 1$ (like the case of flow purely tangential to the membrane), taking $\mathcal {U}/\mathcal {U}^{\mathbb {O}}$ as the average macroscopic velocity on the membrane is a cheaper alternative;(iii) we substitute these values into the microscopic problems in (2.14);
(iv) we solve again the macroscopic simulation with the new distribution of microscopic tensors, constant on each cell of length
$\ell$ and changing discontinuously between cells to get an updated version of the closure advection to be fed within the microscopic problems;(v) we iterate the procedure until convergence.


The convergence criterion is satisfied when the difference between two subsequent computations in terms of  $(u_i,c)$ on
 $\mathbb {C}$ is below
 $1\,\%$ of their mean values cell-by-cell. At each iteration, we perform
 $1/\epsilon$ microscopic (since the membrane is made of
 $1/\epsilon$ cells of length
 $\ell$, for a total length of
 $L$) and one macroscopic computation, with an averaging step in between. The comparison between the macroscopic model and the full-scale solution is performed in terms of averaged values of velocity and concentration on the membrane and point-wise values of the velocity, pressure and concentration fields far from the membrane. For simplicity, we compare separately the solvent and solute transport, which corresponds to considering
 $Re_L\neq 0$,
 $Pe_L=0$ (§ 4.1) and
 $Re_L= 0$,
 $Pe_L\neq 0$ (§ 4.2), respectively.
(a) Full-scale computational domain. Arrows correspond to a Dirichlet boundary condition on velocity (inlet), and outlet boundary condition corresponds to imposing  $\varSigma _{ij} n_j=0$. No slip is applied on the membrane walls. The origin of the axes is placed at the lowest end of the membrane, and the domain extends for
 $x_1\in [-1.5L,5.5L]$ and
 $x_2\in [-1.5L,3.5L]$. (b) Purely macroscopic computational domain. The full domain is separated into an upward and a downward domain by membrane centreline
 $\mathbb {C}$ (red).

4.1. Mass and momentum conservation
In this section, we focus on the solvent flow with  $Re_L=400$,
 $\epsilon =0.1$ and
 $\alpha =75^{\circ }$. In figure 12, we observe a wake developing downstream of each inclusion, forming a macroscopic wake downstream of the membrane, with parabolic-like velocity profiles across the openings of the membrane. Figure 13 shows the relative differences in the fields between the full-scale and homogenized models. The largest discrepancies are found in the region immediately downstream of the membrane. These discrepancies decrease from the Stokes to the constant and variable advection closure models (panels
 $a$,
 $c$ and
 $b$, respectively), confirming that the quasi-linear models well capture the flow structures for non-negligible inertial effects and the variable advection model is a faithful approximation of the Navier–Stokes solution at the microscopic scale. Figure 14 shows the values of
 $\bar {M}_{ij}$ and
 $\bar {N}_{ij}$ sampled on the membrane. The difference between the values of
 $\bar {M}_{ij}$ found using the Stokes and the constant and variable advection models is evident, in particular for the off-diagonal components. When advection is considered, the components
 $\cdot _{nn}$ and
 $\cdot _{tt}$ show a nearly constant value along the membrane which is different from the value predicted by the Stokes model. A comparison of the velocity fields at the membrane centreline
 $\mathbb {C}$ is presented in figure 15 and confirms the accuracy observed in figure 13. We consider also two sampling lines at
 $x_1=\pm \epsilon /2$, i.e. on the two sides of the interface, presented in figure 15(c). Pressure, sampled at
 $x_1=\pm \epsilon /2$, is captured more accurately by the constant advection and the variable advection models than by the Stokes model. Figure 16 shows local comparisons on the
 $x_2=0.5$ lines, exhibiting a good agreement between the full-scale and macroscopic fields far from the membrane.
(a,c) Velocity magnitude and (b,d) pressure iso-contours with velocity streamlines superimposed in the proximity of the membrane for (a,b) a full-scale and (c,d) a variable-advection macroscopic simulation for  $\alpha =75^{\circ }$,
 $\epsilon =0.1$ and
 $Re_L=400$. Black dashes indicate the location of the fictitious interface.

Contours of the relative error of (a–c) velocity magnitude and (d–f) pressure between the full-scale solution and the macroscopic models. Panels (a,d) refer to Stokes models, while panels (b,e) and (c,f) to the constant and variable advection closure, respectively. Fluid-flow and geometry parameters are  $\alpha =75^{\circ }$,
 $\epsilon =0.1$ and
 $Re_L=400$. Colourbar is in
 $\log _{10}e_r(\cdot )$-scale.

Averaged tensor values ( $a$)
 $\bar {M}_{nn}$, (
 $b$)
 $\bar {M}_{nt}$, (
 $c$)
 $\bar {M}_{tn}$, (
 $d$)
 $\bar {M}_{tt}$, (
 $e$)
 $\bar {N}_{nn}$, (
 $\,f$)
 $\bar {N}_{nt}$, (
 $g$)
 $\bar {N}_{tn}$ and (
 $h$)
 $\bar {N}_{tt}$ for
 $Re_L=400$,
 $\alpha =75^{\circ }$,
 $\epsilon =0.1$ with the Stokes (green line), constant advection closure (blue circles) and variable advection closure (red squares) problems.

( $a$) Horizontal and (
 $b$) vertical velocity and (
 $c$) pressure. In panels (
 $a$,
 $b$), velocity values are sampled on the membrane centreline (
 $x_1=0$,
 $x_2\in [-1,2]$) in the full-scale solution and on the fictitious interface in the macroscopic simulations. In panel (
 $c$), the pressure values are sampled at
 $x_1=\pm \epsilon /2$ and presented as dotted and full lines, respectively. Colour code, full-scale solution (black lines); averaged full-scale solution (black dots); constant (blue) and variable (red) advection closure; Stokes case (green). Configuration parameters are
 $\alpha =75^{\circ }$,
 $\epsilon =0.1$ and
 $Re_L=400$.

( $a$) Horizontal and (
 $b$) vertical velocity and (
 $c$) pressure sampled along a line at
 $x_2=0.5$ and
 $x_1\in [-1,2]$. The same colour code and configuration parameters as in figure 15 are used.

To assess the robustness of the previous observations, we vary  $Re_L$,
 $\epsilon$ and
 $\alpha$, and quantitatively evaluate the agreement between the full-scale solution and the macroscopic models via a global error defined as
 \begin{equation} e_g=\sqrt{\bar{e}_r(||\boldsymbol{u}||)^2+\bar{e}_r(|p|)^2}, \end{equation}
where  $\bar {e}_r$ is the mean of the point-wise relative error between the considered macroscopic model and the full-scale solution in the computational domain. Figure 17(a) shows the errors calculated for several configurations such that
 $\epsilon =0.1$,
 $\alpha \in [0^{\circ },90^{\circ }]$ and
 $Re_L\in [200,1000]$. Going from Stokes to constant and variable advection models, an overall decrease of
 $e_g$ is noticed. Figure 17(b) presents the dependence of
 $e_g$ on the velocity at the membrane as a function of
 $\epsilon$ for
 $Re_{\ell }\approx \epsilon Re_L=75$. Here,
 $\alpha =90^{\circ }$ for all computations. The error computed for the Stokes and the variable advection model shows nearly an order of magnitude of difference, with opposite trends as a function of
 $\epsilon$ (keeping
 $\epsilon Re_L$ constant). An additional test case, the flow in a channel vertically split by a membrane, is considered in Appendix C.
(a) Global error  $e_g$ defined in (4.1) for macroscopic simulations having
 $\epsilon =0.1$, and
 $\alpha$ ranging from
 $\alpha =0^{\circ }$ to
 $90^{\circ }$ and
 $Re_L$ from
 $200$ to
 $1000$. The values of
 $\alpha$ are represented using the colour code (legend in panel
 $a$), while the marker indicates the type of macroscopic model used to compute that data point (triangles for Stokes, squares for constant advection closure and circles for variable advection closure). (b)
 $e_g$ for the Stokes and variable advection closure model for different values of
 $\epsilon$. All simulations have
 $Re_{\ell }=75$ and
 $\alpha =90^{\circ }$. A constant value of
 $Re_{\ell }=75$ has been realized by choosing the
 $(\epsilon,Re_L)$ couples as
 $(0.1,750)$,
 $(0.05,1500)$ and
 $(0.025,3000)$. Same marker code as for panel (
 $a$).

4.2. Solute flux conservation
We consider the case of  $Pe_L> 0$. To increase
 $Pe_L$, we decrease the diffusivity
 $D$ while
 $Re_L$ remains negligible. This allows us to assess the reliability of the model independently of the solvent flow approximation. We consider a set-up with
 $\alpha =90^{\circ }$,
 $\epsilon =0.1$ and
 $Pe_L=1000$. The iso-contours of the flow fields solved at all scales are presented in figure 18. The velocity field (panel a) shows a small wake downstream of the membrane. The macroscopic flow does not present a re-circulation region, coherent with the hypothesis of negligible inertia. Conversely, the effect of the finite Péclet number is evident in panel (
 $b$), where the solute concentration iso-levels are aligned with the solvent flow streamlines. The
 $\bar {T}$ and
 $\bar {S}$ values found in the present flow configuration using the different models are collected in figure 19. The values of
 $\bar {T}$ and
 $\bar {S}$ found using the Stokes and constant advection model are quite similar, as opposed to those obtained using the variable advection model.
(a,c) Velocity magnitude and ( $b$,
 $d$, red lines) concentration iso-contours with velocity streamlines for (
 $a$,
 $b$) a full-scale and (
 $c$,
 $d$) a variable-advection macroscopic solution at
 $Re_L=0$,
 $Pe_L=1000$,
 $\alpha =90^{\circ }$ and
 $\epsilon =0.1$. Black dashes indicate the location of the fictitious interface.

Values of ( $a$)
 $\bar {T}$ and (
 $b$)
 $\bar {S}$ along the membrane for Stokes (green line), constant advection closure (blue circles) and variable advection closure (red squares). The flow parameters are
 $\alpha =90^{\circ }$,
 $\epsilon =0.1$,
 $Pe_L=1000$ and
 $Re_L=0$.

The variable advection model shows larger differences with respect to the Stokes solution compared with those with the constant advection closure model. We present a comparison of the concentration values on the membrane ( $x_1=0$) and its axis (
 $x_2=0.5$) in figure 20. The variable advection closure approach shows a good agreement with the full-scale solution both on the membrane (panel
 $a$) and in the far-field, represented by the values of solute concentration sampled on the membrane axis (panel
 $b$). The constant advection closure offers little improvement in terms of accuracy, compared with the Stokes case. We conclude that the maximum accuracy for the case of finite Péclet number is found using the variable advection closure, in analogy with the non-zero Reynolds number case. The quasi-linear homogeneous model is thus more accurate than the Stokes model. In addition, the variable advection approach shows a better agreement with full-scale simulations than the constant advection approach. However, we observe that the new macroscopic approximations are computationally more expensive than the Stokes model. Models of engineering interest used in preliminary design phases need to provide a fast and accurate output which can be used as a starting point for more expensive computations. In the following section, we discuss the trade-off between accuracy and computational efficiency, a key aspect of industrial flow modelling.
Comparison between the values of concentration  $c$ sampled (
 $a$) on the membrane centreline
 $\mathbb {C}$ or (
 $b$) on the membrane axis, corresponding to a line at
 $x_2=0.5$ and
 $x_1\in [-1,2]$. The same colour coding as in figure 15 has been adopted. The flow parameters are
 $\alpha =90^{\circ }$,
 $\epsilon =0.1$,
 $Pe_L=1000$ and
 $Re_L=0$.

5. Towards data-driven homogenization: improving the computational efficiency through a central-value approximation
The constant and variable advection closure models require the solution of (2.14) in each microscopic cell forming a single membrane, i.e.  $1/\epsilon$ times at each iteration (or
 $N/\epsilon$ for
 $N$ membranes whose inclusions have spacing
 $\epsilon$). This leads to a loss in computational efficiency compared with the Stokes model, which requires only one microscopic solution without any iterative procedure. In the following, we propose a strategy to reduce the computational cost of the macroscopic solution focusing on the previously validated variable-advection approach. To avoid overloading this article, we consider only the hydrodynamic problem. However, the efficient solution strategy proposed in this section applies also to the constant advection model and advection–diffusion equations.
5.1. Computing a single membrane using its central values
The quantities  $\mathcal {P}=(\check {u}_i,\tilde {u}_i,\check {\varSigma }^{\mathbb {U},\mathbb {D}}_{ij},\tilde {\varSigma }^{\mathbb {U},\mathbb {D}}_{ij})$ affect the values of
 $\bar {M}_{ij}$,
 $\bar {N}_{ij}$,
 $\bar {T}$ and
 $\bar {S}$. We notice that the dispersion of
 $\bar {M}_{ij}$ and
 $\bar {N}_{ij}$ observed in figure 14 is small (less than
 $5\,\%$ of the mean membrane values for the three dominant components (
 $\bar {M}_{nn},\bar {N}_{nn}$ and
 $\bar {M}_{tt}$) of the
 $\bar {M}_{ij}$ and
 $\bar {N}_{ij}$ tensors). For the simple geometry presented in figure 11, the central value of this dispersion roughly corresponds to the values of
 $\mathcal {P}$ evaluated at the membrane's centre. We can thus employ the values of
 $\mathcal {P}$ reached in the middle of the membrane in the evaluation of
 $\bar {M}_{ij},\bar {N}_{ij},\bar {T}$ and
 $\bar {S}$. To assess the validity of this approach, we consider the case
 $\alpha =60^{\circ }$,
 $Re_L=700$. Figure 21 presents a comparison of the cell-averaged values of the solvent velocity and pressure on the membrane obtained in the full-scale solution and using the Stokes and variable advection closure models, clustered (i.e. obtained using a single microscopic computation for all cells at each iteration) and unclustered (i.e. using one microscopic computation for each cell at each iteration). Figure 22 compares the solvent flow fields sampled along the axis of the membrane. In both figures 21 and 22, the variable advection closure clustered and unclustered versions predict very similar values of the flow fields. Average relative differences between the two approaches are of the order of
 $0.05\epsilon$, well below the accuracy of the homogeneous model (
 ${O}(\epsilon )$). In terms of computational cost, the clustered version requires only one computation per iteration (similar to the Stokes solution), while the unclustered one requires
 $1/\epsilon$.
Comparison between the ( $a$) averaged full-scale solution normal velocity, (
 $b$) tangential velocity and (
 $c$) pressure. Velocity components are sampled on the membrane centreline
 $\mathbb {C}$ in the full-scale solution and the fictitious interface in the macroscopic cases (
 $x_1=0, y\in [0,1]$). Pressure is sampled on two lines parallel to
 $\mathbb {C}$ and distant
 $\pm \epsilon /2$ (dotted and full lines, respectively). The colour code is common to all panels: black dots for the cell-averaged values of the full-scale solution, green lines for the Stokes model, red lines for the variable advection closure unclustered model and blue lines for the variable advection closure, clustered model. The flow and geometry parameters are
 $\alpha =60^{\circ }$,
 $Re_L=700$,
 $\epsilon =0.1$.

Comparison between flow field values of ( $a$) normal velocity, (
 $b$) tangential velocity and (
 $c$) pressure sampled along the axis of the membrane,
 $x_2=0.5$,
 $x_1\in [-1,2]$. The same colour code as in figure 21 is adopted. The flow and geometry parameters are
 $\alpha =60^{\circ }$,
 $Re_L=700$,
 $\epsilon =0.1$.

5.2. Clustering the cells
In the previous paragraph, the centre of the membrane was used to compute one set of approximate values of the tensors  $\bar {M}_{ij}$ and
 $\bar {N}_{ij}$ in place of
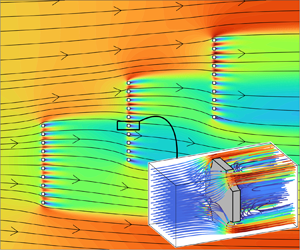
 $1/\epsilon$ (i.e. one for each microscopic cell). Flow and geometry configurations of industrial interest are generally more complicated. We introduce a clustering algorithm in our macroscopic simulation workflow to automate the choice of a subset of flow conditions (i.e. of the
 $\mathcal {P}$ quantities) which can approximate the real, cell-wise distribution of
 $\mathcal {P}$. Given a set of length
 $N$ of the flow quantities
 $\mathcal {P}$, we divide
 $\mathcal {P}$ into
 $K \leq N$ clusters in which each element belongs to the cluster with the nearest centroid. We thus represent the cluster using its centroid. Several algorithms for splitting datasets into clusters have been proposed in the literature, see Bishop (Reference Bishop2006) for a review. Testing their relative performance in the present case goes beyond the scope of this work. For this reason, as an example, we choose the K-Means++ (Arthur & Vassilvitskii Reference Arthur and Vassilvitskii2007), implemented in Matlab 2023a. This algorithm splits a given set of data into a user-defined number of clusters according to a notion of distance, Euclidean in the present case. The optimal number of clusters can be found using some heuristic procedures, like the ‘elbow rule’ (Tibshirani, Walther & Hastie Reference Tibshirani, Walther and Hastie2001), but the cluster distribution is sufficiently evident in this case that the iterative procedure can be avoided. Figure 23(a) shows the considered flow configuration. It consists of three identical membranes composed of circular inclusions with spacing
 $\epsilon =0.1$, immersed in a free stream at
 $Re_L=500$. Velocity magnitude iso-levels and velocity streamlines are presented in panel (
 $a$). On the top and bottom sides of the domain, a no-slip boundary condition is applied. The leftmost membrane is fully exposed to the flow, as well as the top portions of the other two membranes, while the bottom portions experience milder flow conditions. Panel (
 $b$) shows that the data are clustered in three or four blocks, corresponding to the different flow conditions at the cell level. By computing the microscopic cases using the
 $\varSigma _{ij}^{\mathbb {U},\mathbb {D}}$ of each cluster centroid, we solve the corresponding macroscopic computation. A comparison of the velocity at the membranes in the full-scale solution and the clustered variable advection closure macroscopic solution is presented in figure 24. The prediction based on the four clusters is satisfactory compared with the full-scale solution, with minor discrepancies only in the tangential velocity of the red cluster. In terms of required computational resources, on a laptop with one INTEL i9-10900HK CPU (8 cores, 2.40 GHz) and 32 GB of RAM, a microscopic variable advection closure simulation has a run-time of up to 3 min, while a macroscopic simulation takes approximately 1 min. The clustering step proposed in this section has reduced the number of microscopic problems from
 $30$ to
 $4$ cases per iteration, which translates into a microscopic iteration step
 $7.5$ times faster. In general, if we suppose that the number of iterations and the number of clusters at each iteration are
 ${O}(1)$, while the number of microscopic cases to run at each iteration without clustering is
 ${O}(1/\epsilon )$, then clustering makes the iterative procedure
 ${O}(1/\epsilon )$ times faster. For the cases proposed in this work, a few iterations were needed for convergence: for
 $\epsilon Re_L$ of order
 $10$, generally,
 $1{-} 2$ iterations are sufficient, while for
 $\epsilon Re_L$ of order
 $100$, we need 5–6 iterations.
( $a$) Contours of velocity magnitude and streamlines (red) in the full-scale solution for
 $\alpha =90^{\circ }$,
 $\epsilon =0.1$ and
 $Re_L=500$. Each of the three identical membranes contains ten circular solid inclusions of porosity
 $0.7$ and spacing
 $\epsilon$. Inclusions
 $1$,
 $11$ and
 $21$ are located in
 $(0,0),(L,0.5L)$ and
 $(2L,L)$, respectively. The domain extent is
 $x_1\in [-1.5L,5.5L]$ and
 $y\in [-1.5L,3.5L]$. No slip is imposed on the top and bottom sides of the domain, while
 $(u_1,u_2)=(1,0)$ is imposed on the leftmost side and
 $\varSigma _{ij}n;j=0$ on the rightmost side of the domain. Cells are numbered from bottom to top and left to right (red text). (
 $b$) A possible clustering choice for the cells on the membrane obtained using the Matlab k-Means algorithm. Each cluster is visualized in a different marker and colour. Black markers represent the centroids of each cluster. Here,
 $\varSigma _{tn}^{\mathbb {D}}$ is close to zero, thus it does not affect the results and it is hence not shown. Black numbers refer to corresponding cells in panel (
 $a$).

(a–c) Normal and (d–f) tangential velocity components on the centreline of each membrane. Black dots represent cell-averaged values of the full-scale solution, green lines represent the unclustered variable advection closure model and red lines are the clustered variable advection closure model. (g–i) Pressure values sampled at  $\pm \epsilon /2$ from each centreline in the full-scale solution (full black line) and corresponding values for the unclustered variable advection closure model (green) and clustered variable advection closure (red) sampled on the corresponding sides of the fictitious interfaces. Panels (
 $a$,
 $d$,
 $g$) refer to the leftmost membrane, panels (
 $b$,
 $e$,
 $h$) to the central one and panels (
 $c$,
 $f$,
 $i$) to the rightmost membrane in figure 23(a).

Concerning the case proposed in figure 23, this case reaches a steady state in approximately  $100$ time units. In a laptop with one INTEL i9-10900HK CPU (
 $8$ cores,
 $2.40$ GHz) and
 $32$ GB of RAM, the full-scale simulation (
 ${\sim }270k$ degrees of freedom, kDOFs) has a runtime of approximately 310 s. The runtime of the macroscopic simulation sums up as follows: approximately
 $5$ s for a single initial Stokes microscopic problem, 80 s for the initial variable advection microscopic problem (
 $\sim$140 kDOFs), initialized with the Stokes solution, approximately
 $35$ s for each of the following variable advection microscopic problems, initialized with the previous solution. A single macroscopic solution (
 $\sim$55 kDOFs) takes approximately
 $10$ s. The problem requires three iterations (initialization included) and can be accurately approximated with four clusters for the microscopic problems. The total runtime for the macroscopic simulation is
 $5\ \textrm {s}+80 \textrm {s}+2\times 4\times 35\ \textrm {s}+3\times 10\ \textrm {s}=395\ \textrm {s}$. In the present case and from a total runtime point of view, using the macroscopic model does not imply a substantial computational gain. However, we should consider that:
(i) the macroscopic simulation is
$\epsilon$-insensitive, i.e. its computational cost does not depend on the ratio between the pore and the membrane scales, whereas the full-scale simulation depends mainly on $\epsilon$, since it requires resolving all details of the microstructure;(ii) in the macroscopic simulation, there are no mesh expansion-ratio-related problems, whereas it can be the case for the full-scale simulation, in particular, when
$\epsilon$ is low or the microstructure has a non-trivial shape;(iii) the RAM usage in the macroscopic case is reduced compared with the full-scale simulation since the iterative procedure splits the microscopic and macroscopic simulations;
(iv) most of the difference in runtime between the macroscopic and full-scale simulations stems from the microscopic coupling step. Creating a database of geometries and advective-velocity conditions or finding a surrogate model for them could further reduce the computational cost of the macroscopic simulation, making it of the order of the single macroscopic step in the coupling procedure.


These factors suggest that there is a gain in computational effort in using the present model when: (i) the scale separation is extreme (i.e. small  $\epsilon$); (ii) the details of the microstructure require a non-negligible effort in preparing the mesh; (iii) the advective velocities are close to some representative mean value; and (iv) the RAM usage is limited. An even more significant gain is expected with surrogate models based on a large dataset of microscopic simulations.
6. Conclusion and perspectives
In this work, we developed a quasi-linear model to predict the solvent flow and diluted solute transport across thin permeable membranes in the case of non-negligible inertia at the pore scale. We exploited the separation of scales between the membrane and the pore size to decompose the mathematical problem into purely macroscopic equations and a microscopic problem which requires parametric inputs from the macro-scale stemming from the flow inertia at the pore scale. The presence of inertia therefore requires the approximation of the advective terms in the equations for the solvent flow and solute transport. An iterative procedure is employed to feed the microscopic problems with the macroscopic quantities included in the inertial terms within the Navier–Stokes and advection–diffusion equations. The macroscopic solution converges in an average sense to the fully resolved direct numerical simulations on the membrane and in the far-field.
Our work aims at extending the macroscopic, homogenized, description of filtration flows across permeable membranes towards practical applications when the Reynolds and Péclet numbers at the pore scale cannot be neglected. A relevant improvement in accuracy compared with the inertia-less version is found, for microscopic Reynolds number of order  $10$. In addition, preliminary faithful results can be obtained through machine learning clustering algorithms. This approach could offer a beneficial trade-off between efficiency and accuracy for large systems of industrial interest, such as filters or fuel cells (Cullen et al. Reference Cullen, Neyerlin, Ahluwalia, Mukundan, More, Borup, Weber, Myers and Kusoglu2021; Wang et al. Reference Wang2023). In typical applications involving microfluidic circuits, flow inertia is either disregarded or considered a detrimental effect since it may affect the low-Reynolds-number hydrodynamic analytical predictions. However, our model establishes a specific relation between permeability properties and flow inertia. Hence, filtration properties can be finely tuned by selecting the flow rate within microfluidic channels, using the Reynolds and Péclet numbers as control parameters, and thus become a design parameter in addition to geometrical properties. As a matter of fact, for the same geometry, one can obtain a broad spectrum of filtration properties by simply changing the flow rate. Flow inertia thus becomes an opportunity to extend the working conditions of filtering systems.
This work could be extended in several ways. First, in the present form, the model cannot be applied to the case of macroscopic unsteady configuration triggered by pore-scale hydrodynamic instabilities (Nicolle & Eames Reference Nicolle and Eames2011). To extend the model towards larger Reynolds numbers, space–time averages need to be introduced and data-aided physics-informed microscopic models are required to efficiently handle the micro–macro coupling. The quasi-linear iterative strategy developed in the present paper may open the door to the modelling of other, low- $Re$, nonlinear phenomena, such as the variation of viscosity with the solute concentration and osmotic or phoretic flows through semi-permeable structures, which typically present a strong nonlinear coupling between the solvent velocity and the solute concentration (Marbach, Yoshida & Bocquet Reference Marbach, Yoshida and Bocquet2017).
Acknowledgements
The authors are profoundly grateful to Prof. F. Gallaire for his assistance and, in particular, for the insightful discussions concerning the treatment of the nonlinearities in the microscopic problem.
Funding
This work was supported by the Swiss National Science Foundation (grant no.  $PZ00P2\_193180$).
Declaration of interests
The authors report no conflict of interest.
Code availability
The source code, along with some examples, is available on GitHub at this link.
Appendix A. Computational details
The microscopic and macroscopic equations and the full-scale solution presented in § 4 have been solved numerically using the finite-element solver COMSOL Multiphysics 6.0. The coupling between the microscopic and the macroscopic problems is automated thanks to the Matlab Livelink extension. The spatial convergence of the mesh has been tested for each model and flow configuration. The same criterion has been used for the microscopic calculations. All simulations are performed using a Taylor–Hood P2-P1 scheme for coupling velocity and pressure and a P2 scheme for the solute concentration. The deriving linear systems are solved using MUMPS and a time marching procedure is exploited to find the stationary solution. We present hereafter the results of the convergence study for  $\epsilon =0.1$,
 $Re_L=500$,
 $\alpha =90^{\circ }$ and circular inclusions with porosity
 $0.7$ for the macroscopic and full-scale simulations. We start with a mesh whose typical size is:
(i)
$0.01L$ on the macroscopic interface and $0.045L$ far from it for the macroscopic problem (corresponding to $K=1$ in figure 25a);(ii)
$0.0015L$ on the solid boundary and $0.05L$ far from it for the full-scale problem (corresponding to $K=1$ in figure 25b);(iii)
$0.04\ell$ near the solid inclusion and $0.5\ell$ far from them for the microscopic problems (corresponding to $K=1$ in figure 1),


and explore a range of  $K$ values to verify that the results are mesh-independent, where
 $K$ is a parameter dividing the initial mesh sizing for each simulation. We consider the mesh converged when the force magnitude
 $F=\|\int _{\mathbb {C}}\varSigma _{ij}n_j \,\textrm {d}S\|$ applied by the fluid on the fictitious interface
 $\mathbb {C}$ in the macroscopic simulation and on
 $\partial \mathbb {M}$ in the full-scale simulation reaches an asymptotic value and the relative error between two
 $F$ values sampled at two subsequent values of
 $K$ is less than
 $0.2\,\%$. The converged macroscopic mesh has
 $91\,304$ elements and the full-scale one has
 $237\,900$, both corresponding to
 $K=1$ (cf. figure 25). The parameters of the microscopic case are
 $\check {\varSigma }^{\mathbb {U}}_{ij}n_j=10^4$ and
 $\check {\varSigma }^{\mathbb {D}}_{ij}n_j=0$. We consider the mesh converged when the relative difference between the non-zero values of
 $\bar {M}_{ij}$,
 $\bar {N}_{ij}$ is less than
 $1\,\%$ for two subsequent values of
 $K$. The final mesh contains
 $12\,780$ elements, corresponding to
 $K=10$ in table 1. We also tested the convergence of the microscopic problems concerning changes in the domain width in the normal direction,
 $w$. We present a typical convergence study for
 $\check {\varSigma }_{nn}^{\mathbb {\mathbb {U}}}=\check {\varSigma }_{tn}^{\mathbb {\mathbb {U}}}=10^4$ and
 $\check {\varSigma }_{nn}^{\mathbb {\mathbb {D}}}=\check {\varSigma }_{tn}^{\mathbb {\mathbb {D}}}=0$ in figure 26. The green shaded zone corresponds to a range of
 $\pm$1 % about the value at maximum amplitude
 $w$ of each tensor component and is used as a threshold for convergence. Only the relevant tensor components
 $\bar {M}_{nn},\bar {M}_{nt},\bar {N}_{nn},\bar {N}_{nt}$ and
 $\bar {N}_{tt}$ have been used to test the convergence of the tensors with respect to the domain width. A domain of length
 $9\ell$ represents a good trade-off between accuracy and computational cost.
Force magnitude  $F$ (black) acting on (
 $a$)
 $\mathbb {C}$ in the macroscopic simulation and (
 $b$) on the solid boundary
 $\partial \mathbb {M}$ in the full-scale simulation and relative error between two consequent values of
 $F$ (red) as a function of
 $K$ for
 $Re_L=500,\alpha =90^{\circ }, \epsilon =0.1$ and circular solid inclusions of porosity
 $0.7$.

Averaged values of  $M_{ij}$ as a function of the mesh factor
 $K$ for a microscopic problem with variable advection computed around a circular solid inclusion of porosity
 $0.7$ for
 $\check {\varSigma }^{\mathbb {U}}_{ij}=10^4$ and
 $\check {\varSigma }^{\mathbb {D}}_{ij}=0$. Only the values of
 $\bar {M}_{nn}, \bar {N}_{nn}$ and
 $\bar {N}_{tt}$ are considered for the mesh convergence study since the other components have negligible values at convergence (
 $K\geq 10$).

Microscopic tensors average values as a function of the domain amplitude  $w$ [
 $\ell$]. The green shaded zone corresponds to a range of
 $\pm 1\,\%$ about the tensor value obtained at maximum domain amplitude.

Appendix B. Further variable advection closure maps
Figures 27–31 present further 2-D sub-manifolds of the 4-D manifold of  $\bar {M}_{ij}$ and
 $\bar {N}_{ij}$ values found by solving the variable advection closure microscopic problem (2.21).
Average tensor values ( $a$)
 $\bar {M}_{nn}$, (
 $b$)
 $\bar {M}_{nt}$, (
 $c$)
 $\bar {M}_{tn}$, (
 $d$)
 $\bar {M}_{tt}$, (
 $e$)
 $\bar {N}_{nn}$, (
 $\,f$)
 $\bar {N}_{nt}$, (
 $g$)
 $\bar {N}_{tn}$, (
 $h$)
 $\bar {N}_{tt}$ varying
 $\check {\varSigma }^{\mathbb {D}}_{nn}$ and
 $\check {\varSigma }^{\mathbb {D}}_{tn}$, while
 $\check {\varSigma }^{\mathbb {U}}_{nn}=\check {\varSigma }^{\mathbb {U}}_{tn}=0$.

Average tensor values ( $a$)
 $\bar {M}_{nn}$, (
 $b$)
 $\bar {M}_{nt}$, (
 $c$)
 $\bar {M}_{tn}$, (
 $d$)
 $\bar {M}_{tt}$, (
 $e$)
 $\bar {N}_{nn}$, (
 $\,f$)
 $\bar {N}_{nt}$, (
 $g$)
 $\bar {N}_{tn}$, (
 $h$)
 $\bar {N}_{tt}$ varying
 $\check {\varSigma }^{\mathbb {U}}_{nn}=\epsilon ^2 Re_L^2 \varSigma ^{\mathbb {U}}_{nn}$ and
 $\check {\varSigma }^{\mathbb {U}}_{tn}$, while
 $\check {\varSigma }^{\mathbb {D}}_{nn}=2500$ and
 $\check {\varSigma }^{\mathbb {D}}_{tn}=0$.

Average tensor values ( $a$)
 $\bar {M}_{nn}$, (
 $b$)
 $\bar {M}_{nt}$, (
 $c$)
 $\bar {M}_{tn}$, (
 $d$)
 $\bar {M}_{tt}$, (
 $e$)
 $\bar {N}_{nn}$, (
 $\,f$)
 $\bar {N}_{nt}$, (
 $g$)
 $\bar {N}_{tn}$, (
 $h$)
 $\bar {N}_{tt}$ varying
 $\check {\varSigma }^{\mathbb {U}}_{nn}=\epsilon ^2 Re_L^2 \varSigma ^{\mathbb {U}}_{nn}$ and
 $\check {\varSigma }^{\mathbb {U}}_{tn}$, while
 $\check {\varSigma }^{\mathbb {D}}_{nn}=0$ and
 $\check {\varSigma }^{\mathbb {D}}_{tn}=2500$.

Average tensor values ( $a$)
 $\bar {M}_{nn}$, (
 $b$)
 $\bar {M}_{nt}$, (
 $c$)
 $\bar {M}_{tn}$, (
 $d$)
 $\bar {M}_{tt}$, (
 $e$)
 $\bar {N}_{nn}$, (
 $\,f$)
 $\bar {N}_{nt}$, (
 $g$)
 $\bar {N}_{tn}$, (
 $h$)
 $\bar {N}_{tt}$ varying
 $\check {\varSigma }^{\mathbb {U}}_{nn}=\epsilon ^2 Re_L^2 \varSigma ^{\mathbb {U}}_{nn}$ and
 $\check {\varSigma }^{\mathbb {U}}_{tn}$, while
 $\check {\varSigma }^{\mathbb {D}}_{nn}=-2500$ and
 $\check {\varSigma }^{\mathbb {D}}_{tn}=0$.

Average tensor values ( $a$)
 $\bar {M}_{nn}$, (
 $b$)
 $\bar {M}_{nt}$, (
 $c$)
 $\bar {M}_{tn}$, (
 $d$)
 $\bar {M}_{tt}$, (
 $e$)
 $\bar {N}_{nn}$, (
 $\,f$)
 $\bar {N}_{nt}$, (
 $g$)
 $\bar {N}_{tn}$, (
 $h$)
 $\bar {N}_{tt}$ varying
 $\check {\varSigma }^{\mathbb {U}}_{nn}=\epsilon ^2 Re_L^2 \varSigma ^{\mathbb {U}}_{nn}$ and
 $\check {\varSigma }^{\mathbb {U}}_{tn}$, while
 $\check {\varSigma }^{\mathbb {D}}_{nn}=0$ and
 $\check {\varSigma }^{\mathbb {D}}_{tn}=-2500$.

Appendix C. Flow inside a channel obstructed by a membrane
Zampogna & Gallaire (Reference Zampogna and Gallaire2020) proposed several macroscopic validation cases, among which is a 2-D channel obstructed by the presence of a membrane on its full section. We consider a similar test case, a 2-D channel of dimensions  $7L \times 1L$, obstructed by a porous membrane constituted by
 $10$ circular solid inclusions of porosity
 $\theta =0.7$. Figure 32 shows the corresponding pressure fields and streamlines in (
 $a$) the full-scale, (
 $b$) macroscopic obtained using Stokes approximation and (
 $c$) macroscopic obtained with the variable advection closure cases. Panels (
 $d$,
 $e$) show the average velocity components sampled along
 $\mathbb {C}$. The problem is dominated by mass conservation since the flow is forced to cross the membrane. The velocity on the membrane using the Stokes and the variable advection closure models is predicted with similar accuracy. However, the pressure fields show major differences upstream of the membrane, confirming the superior accuracy of the variable advection closure model with respect to the Stokes model.
Flow across a membrane obstructing a 2-D channel at  $Re_L=400$. Pressure contours and streamlines for (
 $a$) the full-scale, (
 $b$) macroscopic with Stokes approximation and (
 $c$) macroscopic with variable advection closure models. (
 $d$) Horizontal and (
 $e$) vertical average velocity components on the membrane: full-scale (black), macroscopic with Stokes (green) and macroscopic with the variable advection closure model (red). (
 $\,f$) Pressure sampled on a line crossing the whole domain at
 $x_2=0.5$: full-scale (black), macroscopic with Stokes (green) and macroscopic with the variable advection closure model (red). The original domain is
 $7L\times 1L$ wide, but here we focus on the flow near the membrane.

Appendix D. Comparison between microscopic constant advection closure solutions and experimental data
In § 3.1, we observed that the permeability  $\bar {M}_{nn}$ decreases as the flow inertia within the pore increases. In this section, we compare the theoretical model of Jensen et al. (Reference Jensen, Valente and Stone2014b) and the experimental results of Johansen (Reference Johansen1930) with the constant advection closure model prediction. Indeed, the latter allows for a direct comparison since the flow inertia is expressed in terms of average velocity (or microscopic Reynolds number) across the pore. Starting from the Stokes flow solution across a circular pore, Jensen et al. (Reference Jensen, Valente and Stone2014b) proposed the following empirical model for the normal flow of a viscous fluid across a periodic, thin, porous membrane, in the presence of inertia:
 \begin{equation} \frac{\hat{q}}{\Delta \hat{p}}=\frac{\hat{a}^3}{3\mu\left[ \dfrac{8}{3{\rm \pi}}\dfrac{\hat{t}}{\hat{a}} -G \left( \dfrac{\hat{a}}{{\ell}} \right)^3 + \dfrac{\phi(Re_{pore})}{3}\right]}, \end{equation}
where  $\hat {q}$ is the pore flow rate,
 $\Delta \hat {p}$ is the pressure drop across the membrane,
 $\hat {t}$ is the membrane thickness,
 $\hat {a}$ is the pore radius,
 ${\ell }$ is the pore array centre-to-centre distance and
 $\phi =3+(Re_{pore}-Re_{pore}^T)/{\rm \pi}$ is a term representing the inertial effects. The term
 $Re_{pore}^T$ is a parameter representing the transition between the inertia-less and inertial regime in the pore: Jensen et al. (Reference Jensen, Valente and Stone2014b) obtained a value of
 $Re_{pore}^T=4$ by fitting from experimental data. In addition,
 $G$ is a coefficient that represents the effect of the pore arrangement on the membrane (for a square array of pores, the authors suggest
 $G=1.9$) and
 $Re_{pore}=\rho \hat {u} a / \mu$ (
 $\hat {u}$ is the pore average velocity). Non-dimensionalizing (D1) with the inner scales, we get
 \begin{equation} \frac{q}{\Delta p}=\frac{a^3}{3\left[ \dfrac{8}{3{\rm \pi}}\dfrac{t}{a} -1.9 (a)^3 + \dfrac{\phi(Re_{pore})}{3}\right]}. \end{equation}
As a matter of fact,  $q/\Delta p=a^3/\phi (Re_{pore})$ is the classic Darcy permeability term which, in our work, corresponds to
 $\bar {M}_{nn}$. The parameters for the constant advection closure model (2.20) in this case are
 $Re_{pore}=(a)Re_{\ell }$ and
 $U=(1,0,0)$ (pure normal advection). The considered pore has a non-dimensional radius
 $a=0.25$ and non-dimensional thickness
 $t=a/2$ (see geometry in figure 33
 $a$). A comparison between the model of Jensen et al. (Reference Jensen, Valente and Stone2014b) and our result is reported in figure 33(
 $a$) for a square array of pores in terms of permeability. Additionally, we isolate the effect of inertia by considering
 $\phi (Re_{pore})-\phi (Re_{pore}=0)$ in figure 33(b). To compute this term from
 $\bar {M}_{nn}$ and without any fitting coefficient, we start from (21) of Jensen et al. (Reference Jensen, Valente and Stone2014b) and non-dimensionalize, obtaining
 \begin{equation} \phi^{CA}(Re_{pore})= \frac{a^3}{\bar{M}_{nn}(Re_{pore})}. \end{equation}
Jensen et al. (Reference Jensen, Valente and Stone2014b) suggested that the effect of inertia  $\phi$ in a pure normal flow can be modelled as a linear function of the pore Reynolds number of slope
 $1/{\rm \pi}$ in the inertial regime (i.e.
 $Re_{pore}>Re_{pore}^T=4$), which well agrees with our predictions. Furthermore, the comparison with the experimental data of Johansen (Reference Johansen1930) in figure 33(b) depicts a good agreement also in terms of actual values of
 $\phi$. We conclude by noting that our model is also able to capture the smooth transition from the Stokes regime to the inertial one.
( $a$) Permeability coefficient and (
 $b$) inertial coefficient
 $\phi$ as a function of the pore Reynolds number
 $Re_{pore}$. We compare the theoretical prediction obtained using (D2) (black), the constant advection closure model (blue) and the experimental data of Johansen (Reference Johansen1930) (magenta). The inset in panel (
 $a$) shows the pore geometry.


 Open access

