
Introduction
The availability of potable water for the sustainability of humans has become a global challenge.[Reference Jamalludin, Harun, Hubadillah, Bari, Ismail, Othman, Shohur and Yunos1] While the shortage of water in the arid region motivates stringent use of water and various recycling strategies, many regions with the abundance of natural waters are daily threatened with pollution challenges. Humic acid (HA) represents a fraction of natural organic matter that contests the availability of suitable water for the production of potable water.[Reference Kawasaki, Matsushige, Komatsu, Kohzu, Nara, Ogishi, Yahata, Mikami, Goto and Imai2] It emanates from the decomposition of biological materials found in water, soil, peat, or sediments.[Reference Jamalludin, Harun, Hubadillah, Bari, Ismail, Othman, Shohur and Yunos1,Reference Qin, Liu, Wang and Weng3] Its heterogeneous structure exhibits many functional groups such as those of carboxylic acids, proteins, phenolics, alcohols, thiols, and amines. The presence of these groups enables HA to act as a complexing agent for heavy metals and an aggregation site for organic pollutants. In water treatment plants, HA interacts with chlorine during water disinfection forming carcinogenic trichloromethane.[Reference Ma, Chen, Liu, Wu, He and Wang4,Reference Basumallick and Santra5] Thus, continuous monitoring of levels of HA in water is highly essential to ensure sustainable health and environmental safety.
Due to the complex nature of HA, characterization and quantification have involved the utility of chromatographic techniques coupled with ultraviolet–visible spectrophotometry (UV–Vis) detection.[Reference Qin, Liu, Wang and Weng3] However, other methods such as fluorospectrophotometry,[Reference Basumallick and Santra5] ash-free gravimetry,[Reference Lamar, Daniel, Lawrence and Paul6] infrared spectroscopy,[Reference Kawasaki, Matsushige, Komatsu, Kohzu, Nara, Ogishi, Yahata, Mikami, Goto and Imai2] and total organic carbon analysis[Reference Rodrigues, Brito, Janknecht, Proenca and Nogueira7] have also been used for the quantification of HA in aqueous environments. Nonetheless, among these techniques, UV–Vis has the advantage of a simple procedure, provision of absorption data in the ultraviolet and visible region and relatively lower cost.[Reference Yuan, Yang, Fang, Wang, Ma, Wang, Wang and Zhao8]
Metal materials have been employed as sensors for various organic and inorganic pollutants[Reference Azzouz, Goud, Raza, Ballesteros, Lee, Hong, Deep and Kim9–Reference Gan, Wang, Gao, Sun, Wu and Wang11] due to their intrinsic properties such as high redox activities, electrical conductivity, complexation, and surface catalysis. Among the metal family, transition metal oxides have attracted considerable attention due to their ease of fabrication, relatively high surface area, excellent adsorption, catalysis, photochemical reactions, and tunable magnetic properties.[Reference Fakayode, Songca and Oluwafemi12–Reference Manisha, Priya Swetha, Shim and Prasad16] Among the transition metal oxides, copper (I) oxide is currently attracting great attention due to its excellent electronic, low semiconducting band gap, visible light/solar energy absorption, photocatalysis, and electrochemical properties.[Reference Manisha, Priya Swetha, Shim and Prasad16–Reference Kerour, Boudjadar, Bourzami and Allouche19] In addition, Cu (I) materials tend to be more embraced in the future due to their low toxicity, biocompatibility, simple low-cost syntheses, tunable morphologies, and the relatively availability of their raw materials.
The detection of pollutants at low levels in water is highly essential since at these concentrations, many pollutants may escape the typical removal strategies such as precipitation or flocculation. In this paper, a colloidal Cu2O solution (CCS) was used as a sensor to detect low-level HA in aqueous solution. The effectiveness of the utility of the as-synthesized sensor for the detection of HA in water was evaluated and the results were compared with some existing literature reports.
Materials and methods
Synthesis of the Cu2O sensor
Solution of CuCl2·2H2O (10 mL, 0.01 M) was added to 10 mL of a solution containing equal volumes of 1:1.25 molar ratio of α-(d)-glucose and NaOH to obtain a spontaneous deep blue solution which was left under ambient condition [room temperature (RT) = 22 °C] until a peach-pink colloidal solution was obtained (about 35 h). To monitor the synthesis pathway of the Cu2O sensor, 4 mL of the initial blue complex solution was subjected to UV–Vis analysis every 5 min up to 2 h between 200 and 800 nm. For storage purpose, the peach-pink solution was dried under ambient condition (RT = 22 °C) to obtain a light yellow viscous material, which was stored until further analysis.
Characterization
The as-synthesized Cu2O sensor was characterized using UV–Vis spectrophotometry (Perkin Elmer UV–Vis Lambda 650s Spectrometer, Germany; 2 nm slit width), Fourier transform infrared spectroscopy [FTIR; Universal Frontiers (UATR) spectrometer; Perkin Elmer, Germany], energy dispersive X-ray spectroscopy (EDX, Oxford), and scanning electron microscopy (SEM; JEOL, JEM 2100, Japan). The FTIR ATR diamond sample holder was precleaned with 50% ethanol and dried before sample analysis. For SEM analysis, each sample was placed on a black plastic tape, followed by coating with gold (5 nm, 19.32 g/cm3) before analysis. The EDX's map images and point and ID spectra were obtained using the same samples used for the SEM analysis.
Sensing HA with the Cu2O sensor
Micropipette measured solution of the Cu2O sensor (3 mL, absorbance = 0.1962) was mixed with successive volume of HA in phosphate buffer (pH 7) (0, 10, 20, 30, 40, 50, 60 and 70 µL) to obtain corresponding concentrations of 0, 0.0598, 0.1192, 0.1782, 0.2368, 0.2951, 0.3529 and 0.4104 mg/L. The resulting solution after each addition was analyzed using UV–Vis spectrophotometry at 494 nm.
Results and discussion
Synthesis of the Cu2O sensor
The initial interaction of the glucose solution with Cu (II) salt precursor produced an instantaneous deep blue complex solution (ʎ max = 642 nm) which turned turbid green, yellow, red-orange, and then peach-pink after some succession times. Figures 1(a)–1(f) show the pathway for obtaining the peach-pink Cu2O colloidal solution sensor.
UV–Vis monitoring of the synthesis pathway of the Cu2O sensor. (a) 0–35 min; (b) 35–50 min; (c) 50–65 min; (d) 65–90 min; (e) 90–120 min; and (f) 0 min, 120 min and 35 h.

According to Fig. 1(a), the deep blue Cu2+ complex solution (band peak at 642 nm) was stable within the first 10 min of the reaction. This could be another potential for rapid sensing application. However, beyond this time, at 15 min, a blueshift was observed with the formation of a new band (peak = 510 nm, green color region), denoting the breaking down of the larger particles into smaller ones. At 20 min, a redshift was observed relative to the 510 nm peak together with the formation of two bands at 513 and 598 nm, respectively (still green region). Moreover, a new peak emerged at 455 nm alongside with two other peaks at 547 and 652 nm, respectively, between 25 and 50 min (yellow color region). A progressive increase in the absorbance, coupled with a bathochromic shift trend, was observed for all peaks within these periods [Figs. 1(a)–1(c)]. The redshift observed within these periods indicated the interaction of the smaller particles to form larger particles, typically an Ostwald ripening characteristics. However, between 50 and 65 min, while the absorbance of the larger particles at 583 and 698 nm decreased relative to time, the absorbance of the smaller particles at 479 nm increased. This implied that some larger particles were being converted to smaller particles while others precipitated out of the solution. Precipitation of the larger particles (aggregates) occurred continuously between 65 and 120 min (red-orange region) as evident by the decrease in the absorbance of all peaks relative to time, except between 85 and 90 min where absorbance increased as the band red-shifted from 523 to 537 nm [Figs. 1(d) and 1(e)]. However, after a long aging period, at 35 h, the peach-pink Cu2O band's peak emerged and became dominant at 494 nm with respect to other peaks at 545 and 636 nm [Fig. 1(f)]. This means that at 35 h, most of the bigger particles had precipitated out of the solution while the smaller particles were comfortably dispersed in the solution. According to Zhu et al., the colloidal solution of Cu2O exhibited visible absorption band peaks between 490 and 800 nm depending on the morphology of the metallic oxide.[Reference Zhu, Li and Jiang18] In this study, the peach-pink colloidal Cu2O sensor absorption's ʎ max was at 494 nm, suggesting an exhibition of a spherical morphology.[Reference Zhu, Li and Jiang18] Also, a pink solution typically shows an absorption band between 490 and 600 nm, indicating an agreement of the current findings with some literature reports.[Reference Fakayode, Tsolekile, Songca and Oluwafemi20,Reference Kumar and Ganesan21] From the mechanistic point of view, the dispersed Cu2O colloids (peak at 494 nm) might be stabilized by a carboxylic acid, e.g., gluconic acid (or corresponding conjugate ion) generated from the oxidation of glucose during the interaction of the latter with Cu2+ ion in the alkaline solution[Reference Novotný, Cejpek and Velíšek22,Reference Paucean, Vodnar, Muresan, Fetea, Ranga, Man, Muste and Socaciu23] [Eqs. (1)–(5)].
 $$\eqalign{{\rm C}_6{\rm H}_{12}{\rm O}_{6{\rm (aq)}} + {\rm O}{\rm H}^-_{{\rm (aq)}} & \to {\rm RCOO}{\rm H}_{{\rm (aq)}} \cr & \rlarr {\rm RCO}{\rm O}^-_{{\rm (aq)}} + {\rm H}^ + _{{\rm (aq)}}}$$
 $$\matrix{ {{n\rm RCO}{\rm O}^- + {\lsqb {{\rm Cu}{\lpar {{\rm H}_2{\rm O}} \rpar }_{n}} \rsqb }^{2 +} _{{\rm (aq)}} + {\rm O}{\rm H}^-\;} \cr {\lpar {{\rm Light\ blue}} \rpar } \cr} \to \matrix{ {{\lsqb {{\rm Cu}{\lpar {{\rm RCO}{\rm O}^-} \rpar }_{n}{\lpar {{\rm O}{\rm H}^-} \rpar }_{x}} \rsqb }^{\lpar {{n} + {x}} \rpar -2}_{{\rm (aq)}}} \cr {({\rm Deep}\hbox{-}{\rm blue}\,{\rm complex)\;}} \cr} \to \matrix{ {{\rm C}{\rm u}^ + + {\rm C}{\rm u}^{2 +} + {n \rm RCO}{\rm O}^- + {\rm O}{\rm H}^-} \cr {\lpar {{\rm Green}} \rpar } \cr} $$
 $$2{\rm C}{\rm u}^ + + {\rm O}{\rm H}^-_{{\rm (aq)}} \; \to \matrix{ {2{\rm C}{\rm u}^ + {\rm O}{\rm H}^-_{{\rm (aq)}}} \cr {\lpar {{\rm Yellow}} \rpar } \cr} \to \matrix{ {{\rm C}{\rm u}_2{\rm O}_{{\rm (aq)}} + {\rm H}_2{\rm O}} \cr {\lpar {{\rm Red}\hbox{-}{\rm orange}} \rpar } \cr} \; $$
 $$\matrix{ {{\rm C}{\rm u}_2{\rm O}_{{\rm (aq)}}} \cr {\lpar {{\rm Red}\hbox{-}{\rm orange}} \rpar } \cr} \rlarr \matrix{ {{\rm C}{\rm u}_2{\rm O}_{{\rm (s)}}\downarrow \lpar {{\rm precipitated}} \rpar } \cr {\lpar {{\rm Red}\hbox{-}{\rm orange}} \rpar } \cr} $$
 $$\eqalign{{n \rm RCO}{\rm O}^-_{{\rm (aq)}} + {\rm C}{\rm u}_2{\rm O}_{{\rm (aq)}}\to \matrix{ {[{\rm C}{\rm u}^ + {\lpar {{\rm RCO}{\rm O}^-)_{n}} \rsqb }^{n-3}{\rm O}^{2-}_{{\rm (aq)}} \ \lpar{{\rm stabilized}} \rpar } \cr {\lpar {{\rm peach}\hbox{-}{\rm pink}\,{\rm supernatant} = {\rm sensor}} \rpar } \cr}} $$
The utility of carboxylic acids as excellent stability agents for nanomaterials had been previously reported.[Reference Fakayode, Songca and Oluwafemi12,Reference Cheraghipour, Javadpour and Mehdizadeh24] According to [Eqs. (1) and (2)], the carboxylic acid generated from the alkaline glucose solution converted the light blue aqua complex of Cu2+ ion to a deep-blue Cu2+- carboxylate complex via a ligand exchange process. However, as the solution became more electron-rich through the formation of more carboxylate ions, the deep-blue complex was converted to a green complex via the formation of a new complex (e.g., [CuCl4]2−) coupled with the reduction of Cu2+ ion to Cu+ ion [Eq. (2)]. The later interacted with the hydroxide ion forming an unstable yellow CuOH which dehydrated to form Cu2O nuclei which grew and after reaching supersaturation state, precipitated as a red-orange Cu2O [Eqs. (3) and (4)]. This explained the observation recorded in Figs. 1(b) and 1(c), between 35 and 65 min, where the absorbance of the peak at 455 nm was seen growing, alongside with a bathochromic shift until it reached a maximum, after which it decreased with time. After precipitation, the remaining non-precipitated Cu2O particles were stabilized by the carboxylate ion generated within the solution matrix [Eq. (5)] [Fig. 1(f) at 35 h].
Characterization of the Cu2O sensor
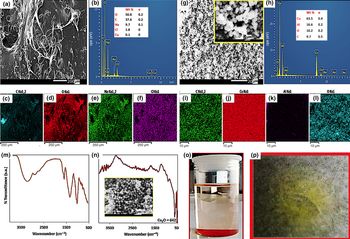
The results of the SEM and the EDX's analyses (point and ID and surface map) of the dried Cu2O sensor and its precipitated counterpart are given in Figs. 2(a)–2(l), respectively. According to Figs. 2(a)–2(f), the dried sensor exhibited a porous surface containing O, C, Na, Cl, and Cu at 50.8, 37.6, 9.7, 1.8, and 0.1% by wt., respectively [Figs. 2(a) and 2(b)]. In contrast, the precipitated red-orange Cu2O showed an imperfect spherical crystalline morphology [partially trauncated cube, insets of Figs. 2(g) and 2(n)] containing Cu, O, C, and Al at 63.5, 10.2, 9.7, and 16.6 wt.%, respectively. The presence of carbon in the latter originated from the adsorption of some carboxylic acid molecules on the surface of the Cu2O, while the Al sourced from the adsorbed dust particles as shown from the map analysis [Figs. 2(i)–2(k)]. The low percentage of Cu in the sensor in comparison to that of the precipitate may be as a result of the fact that a larger amount of the Cu2O precipitated out of the solution at the end of the synthesis (35 h), leaving a smaller amount to dispersed in the solution [Figs. 1(c)–1(f)].
Characterization of the dried Cu2O sensor and the precipitated Cu2O. Cu2O sensor: (a) SEM image; (b) EDX point and ID; (c–f) EDX map analysis. Precipitated Cu2O: (g) SEM image; (h) EDX point and ID; (i–l) EDX map analysis; (m) FTIR of the Cu2O sensor; (n) FTIR of the precipitated Cu2O; (o) digital image of the Cu2O sensor (supernatant) and its precipitate; (p) digital image of the dried Cu2O sensor. Resolutions: 200 µm (a), 20 µm (g); 2 µm [inset of (g,n)].

The result from the FTIR analysis revealed the presence of a carboxylic acid O–Hstr, C–Hstr, deformed C=Ostr, C–Hrock, and C–Ostr at 3734–2385, (3000, 2931), 1608, 1360, and 1034 cm−1, respectively. The existence of the deformed C=Ostr indicated the presence of a carbonyl group's stabilization of a metallic ion as proposed in Eq. (5). The presence of Cu2O [Eqs. (4) and (5)] was not distinctly seen on the spectrum of the sensor [Fig. 2(m)] as compared to the spectrum of the precipitated red-orange Cu2O which showed a clearly distinct sharp narrow band peak at 642 cm−1 [Figs. 2(m) and 2(n)].[Reference Balık, Bulut and Erdogan17,Reference Kerour, Boudjadar, Bourzami and Allouche19] This was in agreement with the results of the EDX's surface map analysis [Figs. 2(c)–2(f)]. Although the FTIR analysis of the dried sensor was unable to reveal the presence of Cu2O, evidence from the UV–Vis absorption of the aqueous solution of the sensor material at 494 nm [Fig. 1(f)] did confirm the presence of Cu2O.[Reference Zhu, Li and Jiang18,Reference Kerour, Boudjadar, Bourzami and Allouche19]
Sensing of HA
The results of the quantification of HA in phosphate buffer solution (pH 7) are given in Figs. 3(a)–3(d). According to Figs. 3(a) and 3(b), the absorbance of the Cu2O sensor decreased with an increasing amount of HA with a good linear relationship over a concentration range of 0–0.41 mg/L at 494 nm.
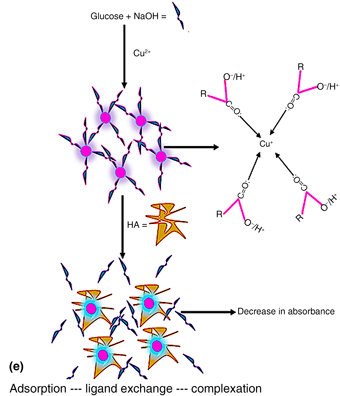
UV–Vis quantification of HA in phosphate buffer solution (pH 7) using the Cu2O sensor. (a and b) Measurement at 494 nm; (c and d) measurement at 466 nm; and (e) schematic diagram of the proposed mechanism of the detection of HA by the Cu2O sensor.

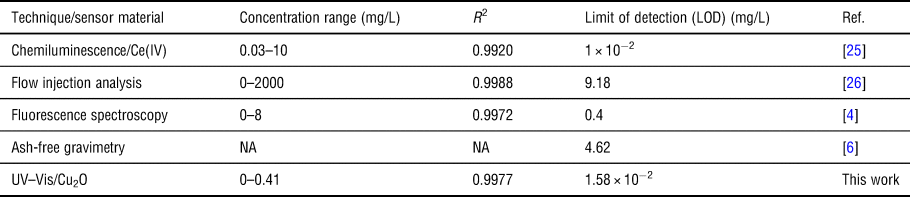
Also, the band peak at 466 nm showed a good linearity over this range, but the linearity was not as excellent as that of 494 nm peak [Figs. 3(c) and 3(d)]. Thus, the detection limit was estimated using the calibration plots at 494 nm and was found to be 1.58 × 10⁻² mg/L. This LOD was found to be better than some literature reports as shown in Table I.
Comparison of the present work with some literature reports

NA, not available.
Although, as revealed from Table I, one technique exhibited a slightly lower detection limit than the current work, it is noteworthy to know that this technique required relatively multi-task steps that required more materials and equipments than the current work.
Mechanism of interaction
The proposed mechanism of the interaction between the peach-pink Cu2O colloidal sensor and HA in phosphate buffer solution (pH 7) is shown in Fig. 3(e). According to Fig. 3(e), the reduction of Cu2+ salts by the alkaline glucose solution resulted in a carbonyl-capped Cu+ ion complex which appeared as peach-pink colloids (the sensor). On interaction with HA, a ligand exchange possibly occurred, resulting in the decrease in the absorbance. Due to the heterogeneous nature of HA (exhibition of many functional groups, such as carboxylate, phenol, amino, hydroxyl, and thiol), a stronger complexing activity would be expected from HA towards binding to Cu+ ion relative to the binding of the carboxylate ion or its conjugate acid.
Moreover, the possibility of the adsorption of HA onto the surface of the sensor cannot be ruled out as organic pollutants are known to adhere to the surface of other organics (e.g., fouling of organic membranes)[Reference Jamalludin, Harun, Hubadillah, Bari, Ismail, Othman, Shohur and Yunos1, Reference Cui and Choo27–Reference Younas, Shao, He, Fatima, Jaffar and Afridi30] and inorganic materials (e.g., adsorption on ceramic membranes or metal-containing nanocomposites).[Reference Younas, Shao, He, Fatima, Jaffar and Afridi30] This adsorption may increase the rate of ligand exchange and complexation between the HA and the sensor, thus making the detection more feasible and the rate of detection faster.
Conclusion
A carboxylic acid-stabilized Cu2O colloidal sensor was successfully synthesized, characterized, and applied for the detection of HA in aqueous solution. The metallic oxide sensor was found to be embedded within a membrane-like structure and its corresponding precipitate exhibited nearly spherical morphology. The estimated detection limit of 1.58 × 10⁻² mg/L associated with the sensor was found to be better than some literature reports. The as-synthesized sensor exhibited potential for the development of an optical sensor for the rapid quantification of low-level HA in aqueous environments. This sensor may find useful application in water treatment plants where the presence of HA is undesirable. Also, the sensor's precipitate (red-orange Cu2O) may be used as a heterogenous photochemical agent for the degradation of HA or other related organic acid pollutants in water.
Acknowledgments
The authors are grateful to the Nanotechnology and Water Sustainability Research Unit (NanoWS) of the University of South Africa (UNISA) for the resource and financial supports.