

INTRODUCTION
Their educational and cultural mission aside, many cultural organizations have been forced to adopt business management models that will allow them to face up to an ever-more complex economic and competitive context. Many of these organizations are aware that only by implementing efficient business management systems that will enable them to become self-financing or by merging different models for securing resources will they be able to ensure their survival. In this context, the literature on cultural organizations has underscored the relevance of analyzing financial vulnerability (Hager, Reference Hager2001), funding mechanisms (Hughes & Luksetich, Reference Hughes and Luksetich2004; Kim & Van Ryzin, Reference Kim and Van Ryzin2014), or the different factors that contribute to public attendance, funding and performance, such as technology and accountability (Rentschler & Potter, Reference Rentschler and Potter1996), market orientation (Gainer & Padanyi, Reference Gainer and Padanyi2002), technological and organizational innovation (Camarero & Garrido, Reference Camarero and Garrido2008) or reputation (Ebbers & Wijnberg, Reference Ebbers and Wijnberg2012).
One key factor in the development of innovations and access to resources is the organization’s social capital (Tsai & Ghoshal, Reference Tsai and Ghoshal1998; Landry, Amara, & Lamari, Reference Landry, Amara and Lamari2001, Reference Landry, Amara and Lamari2002). This is built at internal – strong and mutually beneficial relationships between the company’s employees and teams – and external levels – the organization’s relationships with other stakeholders. In addition to external and internal social capital, organizations also need managers who put their own social resources and social capital at the service of said organizations. The relationship aspect of managers is an indication of the role they play crossing structural holes. Said structural holes reflect those positions in the network which, if are occupied by a network’s member, provide a link between individuals who would otherwise not be in touch with one another (Granovetter, Reference Granovetter1973; Burt, Reference Burt1992; McEvily & Zaheer, Reference McEvily and Zaheer1999). Publications such as Forbes (2013, 2014) point to how managers’ social capital contributes to their reputation as an upstanding person who is skilled in his/her field. Proof of the importance of managers’ social capital is the emphasis in the LinkedIn profile or professionals’ Klout Score, measuring a person’s level of influence in social networks.
In this context, the current paper seeks to analyze the influence of both internal and managers’ social capital on external social capital and its impact on cultural organizations, specifically on museum innovation and economic performance. Although various authors have concurred in pointing out the necessary relation between social capital, innovation and performance in for-profit organizations (Tsai & Ghoshal, Reference Tsai and Ghoshal1998; Wu, Chang, & Chen, Reference Wu, Chang and Chen2008; Alguezaui & Filieri, Reference Alguezaui and Filieri2010), such relations are yet to be evidenced in the case of nonprofits and more concretely for cultural organizations. Specifically, this research pursues the following objectives: (1) to analyze the role played by the organization’s internal social capital and the manager’s social capital as a bridging tie in the formation of external social capital; and (2) to explore the influence of the various dimensions of social capital on innovation and performance measured in terms of museums’ fundraising capacity as well as their image and prestige.
Our work thus contributes to the literature on social capital, positing the interrelationships between the specific levels encompassed therein (internal, external, and individual social capital), and their application to the case of cultural organizations. Although the literature has underpinned the existence of individual social capital as opposed to collective social capital, and despite the interrelation having been theoretically evidenced, no studies have as yet explored the interrelation between the two. According to the network theory (Granovetter, Reference Granovetter1973; Burt, Reference Burt1992), individuals who are better connected can obtain benefits by engaging in brokerage between disconnected groups. For its part, the social capital theory (Coleman, Reference Coleman1988) contends that certain characteristics of a network, such as cohesion, have positive effects for all their members, as dense networks favor the exchange of valuable resources and cooperation aimed at reaching common objectives. Finally, the authors of the relationship marketing approach (Morgan & Hunt, Reference Morgan and Hunt1994), focus on the ability of the organization’s management to administer the relationships between the various groups (internal and external) in order to achieve the organization’s goals. Considering these theoretical frameworks, the present work conducts a joint empirical analysis of the different relationship networks related to an organization (a museum), such as internal, external and curator’s networks, and their link to the organization’s performance in terms of innovation. Therefore, our work contributes to the study of cultural organizations by adopting the social capital and social network theories as a main approach to interpret how museums react to turbulent times and attempt to achieve innovation, reputation and funding through social capital.
In addition, we adopt an international approach by considering museums from several countries (France, Germany, Spain, the United Kingdom, and the United States) that represent different managerial styles and different traditions in their funding policy: the continental Europe model and the Anglo-American model. The continental Europe model is characterized by the high degree of public involvement in the running of cultural institutions with museums proving more reluctant to embrace private funding, whereas governments in the Anglo-American model are non-interventionist and the creation of private museums and foundations is more common (Bohlen, Reference Bohlen2015). Although the distinction between the two models is beginning to disappear, major differences are still evident between various museums’ capacity to innovate (Bakhshi & Throsby, Reference Bakhshi and Throsby2010).
SOCIAL CAPITAL: CONCEPT, DIMENSIONS AND LEVELS OF ANALYSIS
Social capital is a theoretical body embracing contributions from various branches of social sciences (Adler & Kwon, Reference Adler and Kwon2002) in an effort to explain how social networks might act as real capital, in the sense of providing an array of benefits (economic, personal, and professional status, etc.). The many and varied theoretical approaches to address the issue have spawned a wide range of proposals concerning the definition of social capital (Burt, Reference Burt2000; Adler & Kwon, Reference Adler and Kwon2002; Vargas, Reference Vargas2002), its antecedents and consequences (Gedajlovic, Honing, Moore, Payne, & Wright, Reference Gedajlovic, Honing, Moore, Payne and Wright2013) as well as its various dimensions and how these may be measured (Woolcock, Reference Woolcock1998; Narayan & Cassidy, Reference Narayan and Cassidy2001; Chetty & Agndal, Reference Chetty and Agndal2007). All the definitions of social capital do, however, make some mention of relationship networks, the resources they contain, or both (Payne, Moore, Griffis, & Autry, Reference Payne, Moore, Griffis and Autry2011). In the present work, we assume social capital to encompass an individual’s or a group of individuals’ network of relations and the resources contained in the network or which may be accessed through it (Nahapiet & Ghoshal, Reference Nahapiet and Ghoshal1998; Batjargal, Reference Batjargal2003; Galán & Castro, Reference Galán and Castro2004).
With regard to levels of analysis, Payne et al. (Reference Payne, Moore, Griffis and Autry2011) conclude that social capital may be analyzed at either an individual (an individual’s social capital) or a collective (the social capital of a group, a community or an organization) level. Individual social capital and group social capital follow their own dynamics vis-à-vis antecedents and results, although they may interrelate (Portes, Reference Portes1998; Woolcock, Reference Woolcock1998). In the case of an organization, the various levels of social capital co-exist, as each member of the organization has their own individual social capital (based on their own relations), whereas the organization possesses group social capital. Broadly speaking, the accumulation of individual social capital among the organization’s members is assumed to benefit the creation of group social capital, although the latter is not merely the sum of all the former but the result of social interaction between the individuals within the organization (Leana & Van Buren, Reference Leana and Van Buren1999).
Following Payne et al. (Reference Payne, Moore, Griffis and Autry2011), within group social capital a distinction may be drawn between internal social capital and external social capital. Such a distinction of the agents involved in the social capital bears a close resemblance to social capital mechanisms, that is, the notions of social capital bonding and social capital bridging, respectively (Adler and Kwon, Reference Adler and Kwon2002; Chetty & Agndal, Reference Chetty and Agndal2007).
Internal social capital is that which is established among the members of the organization (Yli-Renko, Autio, & Tontti, Reference Yli-Renko, Autio and Tontti2002; Chetty & Agndal, Reference Chetty and Agndal2007) and is related with so-called bonding social capital. This view of social capital focuses on collective actors’ internal characteristics (Adler & Kwon, Reference Adler and Kwon2002), specifically cohesiveness or closure (Burt, Reference Burt2000; Galán & Castro, Reference Galán and Castro2004). A dense network is one whose members are strongly interconnected through close ties and who share a collective conscience (Coleman, Reference Coleman1988; Burt, Reference Burt2000; Stone & Hughes, Reference Stone and Hughes2002; Galán & Castro, Reference Galán and Castro2004). Other authors also include member diversity and heterogeneity as further relevant features of groups (Burt, Reference Burt1992; Yli-Renko, Autio, & Tontti, Reference Yli-Renko, Autio and Tontti2002; Galán & Castro, Reference Galán and Castro2004). A network will prove to be more varied the more diverse its members in socio-economic, cultural, and ethnical terms, etc. (Lin, Reference Lin1999; Stone & Hughes, Reference Stone and Hughes2002; Batjargal, Reference Batjargal2003).
External social capital refers to the organization’s links with external actors (Adler & Kwon, Reference Adler and Kwon2002; Yli-Renko, Autio, & Tontti, Reference Yli-Renko, Autio and Tontti2002). According to Adler and Kwon (Reference Adler and Kwon2002), it is a resource located in the external linkages of a focal actor, in other words, bridging social capital. The ties that make up a network of relations might be strong or weak depending on how close and long-lasting the relations on which said network is based prove to be (Granovetter, Reference Granovetter1973; Burt, Reference Burt1992).
Through authors such as Woolcock (Reference Woolcock2001) and Grootaert, Narayan, Nyhan-Jones, and Woolcock (Reference Grootaert, Narayan, Nyhan-Jones and Woolcock2003), the World Bank adds a third notion to the concepts of social capital bonding and bridging: namely, that of social capital linking, related to networks which are able to establish relations with powerful groups or individuals who are very often at levels which social capital bridging and of course bonding (Stone & Hughes, Reference Stone and Hughes2002) cannot access easily. Social capital linking is closely related to Granovetter’s (Reference Granovetter1973) notion of weak ties and bridges, Burt’s (Reference Burt1992, Reference Burt2004) notions of structural holes and brokerage, and McEvily and Zaheer’s (Reference McEvily and Zaheer1999) notion of bridging tie. A structural hole is an absence of links between two separate groups. An individual who occupies the position of a structural hole (bridging tie) is able to link two groups that would not otherwise be connected. Said individual can control the flow of resources between these groups and can also benefit from such intermediation (brokerage).
Finally, although the literature has traditionally focused on the idea that social capital provides access to resources, Klyver and Schenkel (Reference Klyver and Schenkel2013) state that it is necessary to provide a realistic sense of how capital resources interact (Semrau & Hopp, Reference Semrau and Hopp2016) and how they are combined and used. Therefore, the accessed resources might prove complementary, substitutive or neutral.
SOCIAL CAPITAL IN MUSEUMS
Museums are organizations committed to several agents, such that they are supposed to develop sustainable relationships with all of them in order to access resources and achieve key objectives. In other words, they are expected to build and maintain social capital. The list of stakeholders is long: audiences, donors, sponsors, local or national government, staff, other museums and cultural institutions, the media, and, in general terms, the society in which they are embedded (McLean, Reference McLean1997). In line with their mission, museums must remain close to the public and to society in order to become places where culture is disseminated (Bradburne, Reference Bradburne2001). Maintaining close ties with visitors can only be achieved if it goes hand in hand with a strategy of close relations with the administrators, donors, and sponsors who can ensure long-term financial sustainability. In fact, their financial dependence on other institutions means that museums must be able to convey trust to those who fund them. Similarly, relationships with other museums, associations, and cultural institutions, are key to accessing new ideas, trends, exhibitions, strategies, etc.
The need to draw on social capital in museum management has already been highlighted in some of the world’s leading museums. As for the relationship with visitors, art museums are experimenting with new ways to cultivate a closer relationship with the public (Olson, Reference Olson2013). Museums are engaging in innovating their cultural proposals in an effort to attract visitors, enhance their image and reputation and to design new mechanisms to raise funds through donors and sponsors or via crowdfunding. For instance, the Louvre recently raised €1 million from small contributors to acquire the unique jewel-incrusted 18th-century Teschen table from its private owners (Bohlen, Reference Bohlen2015). Yet, not all museums are equally successful in their efforts. With regard to relationships with sponsors, this is particularly evident in the major American museums. According to the New York Times (Bohlen, Reference Bohlen2015), ‘in the United States, museums have long courted sponsors who have in turn benefited from shows devoted to their creations. The Guggenheim Museum was a forerunner in the late 1990s, with exhibits featuring clothes by the designer Giorgio Armani and motorcycles by BMW.’ Likewise, the relationship with other museums is crucial. The curators of the Prado Museum and the Reina Sofia museum in Spain explain that they network with other institutions as this enables them to exchange exhibitions, as well as coproduce or undertake traveling exhibitions (El Pais, 2012).
However, few works have explored the impact of social capital on museums or in cultural organizations. For instance, Meiseberg and Ehrmann (Reference Meiseberg and Ehrmann2013) evaluate the influence of internal social capital and team diversity on the creation of successful intercultural motion pictures; Mendes-Da-Silva, Rossoni, Conte, Gattaz, and Francisco (Reference Mendes-Da-Silva, Rossoni, Conte, Gattaz and Francisco2016) analyze the internal and external social capital of crowdfunding communities, and Delmestri, Montanari, and Usai (Reference Delmestri, Montanari and Usai2005) posit the relevance of a director’s connections in the commercial success of a film.
Given this context, the present work proposes three dimensions of museums’ social capital: internal social capital, external social capital, and managers’ social capital (Table 1).
Levels of analysis of museum’s social capital

We describe a museum’s internal social capital through the cohesion and diversity present among its workers and managers. Thus, internal social capital is studied at a group level, as its subject of study is the whole set of relationships between the museum’s members.
External social capital includes museums’ relations with stakeholders: visitors and current audience, friends of the museum associations, volunteers, artists, other national and overseas museums, individual donors, corporate donors and politicians. Consequently, a museum’s external social capital can be described in terms of the strength of the museum’s relationships with stakeholders. As it involves assets and resources made available to the group (the museum) through network ties (Payne et al., Reference Payne, Moore, Griffis and Autry2011), it is considered collective social capital.
Finally, a bridging tie is a link that crosses a structural hole and thus connects two separate groups. In the case of museums, it is the manager or curator who is mainly charged with playing the role of a bridging tie that connects private social capital with the museum. Therefore, it is individual social capital through which both the individual (the manager) and the group (the museum) can draw benefit (Payne et al., Reference Payne, Moore, Griffis and Autry2011). Although both, the manager’s social capital and the museum’s external social capital, are bridging ties, as they refer to links with external actors, the difference depends on the owner. While the manager’s social capital is private, the museum’s external social capital is a collective resource, owned by the whole organization, although it may come from different sources, including both present and former members’ private social capital.
We will analyze whether the social capital a museum acquires from different sources (internal, external and bridging ties) exerts differential effects on innovation and performance. Innovation is related to organizing new exhibitions and to offering cultural activities from other artistic domains, such that the novelty resides in merging different cultural experiences (theater, music, movies, literature, fashion, dance, etc.). As regards performance, we focus on two aspects of museums’ economic performance: reputation and incomes. On the one hand, reputation consists of a sum of intangibles based on the perception of product and/or service quality, sustainability, social responsibility, a positive image, honesty and good governance. On the other hand, the need for funding, mainly when public financial support has decreased, entails engaging donors and sponsors in backing museums’ activities, as well as the need for the museum to increase its own commercial revenues.
BUILDING EXTERNAL SOCIAL CAPITAL
The link between internal social capital and external social capital
As pointed out previously, social capital is considered a type of capital as it generates benefits for the individuals or groups that possess it (Kliksberg, Reference Kliksberg1999; Adler & Kwon, Reference Adler and Kwon2002). In the case of so-called bonding social capital, said benefit is reflected through individuals’ motivation and capacity to convey tacit and redundant knowledge (Adler & Kwon, Reference Adler and Kwon2002). The existence of this kind of social capital enables organizations to design an internal network of relations that can bind together the activities undertaken by the various groups of individuals that make up the network. Thus, having internal social capital or bonding available would entail direct benefits in the shape of greater complementarity between organizational resources, use of synergies between its components, lower opportunistic behaviors, greater effectiveness and efficiency in coordinating and controlling internal actions, and cutting internal transaction costs, etc. (Coleman, Reference Coleman1988, Reference Coleman1990; Butler & Purchase, Reference Butler and Purchase2008). Such benefits might also be reflected in access to new networks (Granovetter, Reference Granovetter1973; Burt, Reference Burt2004) and greater access to other stakeholders’ external resources (Gabbay & Zuckerman, Reference Gabbay and Zuckerman1998; Foley & Edwards, Reference Foley and Edwards1999). Organizations need to combine bonding and bridging social capital if they are to obtain benefits from their networks (Edelman, Bresnen, Newell, Scarbrough, & Swan, Reference Edelman, Bresnen, Newell, Scarbrough and Swan2004). Newell, Tansley, and Huang (Reference Newell, Tansley and Huang2004) argue that an organization needs to create strong social capital bonds between its members, before mobilizing their individuals’ social capital bridging ties. In other words, bonding social capital is needed to create an atmosphere of trust in which the members of the organization are willing to share their private relationships with the whole organization in order to create collective external social capital. In this vein, Gedajlovic and Carney (Reference Gedajlovic and Carney2010) state that the features of family businesses (such as cohesion, long-term focused relations and tie strength among members) make it more likely that individual resources (which would include the external relations of each individual in the network or individual social capital) would be made available to the group, thereby increasing the group’s links with other external actors (bridging social capital).
On the other hand, insofar as members of a network display varying profiles and careers (diversity), they are more likely to possess different resources and have access to a greater variety of external relations. There is empirical evidence concerning the link between human capital and access to network resources and the link between diversity and a network’s wealth in terms of resources and contacts (Lin, Reference Lin1999; Batjargal, Reference Batjargal2003). By making the private relationships available to the organization its members could be turning the sum of each member’s relations into the organization’s group social capital (Yli-Renko, Autio, & Tontti, Reference Yli-Renko, Autio and Tontti2002; Chen, Reference Chen2013). To sum up, in terms of access to external resources, diversity between museum members increases the chance of accessing different networks through these members, while a cohesive network of relationships between said members encourages them to exchange their resources with other members and with the museum itself, putting their private networks at the service of the group or organization. Therefore:
Hypothesis 1 : A museum’s internal social capital (cohesion – Hypothesis 1a and diversity – Hypothesis 1b) has a direct and positive influence on the museum’s external social capital.
The role of the director as a bridging tie
Structural holes theory (Burt, Reference Burt1992) proposes that players who occupy structural holes positions between separate clusters in a social network have better access to information and that this position in the network might provide them with competitive advantage. The bulk of the literature states that subjects occupying a structural hole benefit personally from their capacity for mediating between interconnected groups (Podolny & Baron, Reference Podolny and Baron1997; Burt, Reference Burt2000, Reference Burt2004). Moreover, the wider the separation between two groups (in terms of non-redundancy links and distance between groups), the higher the value of a bridging tie which crosses the structural hole between that groups (McEvily & Zaheer, Reference McEvily and Zaheer1999).
In museums, the role of crossing a structural hole is played mainly by the manager or curator. One role of the museum curator is to create links (bridging ties) between the organization and external elements (Edelman et al., Reference Edelman, Bresnen, Newell, Scarbrough and Swan2004; Acquaah, Reference Acquaah2007). The manager could play the role of broker and integrator, bringing people together to fill structural holes (Xiao & Tsui, Reference Xiao and Tsui2007). In fact, we do not measure whether museums have identified structural holes or not, although we do assume that a well-connected manager could fill the potential structural holes and bring more resources to the museum.
Payne et al. (Reference Payne, Moore, Griffis and Autry2011) explain that scholars assume that the sources of social capital are representative of social capital (i.e., the resources embedded or derived from networks), such that many studies do not directly measure social capital but rather analyze its sources (the features of the network). In our context, the characteristics of the managers’ network represent the manger’s social capital. Thus, the curator’s private social capital is reflected not only in the number of direct person to person contacts (ties) with representatives of other institutions and bodies, but also the strength of these ties (Davidsson & Honig, Reference Davidsson and Honig2003; Leitch, McMullan, & Harrison, Reference Leitch, McMullan and Harrison2013). As a result, we define the museum curator’s social capital as the amount (number of contacts) and quality (strong links) of contacts with representatives of other institutions (museums, public and private foundations, as well as central, local and regional authorities, together with educational and research establishments) in areas that are both related and unrelated with the museum’s activities.
Managers with a rich network of relationships are able to add value to their organizations by means of these relationships and to improve organizational social capital (Yli-Renko, Autio, & Tontti, Reference Yli-Renko, Autio and Tontti2002; Xiao & Tsui, Reference Xiao and Tsui2007; Butler & Purchase, Reference Butler and Purchase2008). In the context of entrepreneurship, Bhagavatula, Elfring, Van Tilburg, and Van De Bunt (Reference Bhagavatula, Elfring, Van Tilburg and Van De Bunt2010). show that entrepreneurs’ bridging ties (in the form of structural holes) have a positive effect on their ability to identify opportunities for their company. Similarly, a curator with a rich network (in terms of bridging ties) will be more efficient at identifying opportunities for the museum. In order to take advantage of such opportunities, curators should put their private relationships at the service of the museum’s objectives, so that part of their private network might be integrated into the museum’s institutional network. Insofar as the curator’s links are made available to the organization, individual social capital may become external social capital for the organization (Yli-Renko, Autio, & Tontti, Reference Yli-Renko, Autio and Tontti2002). Therefore:
Hypothesis 2 : The curator’s social capital (in related areas – Hypothesis 2a and non-related areas – Hypothesis 2b) has a direct and positive influence on the museum’s external social capital.
SOCIAL CAPITAL AND RESULTS
Effects of the museum’s internal social capital.
Social capital has direct effects on performance, particularly for areas in which competitiveness is based on intangible resources and capacities and which, therefore, cannot easily be procured in markets (Davidsson & Honig, Reference Davidsson and Honig2003; Gedajlovic & Carney, Reference Gedajlovic and Carney2010). Many authors are now underpinning the importance which social networks are gaining vis-à-vis securing business success, as individual interaction provides organizations with the chance to obtain fresh information from a range of sources.
Innovations in museums are related to innovation in the core service (temporary exhibitions, educational programs, friends programs, and so on) and to innovations in the supplementary services provided, such as advances in the technology employed to enhance the visitor experience (Camarero & Garrido, Reference Camarero, Garrido and Vicente2012). As for innovation when offering cultural activities, innovation forms part of a process that requires creativity, knowledge, networks and technologies and that enables new ideas in innovative goods and services to be generated and transferred (Jeffcutt & Pratt, Reference Jeffcutt and Pratt2002; Pratt & Jeffcutt, Reference Pratt and Jeffcutt2009). Indeed, innovation within an organization is the result of the exchange and merging of its members’ intellectual capital (Nahapiet & Ghoshal, Reference Nahapiet and Ghoshal1998; Tsai & Ghoshal, Reference Tsai and Ghoshal1998) and it is precisely social capital which ensures these exchanges through cohesion (Coleman, Reference Coleman1990). The cohesion generated thanks to these close ties increases the extent and speed with which information is transferred among members and ensures how such information will be used (Tsai & Ghoshal, Reference Tsai and Ghoshal1998). Relationships characterized by a high degree of cohesion display high levels of cooperation (Gulati, Reference Gulati1998) and the cooperation atmosphere is helpful to provide richer market knowledge and various technology that leverages the development of innovations (Koka & Prescott, Reference Koka and Prescott2002). Coleman (Reference Coleman1988) points to the benefits of being situated in a dense and cohesive network. These networks generate behavioral norms and sanctions for opportunistic attitudes, which is why the information is shared with greater trust. Commonly held regulations and values also improve mutual comprehension and reduce misunderstandings between the actors in the network (Ahuja Reference Ahuja2000; Dyer & Nobeoka Reference Dyer and Nobeoka2000). Accordingly, those individuals with a greater level of bonding social capital will increase their innovativeness (Nahapiet & Ghoshal, Reference Nahapiet and Ghoshal1998; Inkpen & Tsang, Reference Inkpen and Tsang2005).
As already pointed out, diversity involves the presence of different ideas and resources among an organization’s members, ideas and resources which might be merged so as to generate fresh knowledge at both an organizational (Yli-Renko, Autio, & Sapienza, Reference Yli-Renko, Autio and Sapienza2001; Burt, Reference Burt2004; Camelo-Ordaz & Valle-Cabrera, Reference Camelo-Ordaz and Valle-Cabrera2005) and an individual level (Chen, Reference Chen2015). Team diversity provides diverse skills, views, norms, values, and sociocultural heritage that promote original solutions, creativity, and innovation (Meiseberg & Ehrmann, Reference Meiseberg and Ehrmann2013).
Accordingly, organizations displaying a greater level of bonding social capital will increase their innovativeness (Nahapiet & Ghoshal, Reference Nahapiet and Ghoshal1998; Inkpen & Tsang, Reference Inkpen and Tsang2005). While the diversity of the museum’s internal network is related to the richness of the resources present in the network, cohesion is necessary to ensure the organization has access to its members’ resources. Internal social capital allows for greater productivity and innovation by cutting access costs to information (Knack & Keefer, Reference Knack and Keefer1997), generating larger amounts of knowledge (Morgan, Reference Morgan1997; Landry, Amara, & Lamari, Reference Landry, Amara and Lamari2001), increasing group decision-making and joint action (Fountain & Atkinson, Reference Fountain and Atkinson1998) as well as more efficient use of resources (Gui, Reference Gui2000).
Hypothesis 3 : A museum’s internal social capital (cohesion – Hypothesis 3a and diversity – Hypothesis 3b) has a direct and positive influence on its innovation performance.
One aspect which has received scant attention in the literature is the effect of an organization’s internal social capital on its reputation. At an individual level, Mehra, Dixon, Brass, and Robertson (Reference Mehra, Dixon, Brass and Robertson2006) state that a leader who is well connected within the friendship network of their own organizational group is in a better position to create a favorable personal reputation for leadership among the members of that group. Christopher and Gaudenzi (Reference Christopher and Gaudenzi2009) also examine how the strength of relationships in a network contributes to building organizational reputation. On the basis of the work of Payne, Holt, and Frow (Reference Payne, Holt and Frow2001), they propose that good linkage relationships with all the key partners, both internal (employees) and external (customers and others), affect reputation positively. They explain that employees’ good relationships and affiliation play an essential role in fostering the organization’s reputation in the perception of other companies and might lead the external partners to activate positive referrals. If we extrapolate the above results, it could be conjectured that the cohesion and links between the members of the museum have a positive impact on their reputation. A close-knit team will voluntarily seek to make its activities transparent to its target audience and to thus enhance its reputation. In addition, a close-knit team will voluntarily convey to other agents (press, tourist agencies, and other museums) the institution’s smooth functioning. In contrast, poor relationships among employees and managers may represent a source of reputational risk as they could spark negative referrals against the business they operate in. In other words, a museum’s internal problems, lack of cohesion, mistrust, or deficient coordination within the work team would quickly be transmitted to other agents as a negative image of the organization.
Furthermore, various actors will have a more favorable impression of organizations that are able to draw on diverse work teams, as an indication of their greater cultural and social wealth. The likelihood of sharing values with the social environment and, thus, of being perceived positively, will be greater. In this line, Fuller, Hester, Barnett, Frey, Relyea, and Beu (Reference Fuller, Hester, Barnett, Frey, Relyea and Beu2006) indicate that the average status level of an organization’s employees (employees who possess positive and different qualities) should be positively related to the organization’s esteem, prestige and position in society. In the context of the board of managers, Mrad and Hallara (Reference Mrad and Hallara2014) state that diversity plays a role in the evolution of the firm’s reputation when managers combine different backgrounds and prestige. As a result:
Hypothesis 4 : The museum’s internal social capital (cohesion – Hypothesis 4a and diversity – Hypothesis 4b) has a direct and positive influence on the museum’s reputation.
Effects of the museum’s external social capital
The museum’s external social capital (or bridging social capital) lies in the relations which the museum as an institution maintains with the various stakeholders to whom it is linked, which includes its institutional relationship with other museums.
According to Granovetter (Reference Granovetter1973), actors who develop ties with disconnected groups gain access to a broader array of ideas and opportunities than those who are restricted to a single one. Various empirical studies have underlined the role of bridging social capital as a factor that positively influences individuals’ (or organizations’) innovativeness or their capacity to access new knowledge (Burt Reference Burt1992; McEvily & Zaheer, Reference McEvily and Zaheer1999; Ahuja Reference Ahuja2000; Yli-Renko, Autio, & Sapienza, Reference Yli-Renko, Autio and Sapienza2001; Davidsson & Honig, Reference Davidsson and Honig2003; Bell Reference Bell2005; Zaheer & Bell, Reference Zaheer and Bell2005; Chetty & Agndal, Reference Chetty and Agndal2007). A firm’s relation with the various actors (other firms or institutions) involved in an industrial network improves its innovation (Zaheer & Bell, Reference Zaheer and Bell2005; Capaldo, Reference Capaldo2007), business (Lee, Reference Lee2007; Sasi & Arenius, Reference Sasi and Arenius2008) and financial performance (Park & Luo, Reference Park and Luo2001). Moreover, Blasco, Navas, and López (Reference Blasco, Navas and López2010) point out that external social capital enables the organization to position itself at different levels of the external network with the aim of locating and transferring valuable resources, minimizing external transaction costs and reducing the costs incurred by establishing links with stakeholders (Butler & Purchase, Reference Butler and Purchase2008).
In the case of museums, maintaining relationships with certain agents (prominent firms, other museums, associations, etc.) is not only a source of innovation but also a way to forge an organization’s reputation, attract funds, or engage other stakeholders. Research suggests that the investment in social relationships is a mechanism for reputation-building (Petkova, Rindova, & Gupta, Reference Petkova, Rindova and Gupta2008). Social capital contributes to the corporate image and the reputation of the organization (Dimov, Shepherd, & Sutcliffe, Reference Dimov, Shepherd and Sutcliffe2007). Indeed, reputation can be improved by the relationships with other high-status actors that legitimate its activity (Rindova, Williamson, Petkova, & Sever, Reference Rindova, Williamson, Petkova and Sever2005). Moreover, Petkova, Rindova, and Gupta (Reference Petkova, Rindova and Gupta2008) state that the relationship with prominent industry players has an effect vis-à-vis attracting other stakeholders. In museums, links with firms might prove to be a source of sponsorship as well as a means of setting up new exhibitions. For example, the Guggenheim Museums in New York, was pioneering in such relations with firms when it staged exhibitions of Giorgio Armani suits and BMW motorbikes. The relationship with other museums is also crucial. The directors of the Prado or Reina Sofía museums state that they network with other institutions as such networks afford them the chance to exchange exhibitions, coproduce or stage traveling exhibitions (El Pais, 2012). Therefore:
Hypothesis 5 : The museum’s external social capital has a direct and positive influence on the museum’s performance (innovation – Hypothesis 5a; reputation – Hypothesis 5b and incomes – Hypothesis 5c).
Interaction between results
The positive effect of innovation on cultural institutions’ performance has been highlighted in a number of works. For theaters, Voss, Montoya-Weiss, and Voss (Reference Voss, Montoya-Weiss and Voss2006) show how innovation is linked to higher income through increased ticket sales. Camarero, Garrido, and Vicente (Reference Camarero and Garrido2011) also show how organizational and technological innovations as well as innovation in value creation in museums enhance economic (e.g., income from ticket sales), market (e.g., reputation and prestige) and social (conservation or improvement of the collection) performance.
Given the diversification of the target audience, museums are aiming to implement innovations which may help to attract a wider public (tourists, as opposed to those who may be termed ‘connoisseurs’), specific groups (students, teachers, families, among others), as well as offering services to other target audiences (the press, travel agencies). If we add to this the fact that information and communication technologies applied to museum management can help to improve efficiency in terms of costs, we are accepting that innovation in museums can contribute toward enhancing economic performance. Further, increasing the frequency with which new activities are programmed, merging the traditional museum visit experience with other wide-ranging cultural activities in an effort to reach out to a broader audience, substantially contributes towards enhancing the museum’s image (Ministry of Culture, 2011b). Such activities might also act as a magnet to attract funding from firms and donors who are willing to link their image to ground-breaking projects. Therefore:
Hypothesis 6: Innovation in the museum has a positive impact on reputation (Hypothesis 6a) and incomes (Hypothesis 6b).
Reputation is an intangible asset that organizations possess which has a positive impact on business performance. In museums, external image is expected to have a positive influence on attracting income (commercial sales and funding from donors and sponsors), with reputation proving to be a dimension of brand equity and an antecedent of loyalty. Henard and Dacin (Reference Henard and Dacin2010) indicate that for companies with a reputation for innovative products, consumer excitement and expectation of satisfaction can emerge. Previous studies have also found that the organization’s reputation has a positive effect on the willingness to donate money and time and on volunteer recruitment (Hankinson, Reference Hankinson2001; Bennett & Gabriel, Reference Bennett and Gabriel2003; Sarstedt & Schloderer, Reference Sarstedt and Schloderer2010). Sarstedt and Schloderer (Reference Sarstedt and Schloderer2010) found that reputation anticipates donor willingness to give money and to work as an honorary member. Therefore:
Hypothesis 6c : Reputation has a positive impact on incomes.
Hypothesis 6c involves the existence of an indirect effect between internal social capital and incomes. As we consider that internal social capital (cohesion and diversity) within the organization will favor innovation, reputation, or external social capital, these achievements will result in increased income and fundraising. In other words, the direct source of income is not the cohesion and diversity of the team, but the activities performed by such a team.
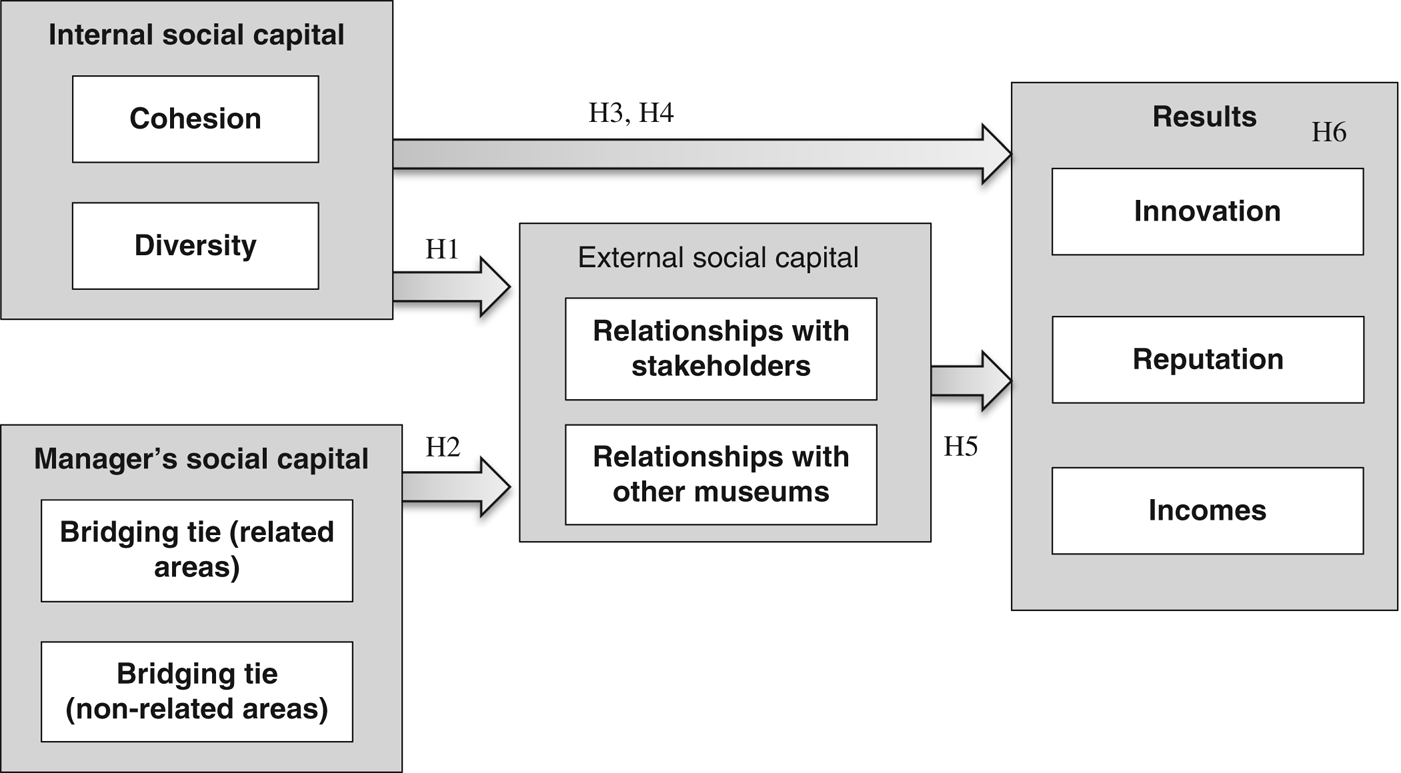
The hypotheses are summarized in Figure 1.
Proposed model

RESEARCH METHODOLOGY
Sample and measurement of constructs
A questionnaire was designed to measure the variables in the model. First, drawing up the questionnaire required exhaustive analysis of the particularities and evolution of museums by consulting news in the press, museum websites, journals specialized in museums and exhibitions together with other secondary sources. Second, we interviewed three curators responsible for three different museums: Science and Technology, Fine Arts and History, and Contemporary Arts. The interviews allowed us to pre-test the questionnaire and to judge the face validity, that is, that the items were representative of the conceptual definitions.
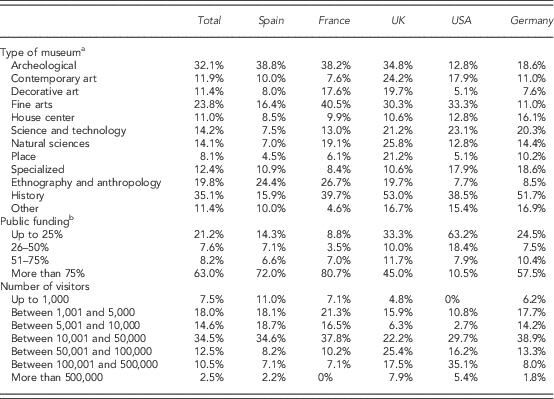
The questionnaire was sent via postal mail to museum curators in France, Spain, the United Kingdom, the United States, and Germany. The domain consisted of 4,800 museums (800 British, 1000 French, 1,300 German, 800 North-American, and 900 Spanish). The questionnaire was translated into the different languages by professional translators in order to ensure equivalence of measures between languages. The questionnaire could be answered and returned via postal mail (we included a stamped addressed envelope) or via online (we included a cover letter with the questionnaire in which we offered a URL address to answer the online questionnaire). In the cover letter it was indicated that the questionnaire should be completed by the manager or curator, who has a general knowledge of the institution’s social capital as well as their own social capital. Information was gathered from February to December 2014. The total number of responses collected during the process once incomplete questionnaires had been removed was 556 (39 American, 66 British, 119 German, 131 French, and 201 Spanish). In the Table 2, we describe the sample according to the type of museum, the type of funding, and visitor numbers.
Sample description

Notes.
a These categories are not exclusive. Several museums are included in more than one category.
b Information provided by 380 museums of the sample (n=556).
Measurement of constructs and validation
As for the measures of the various concepts, we created ad hoc scales based on a review of literature addressing social capital but adapted to the context of museums. Items were measured on a scale of five points, 1 indicating ‘Strongly disagree’ and 5 ‘Strongly agree.’
Internal social capital comprises two dimensions, cohesion and diversity (Galán & Castro, Reference Galán and Castro2004). Cohesion was measured with a reflective scale of five items which involve several aspects related with the strength of the relationship between the museum’s employees such as collaboration, group identity, shared values, mutual trust, and cooperation (Nahapiet & Ghoshal, Reference Nahapiet and Ghoshal1998; Tsai & Ghoshal, Reference Tsai and Ghoshal1998; Stone & Hughes, Reference Stone and Hughes2002). Diversity was measured by means of a formative scale of four items that include different professional profiles, academic background, country of origin, as well as ideas and opinions in the group of employees (Stone & Hughes, Reference Stone and Hughes2002).
To measure a manager’s social capital we asked them to assess the relations of a personal, professional or institutional nature they maintained at a personal level. Specifically, we differentiated two aspects: the role of the manager as a bridging tie in related areas (i.e., museums of the same kind and agencies related with the museum’s activity) and the role of the manager as a bridging tie in non-related areas (museums of another kind, public and private foundations, national, regional, and local authorities, associations, and teaching and research centers not directly linked to the museum’s activity). In order to evaluate the size and strength of ties for each relational area, we asked the museums’ curators to indicate the number of people they knew, at a particular level, in different agencies related and not related with the museum’s activity on a three-point scale (1=some; 2=several; 3=many). They were also asked whether they maintained a close personal relationship with some of these contacts (five-point Likert scale from completely disagree to completely agree). For each agency, we multiplied the number of contacts by the closeness of these relationships. In this way, we obtained five formative items to measure the manager’s role as a bridging tie in related areas and other five formative items to measure the role as a bridging tie in non-related areas.
To measure external social capital we asked managers to assess the relationships maintained by the museum as an organization. External social capital was divided into relationships with stakeholders and relationships with other museums. Relationships with stakeholders referred to the closeness of a museum’s relationships (from not very to close relationship) with visitors, members, volunteers, artists, donors, or political leaders, whereas relationships with other museums included other national, international, and other specialized museums.
Formative scales were also used to measure the results with ad hoc scales created on the basis of the interviews held with museum managers. Innovation was evaluated by six items, three five-point Likert items which indicate the frequency of new activities, cultural experiences and activities organized by the museum, and three items dealing with exhibitions (total number, own production and international ones) held over the last two years. Reputation was reflected on a five-item scale which refers to the improvement in the museum’s image and reputation over the last 3 years in the museum’s local community, specialized press, travel agencies and in the area. Finally, incomes were measured by four items referring to the increase in income through donations, sponsorship, commercial revenue and public revenue over the last 3 years.
As our sample comprises museums of quite differing sizes, we attempted to evaluate this aspect by using size as a control variable when measuring variables and by estimating the proposed model. To do this, we considered the number of visitors as a variable of seven categories that we describe in Table 2.
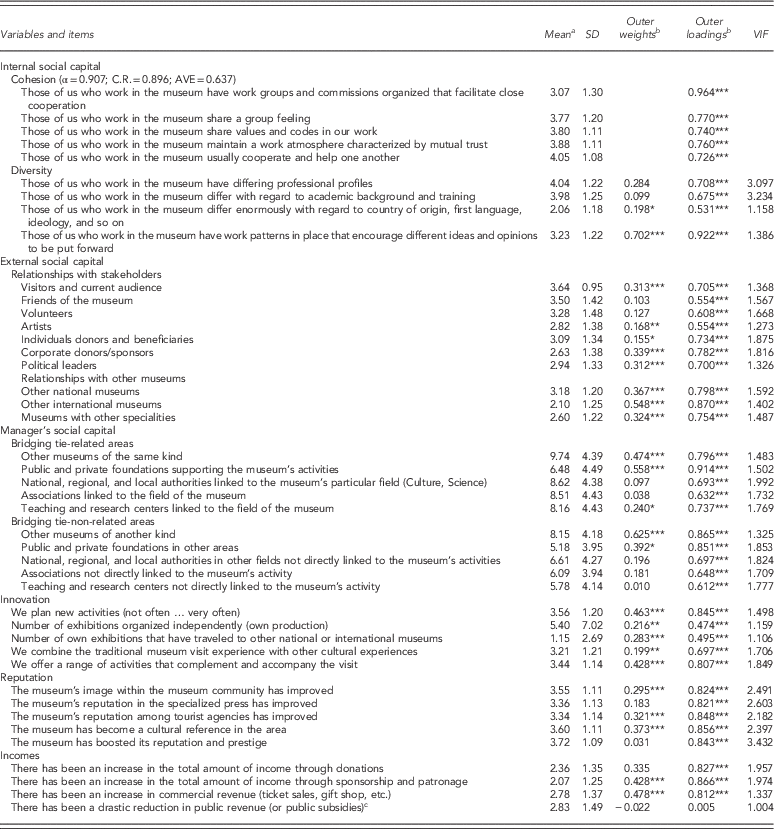
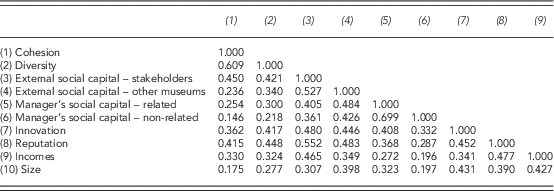
Table 3 reports the descriptive statistics (means and standard deviations) and reliability values for the reflective scale. As regards validating the formative constructs, Diamantopoulos and Winklhofer (Reference Diamantopoulos and Winklhofer2001) suggest using normal regression diagnostics to assess formative index validity. Table 3 shows the variance inflation factor for the indicators. These values evidence that multi-collinearity is not a problem in the construction of the formative indexes as each value was significantly below 5. The correlation matrix is provided in Table 4.
Descriptive statistics

Notes.
a n=556.
b Sample mean.
c Recoded variable.
VIF=variance inflation factor.
*p<.05; **p<.01; ***p<.01.

We performed Harman’s single-factor test to assess the possible impact of common method variance. Exploratory factor analysis with all the indicators gave 12 factors with an eigenvalue of over 1.0 (total variance explained=73%), with a first factor explaining only 24.73% of variance. As there is no single factor accounting for the majority of the covariance among the measures, the possible impact of common method bias is minimal.
RESULTS
In order to test the proposed hypotheses, we used the partial least squares approach, specifically, SmartPLS 3.0 software (Ringle et al., Reference Ringle, Wende and Will2005). The level of statistical significance of the coefficients (both of the measurement and the structural model) was calculated by means of a bootstrapping procedure with 500 sub-samples. We estimated the model using the consistent partial least square algorithm which ensures that parameter estimators are consistent and asymptotically normal under standard assumptions (Dijkstra & Henseler, Reference Dijkstra and Henseler2015).
The factorial loadings and weights of the items as well as the p-value are shown in Table 3. In Table 3, presented previously, the values of the variance inflation factor are also shown as are the outer weights of each indicator. We observe that collinearity is not at a critical level. As for the significance of the formative indicators, Hair, Hult, Ringle, and Sarstedt (Reference Hair, Hult, Ringle and Sarstedt2014) explain that non-significant indicator weights should not be interpreted as indicative of poor model quality measurement. When an indicator’s outer weight is non-significant but its outer loading is high (>0.50), the indicator should be interpreted as absolutely important but not as relatively important. In our analysis, the absolute contribution of the indicators can be interpreted as relevant, with 0.474 being the lowest outer loading, except for one item of the incomes variable (public incomes) which was removed from the analysis.
In order to evaluate convergent validity in formative measurement models, testing whether the formatively measured construct is highly correlated with a reflective measure of the same construct is recommended (Hair et al., Reference Hair, Hult, Ringle and Sarstedt2014). In our research, in order to limit the length of the questionnaire, we did not include reflective scales for network resources and so were unable to test convergent validity. Finally, discriminant validity was established as the item-to-construct correlations were higher with each other than with other construct measures. Moreover, each construct shares less than half of its variance with other constructs, that is, construct intercorrelation is <0.71 (Fornell & Larcker, Reference Fornell and Larcker1981).
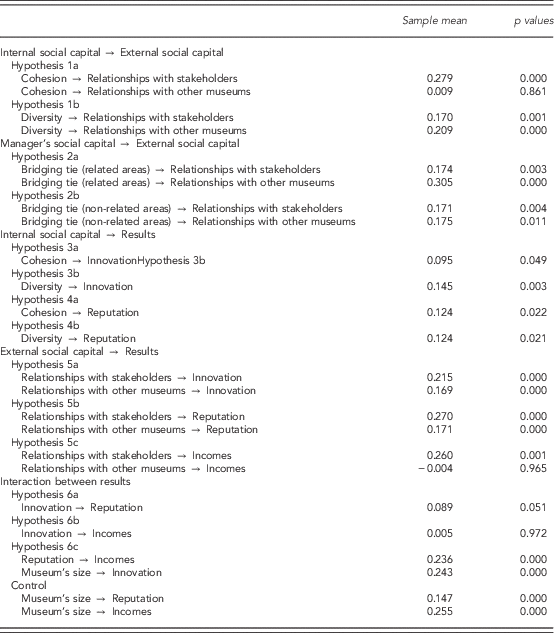
In Table 5, we show the partial least square path parameters. As regards the explained variance of the endogenous variables, R 2 adjusted values were 0.324 for relationship with stakeholders, 0.290 for relationship with other museums, 0.376 for innovation, 0.434 for reputation, and 0.341 for incomes.
Estimated relationships

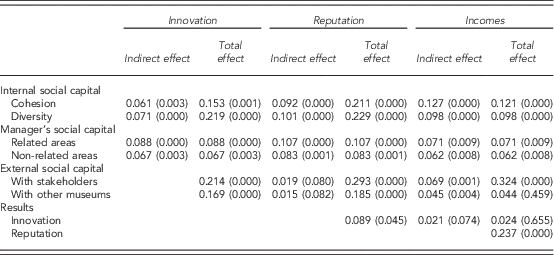
The standardized root mean square residual for the estimated model is 0.053. The standardized root mean square residual is a goodness of fit measure for partial least squares and is defined as the difference between the observed correlation and the predicted correlation (Henseler et al., Reference Henseler, Dijkstra, Sarstedt, Ringle, Diamantopoulos, Straub, Ketchen, Hair, Hult and Calantone2014). A value <0.08 is considered a good fit. Finally, Table 6 shows the indirect and total effects.
Indirect and total effects

Considering the impact of internal social capital (cohesion and diversity) on external social capital (relationship with stakeholders and other museums), Hypothesis 1 is partially supported. Whereas the diversity of the museum’s team has a positive effect on the development of external social capital (Hypothesis 1b is supported), the cohesion of the museum’s team only has a positive impact on the relationship with stakeholders, but does not impact on the relationship with other museums, therefore partially supporting Hypothesis 1a. Hypothesis 2 also found support. Managers’ social capital is positively related with the museums external social capital. When managers act as a bridging tie in related areas (such as museums of a similar domain and other institutions related with culture), the museum is able to forge close ties with stakeholders and other museums (Hypothesis 2a). Similarly, the manager’s role as a bridging tie in non-related areas also contributes to increasing close relationships with stakeholders and other museums (Hypothesis 2b). In support of Hypothesis 3 and Hypothesis 4, the two dimensions of internal social capital, cohesion and diversity, increase innovation and reputation. As for the influence of external social capital on the museum’s results, Hypothesis 5a and Hypothesis 5b are supported. Relationships with stakeholders and other museums have a positive and significant effect on innovation and reputation. As for Hypothesis 5c, relationships with stakeholders have a positive effect on museum incomes, but the effect of the relationships with other museums does not prove significant. Partial support is found for the remaining hypothesis, Hypothesis 6. Innovation has a positive impact on reputation (Hypothesis 6a), and reputation on incomes (Hypothesis 6c), but the direct effect of innovation on incomes is not supported (nor is the indirect effect). As regards control variables, results indicate that the larger a museum, the higher the results in innovation, reputation and incomes.
Finally, when analyzing indirect and total effects, we observe that the indirect effect of internal social capital on innovation and reputation (through external social capital) is positive and significant. In addition, the indirect effect of managers’ social capital on results is also significant.
DISCUSSION AND IMPLICATIONS
This study focuses on the case of museums to underline the influence of an organization’s social capital (internal and external) on innovation, reputation and incomes, mainly from fundraising. Moreover, it points to the manager’s central role as a bridging tie.
The study makes a significant contribution to social capital literature, as it simultaneously considers several dimensions of social capital: individual versus collective social capital (Woolcock, 1988; Portes, Reference Portes1998) and internal versus external (Adler & Kwon, Reference Adler and Kwon2002; Yli-Renko, Autio, & Tontti, Reference Yli-Renko, Autio and Tontti2002; Chetty & Agndal, Reference Chetty and Agndal2007) social capital, and thus delves more deeply than prior partial analyses which only address isolated dimensions or variables of a firm’s social capital. It also contributes to cultural organizations research, as it establishes a relationship between the organization’s social capital and the manager’s social capital.
First, we find that cohesion in the organization, that is, shared values, trust, cooperation, or group feelings among employees, helps build relationships with stakeholders and has a positive influence on the museum’s ability to innovate and on its reputation. Furthermore, the variety and diversity among museum employees are related to innovation, reputation, and to the relationships with stakeholders and other museums. In other words, the greater the internal richness of relationships, the greater the external richness of contacts. If internal social capital is a relevant resource, the manager’s external contacts are a further source of value. Managers’ social capital plays a key role in the ability to maintain relations with stakeholders and other museums, such that, indirectly, this will impact performance.
Second, our findings show that museums which maintain relations with a range of different stakeholders and with other museums that belong to other networks will diversify their network of contacts and will have a greater chance of innovating and raising funds from various sources. This impact of external social capital on innovation, reputation and incomes reflects the need to interact with external actors so as to acquire fresh knowledge and resources that are not developed internally by the museums itself. Such knowledge, information or external resources provide value and enable the museum to undertake its work more efficiently (by facilitating the staging of new exhibitions, activities, cultural experiences, etc.), contribute substantially to enhancing its image and ultimately help to achieve better performance.
Finally, our results highlight that greater innovation by the museum, programming new activities, staging independent exhibitions, providing visitors with new experiences, etc., leads to a better image for the museum, which again brings about enhanced performance.
Theoretical and managerial implications
At a broader level, the present research contributes to the literature on social capital in cultural organizations and how it affects performance in terms of innovation, reputation and funding. The study has proposed a model that combines organizational social capital (internal and external) and individual social capital. Merging these perspectives is pioneering in the context of cultural organizations and relevant as it explores the interrelation between individual social capital (curators and managers) and collective social capital. Furthermore, our work adopts the social capital and social network theories to explain how museums engage with their social and institutional environment in order to improve their performance.
From a managerial perspective, the present study provides useful guidelines for museum managers, these guidelines underscoring the importance of intangible resources, specifically those relating to social capital, within the process of innovation (in exhibitions, cultural experiences and activities) and in the organization’s reputation and fundraising. From a practical standpoint, the conclusions highlight the importance of considering social capital as a strategic resource to be managed. Efficient management depends on developing internal relations, making use of managers’ social capital and engaging with external actors through the appropriate resources and establishing strong efficient ties with them.
In this way, museum managers who decide to undertake an innovation project focusing on achieving innovation in exhibitions, cultural experiences and on a range of activities coupled with an enhanced reputation and fundraising should seek to manage internal social capital as best as possible, fostering work group cohesion and making a commitment to team diversity. Organizations should first promote cohesion, in other words, communication, mutual trust, cooperation among employees, as well as encouraging informal relations among them. Museums should establish a stable platform or informal gathering to enable employees to achieve unhindered communication across the whole firm, including the exchange of information and new ideas, encouraging knowledge sharing and establishing various information channels to facilitate communication among employees. Social and professional relationships are embedded, which is why companies like Google or business models like co-working centers, promote informal workplace activities during the working day. The social interaction between their workers leads to a more cohesive network. Cohesive networks provide the focal firm with the right context in which to share tacit knowledge and undertake risky investments, which prove key to developing radical innovations. When addressing innovation, the collaborative approach should be considered as should achieving a sound reputation in which both internal and external relations prevail in order to secure better performance. Second, group diversity should be fostered, as variety affords access to strategic resources that help attain innovation by sharing complementary knowledge.
Likewise, it is also crucial to build bridges outwards, in other words to create external social capital through relations with stakeholders (visitors, friends of the museum, volunteers, donors, etc.) and with other national and international museums. In addition, the relationship with stakeholders provides organizational networks with innovative ideas and resources. Museums, as well as other organizations that depend on multiple target audiences, need to create networks of relations, even communities around the museum, in which each actor strives to generate a common value. Museums which are able to create stable links with external actors will be better placed to access fresh, varied and non-redundant information and will be more able to innovate, secure funds, and boost their image.
Museum managers should foster such relations. Cooperation with other museums may be achieved, for example, by loaning works of art for temporary exhibitions, sharing facilities, staff and technical know-how, conducting joint advertising and publicity campaigns or even by taking advantage of the proximity between museums so as to create a focal point of cultural attraction. Those running the museum might also implement loyalty programs that would enable museums to establish a personalized and valuable link with the visitor/donor (e.g., private visits, personalized services) that would help forge long-term relations. The tools and mechanisms which museums could use in order to help maintain a long-term atmosphere of trust with their staff include: bidirectional communication, training, motivation and recognition. However, these activities should not be viewed as elements to be used only occasionally but should be geared toward strengthening the museum members’ social links with other external agents, that is to say in order to embed institutional and social relationships.
The results suggest that those responsible within the museum for fostering innovation and enhancing reputation should promote social interaction, diversity among museum employees and create a climate of trust with both stakeholders and other museums alike. Innovation, reputation and social capital are key factors in developing a museum’s competitiveness. Museums will become aware of how their competitiveness is affected when they realize the importance and benefits which such aspects can provide them with.
Our findings bear out the role played by managers’ social capital (bridging tie) as a key factor for guiding these relations with stakeholders and other museums towards innovation, a better image for the museum and fundraising. It could be said that managers might put their relational social capital at the service of the cultural organization. Therefore, the manager’s relations or contacts with other networks and agents can provide opportunities to access innovation and financial resources (Fornoni, Arribas, & Vila, Reference Fornoni, Arribas and Vila2012). Indeed, museums appear to be increasingly willing to hire managers who are able to attract an ever wider array of resources. Hence, the ideal situation with regard to top managerial skills in museums would be for managers to be trained in a range of different areas (for instance, in new communication media), enabling them to forge and maintain links with new audiences and institutions (artists, students, young people, media, etc.) and to access different networks (Vogel, Reference Vogel2010).
Our findings reflect how the capacity for innovation, in part, feeds on social relations. The creativity required to be innovative cannot be obtained without interacting with the environment, society, competitors and, in general, other social actors. Museum managers investing in these social relations might be one key way of progressing toward securing the capacity for innovation, image and funding.
Limitations and further research
As with all research work, the present study is not without its weaknesses and limitations, which point the way to future inquiry. First, measurement of social capital and performance has been based on museum managers’ subjective perceptions. Even if the manager might have a global and comprehensive viewpoint of the museum’s relationships, using a single informant to evaluate internal and external social capital is a limitation of our study. Although it is difficult to find measures which reflect in detail and in a comparable manner a manager’s or a museum’s social capital, we feel that the study might be complemented by other research work based on objective (albeit not perfect) measurements of social capital such as the specific number of stakeholders (sponsors, volunteers, friends, donors, associations, etc.) with whom the museum or the manager is linked. Furthermore, reputation and incomes may be measured using external indicators, such as mentions in the media and the amount of external funding secured by the museum, respectively.
Second, future research should examine more exhaustively the interaction of managers’ social capital and reputation and the organization’s social capital and reputation. In the current paper, we introduce the manager as a resource for the firm, as one who builds relationships and devotes them to the organization. However, an alternative perspective could be to analyze the impact of an organization’s reputation on managers’ ability to build relationships and social capital and to use it as a personal resource.
Third, our model does not take account of the impact of other aspects such as the main source of funding, type of ownership (private vs. public ownership), or the managing institution (direct public management, publicly managed, but independently run, or private). Moreover, how museums use the resources accessed through managers as well as through external social capital should also be evaluated.
Acknowledgments
Part of the research project “Innovating European museums. Analyzing activities, determinants, and efficiency indicators” (ref. ECO2012-38552) funded by the Ministry of Economy and Competitiveness. National R&D Plan 2008-2011.