1. Introduction
Banded iron formations (BIFs) are widely distributed throughout the world, predominantly in the United States, Greenland, Africa, Australia, Russia, China and India. They are a major source of iron ore and account for c. 90 % of iron ore production worldwide (Isley, Reference Isley1995). BIFs formed between 3.8 Ga and 1.9 Ga are considered a product of a special geological environment in early Precambrian time that records information about the formation and evolution processes of the early Earth’s lithosphere, hydrosphere, atmosphere and biosphere (Huston & Logan, Reference Huston and Logan2004; Johnson et al. Reference Johnson, Beard, Klein, Beukes and Roden2008; Bekker et al. Reference Bekker, Slack, Planavsky, Krapez, Hofmann, Konhauser and Oliver2010; Steinhoefel et al. Reference Steinhoefel, von Blanckenburg, Horn, Konhauser, Beukes and Gutzmer2010). BIFs provide ample evidence for research on the early Earth’s environment. Therefore, BIFs are of great economic value and academic significance. Huston & Logan (Reference Huston and Logan2004) and Klein (Reference Klein2005) classified BIFs predominantly into Algoma and Superior types. Algoma-type BIFs, associated with coeval volcanic sequences in greenstone belts, were predominantly deposited during the Archaean Eon (Huston & Logan, Reference Huston and Logan2004; Klein, Reference Klein2005; Li, H. M. et al. Reference Li, Wang, Li, Cheng, Yang and Liu2012). Superior-type BIFs, which are closely related to sedimentation and generally strata-bound in sedimentary sequences in passive continental margins or stable cratonic basins, were predominantly formed during the Palaeoproterozoic Era (Klein, Reference Klein2005; Li et al. Reference Li, Hou, Wan, Zhang and Yue2014; Gross & McLeod, Reference Gross and McLeod1980). However, several key questions about BIFs have not been resolved, e.g. the source of metallogenic materials and the genesis of BIFs.
Three hypotheses about BIF genesis have been proposed, including an upwelling-current model, a submarine erupting model and a microbiogenic model. The upwelling-current model indicates that Fe2+ enriched in deep seawater would be oxidized to Fe3+ by oxygen as it welled up to the redox interface of the upper ocean, resulting in the precipitation of Fe and the formation of BIFs (Clout & Simonson, Reference Clout, Simonson, Hedenquist, Thompson, Goldfarb and Richards2005). The submarine erupting model suggests that Fe and Si were leached from newly formed mafic oceanic crust by convective circulation of seawater and that the BIFs formed when the concentrations reached saturation (Goodwin, Reference Goodwin1973; Lascelles, Reference Lascelles2006). Recently, scholars have discovered microorganisms that existed in BIFs of the early Earth and proposed that these microorganisms participated in the precipitation of BIFs (Kappler et al. Reference Kappler, Pasquero, Konhauser and Newman2005; Heimann et al. Reference Heimann, Johnson, Beard, Valley, Roden, Spicuzza and Beukes2010). The source of metallogenic materials is another key problem in the study of BIFs. Scholars have suggested that the Fe and Si in BIFs originated from the weathering of early mafic continental crust under anoxic conditions (James, Reference James1954; Cloud, Reference Cloud1973; Drever, Reference Drever1974; Kholodov & Butuzova, Reference Kholodov and Butuzova2001). Other researchers proposed that these metallogenic materials originated from the leaching of seafloor basalts and komatiites by hydrothermal fluids (Rao & Naqvi, Reference Rao and Naqvi1995; Klein, Reference Klein2005; Polat & Frei, Reference Polat and Frei2005).
The Yuanjiacun BIF is a large iron deposit located in the central North China Craton (NCC). Zhang et al. (Reference Zhang, Zhai, Wan, Guo, Dai, Wang and Liu2012) and Li, H. M. et al. (Reference Li, Wang, Li, Cheng, Yang and Liu2012) considered this deposit to be a Superior-type BIF. Shen et al. (Reference Shen, Song and Li1982) and Wang et al. (Reference Wang, Zhang, Lan, Li and Huang2015b) recognized oxide facies, silicate facies and carbonate facies iron formations based on their predominant iron minerals. Wang et al. (Reference Wang, Zhang, Dai and Lan2015a) proposed that the depositional age was 2350–2200 Ma based on a zircon dating study of metasandstone from the Yuanjiacun Formation. The geological features and deposit type of the Yuanjiacun BIF are significantly different from those of other BIFs in the NCC. The other BIFs in the NCC occurred in the margin of the craton and formed in late Archaean time; the sedimentary facies were relatively simple, predominately oxide facies; and the deposit type was predominantly Algoma-type (Wu et al. Reference Wu, Zhang, Yang, Xie and Yang2008; Shen et al. Reference Shen, Song, Yang and Wan2011; Li, Y. H. et al. Reference Li, Hou, Wan and Zhang2012, Li, Z. H. et al. Reference Li, Zhu and Tang2012; Lan et al. Reference Lan, Fan, Hu, Yang, Zheng and Zhang2012). The current genesis model of BIFs is not completely suitable for the Yuanjiacun BIF. Thus, a geological survey and sampling of the Yuanjiacun BIF was carried out, and its major- and trace-element concentrations and Fe, Si and O isotope compositions were obtained. These data were used to constrain the source of metallogenic materials and the genesis of the Yuanjiacun BIF. We expect that this research on the Yuanjiacun BIF can provide deep insights into the genesis of BIFs.
2. Regional geological background
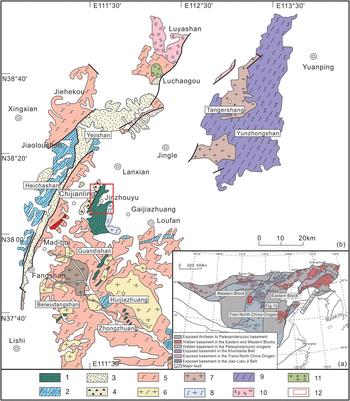
The NCC is the largest and oldest craton block in China (Zhai et al. Reference Zhai, Bian and Zhao2000; Wu et al. Reference Wu, Zhang, Yang, Xie and Yang2008) and is subdivided into the Eastern Block, the Western Block and the Trans-North China Orogen (TNCO; Fig. 1a; Zhao et al. Reference Zhao, Sun, Wilde and Li2005). The Western Block collided with the Eastern Block to form the coherent basement of the NCC along the TNCO at ∼1.85 Ga (Zhao et al. Reference Zhao, Wilde, Guo, Cawood, Sun and Li2010).
(a) Tectonic subdivision of the NCC (after Zhao et al. Reference Zhao, Sun, Wilde and Li2005). (b) Sketch geological map of the Lüliang area in Shanxi Province (after Zhao et al. Reference Zhao, Wilde, Sun, Li, Li and Zhang2008). 1 – Lüliang Group; 2 – Jiehekou Group; 3 – Yejishan Group; 4 – Lanhe Group; 5 – Chijianling–Guandishan gneiss; 6 – Huijiazhuang gneissic granite; 7 – Guandishan granite; 8 – Gaijiazhuang gneiss; 9 – Yunzhongshan gneiss; 10 – Luyashan charnockite; 11 – Luchaogou porphyritic granite; 12 – research area.
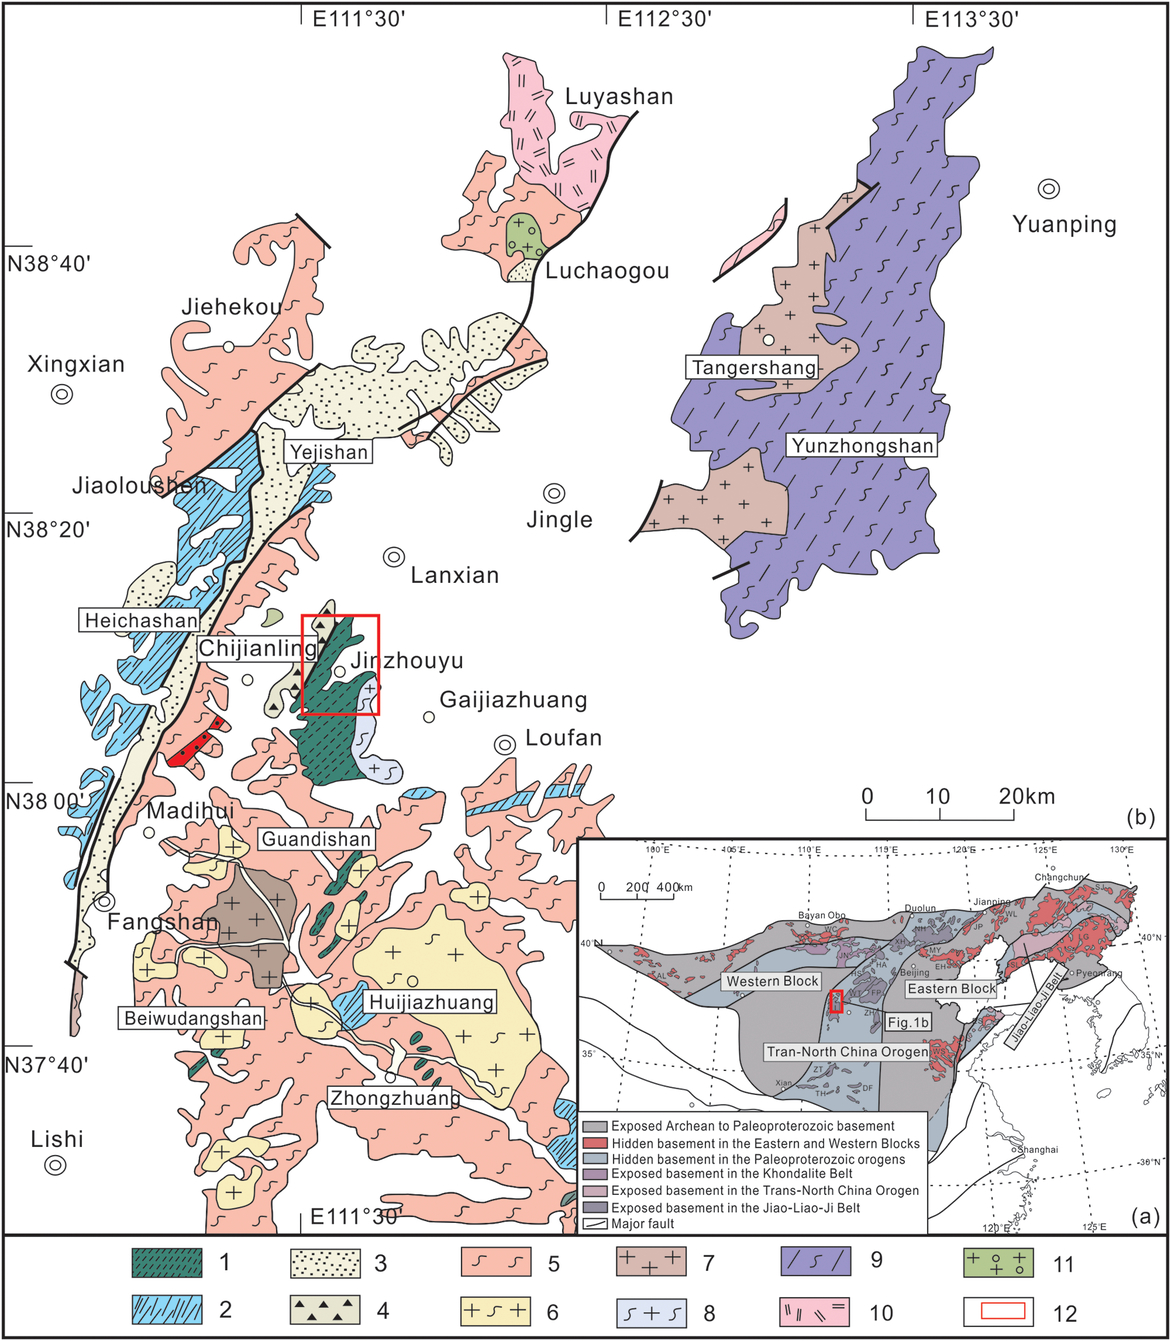
The Lüliang area, in which the Yuanjiacun BIF is hosted, is located at the western rim of the middle section of the TNCO. Palaeoproterozoic supracrustal rocks and granitic intrusions are widely exposed in this area (Fig. 1b).
From bottom to top, these supracrustal rocks comprise the Jiehekou, Lüliang, Yejishan and Lanhe groups (Fig. 2a). The Lüliang Group is subdivided into the Yuanjiacun, Peijiazhuang, Jinzhouyu and Dujiagou formations from bottom to top, and predominantly consists of meta-clastic sedimentary rocks, meta-basic volcanic rocks and meta-rhyolite. The BIF occurs at the bottom of the Yuanjiacun Formation. The zircon U–Pb age obtained from detrital zircons in the Yuanjiacun Formation is 2384 ± 45 Ma (Wang et al. Reference Wang, Zhang, Dai and Lan2015a). The zircon U–Pb age of the metamorphic basic sub-volcanic rock from the Jinzhouyu Formation is 2213 ± 47 Ma (Liu et al. Reference Liu, Zhang, Li, Zhang, Wang and Yang2012). The zircon age of the feldspar porphyry from the Dujiagou Formation obtained by sensitive high-resolution ion microprobe (SHRIMP) is 2189 Ma (Du et al. Reference Du, Yang, Ren, Song, Geng and Wang2012).
(a) Stratigraphic column of the Lüliang Complex (after Wang et al. Reference Wang, Zhang, Lan, Li and Huang2015 b). (b) Stratigraphic column of the Yuanjiacun Formation showing three transgressive and regressive cycles (after Shen et al. Reference Shen, Song and Li1982).

3. Geology of the Yuanjiacun BIF
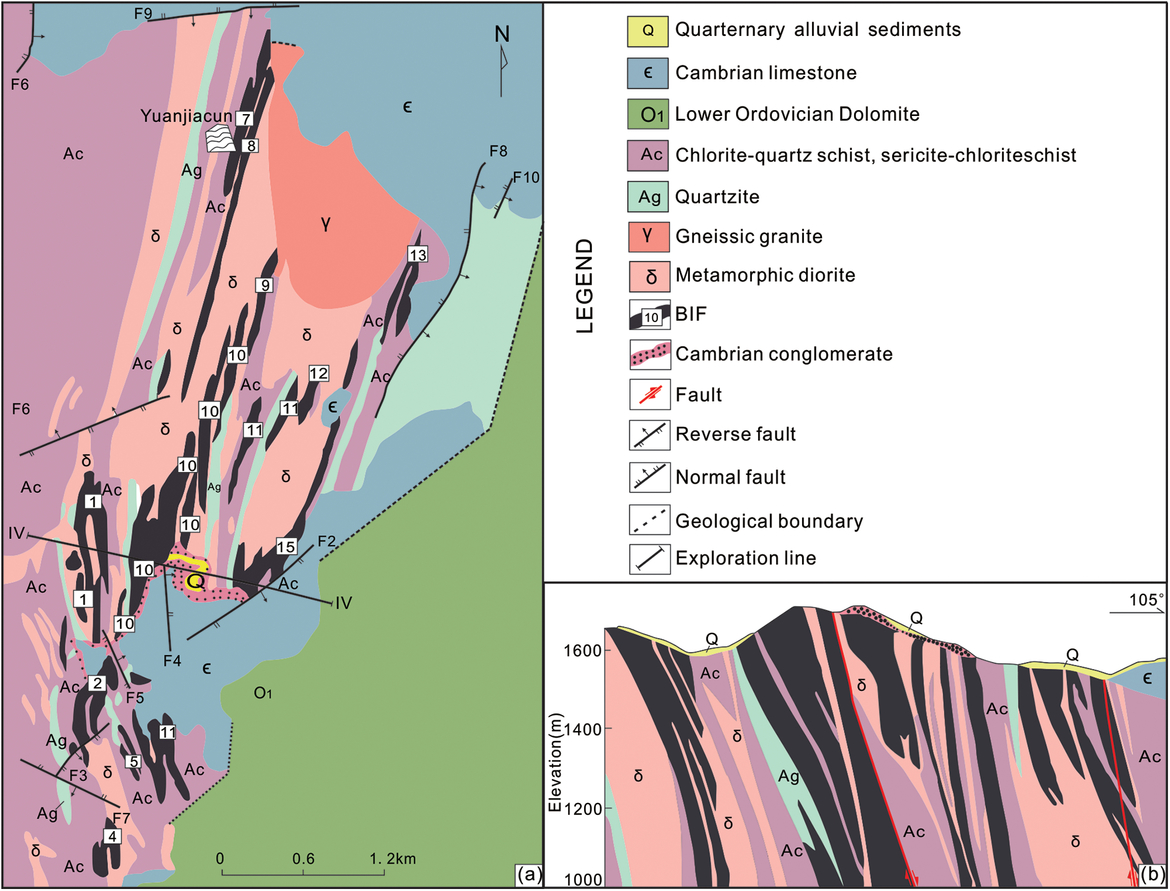
The Yuanjiacun BIF is hosted in the Yuanjiacun Formation of the Lüliang Group (Fig. 3a). The general strike of the Yuanjiacun Formation is NNE to N–S with a SE to E dip, and the inclination ranges from 60° to 80° (Fig. 3b). The Yuanjiacun Formation is subdivided into three ferruginous sections (Fig. 2b; Zhu et al. Reference Zhu, Zhang and Xu1988). At the bottom of each section is medium- to coarse-grained feldspar quartz sandstone and quartz sandstone; moving upwards, the lithologies consist of fine sandstone, siltstone, sericite schist, chlorite schist and ferruginous schist; finally, the lithologies gradually transform into a BIF. The Yuanjiacun BIF is in conformable contact with the surrounding rocks. In each of the three ferruginous sections, terrigenous detrital materials gradually decrease as chemically deposited materials increase from bottom to top, and finally, the lithologies transform into BIFs. This sequence reflects three sedimentary-metallogenic cycles in which BIFs formed (Zhu et al. Reference Zhu, Zhang and Xu1988). In each cycle, the sediments transformed from a predominantly terrigenous component to a predominantly chemical component.
(a) Geological map of the Yuanjiacun BIF. (b) Profile of the IV prospecting line (after Wang et al. Reference Wang, Zhang, Lan and Dai2014).

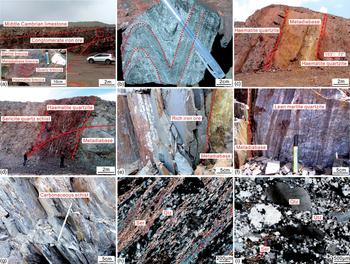
Cambrian strata can be seen in Beishan, Bojishan, Niangou and the eastern part of the mining area. At the bottom of the middle Cambrian strata is a thick conglomerate iron orebody, which overlies the Lüliang Group with an angular unconformity (Fig. 4a). Its trend is NE, with a dip of 95–115° and an inclination of 7–18°. Its occurrence is flat, and its greatest thickness is 42 m.
Field photos of the Yuanjiacun BIF and photomicrographs of surrounding rocks. (a) Conglomerate iron orebody and surrounding rock, where rubble of the conglomerate iron orebody is composed of haematite, martite, meta-diabase and quartz. (b) Small tight similar folds in specularite quartzite. (c) Fault filled by meta-diabase. (d) Hercynian–Yanshanian reverse fault. (e) Rich iron ores occurring in the contact zone of meta-diabase and orebody. (f) Iron ores diluted in the contact zone of meta-diabase and the orebody. (g) Field photos of carbonaceous schist. (h) Photomicrograph of sericite quartz schist (cross-polarized light). (i) Photomicrograph of metamorphic quartz sandstone (cross-polarized light). Qtz – quartz; Ser – sericite.

Small interlamination folds in these orebodies are abundant and are subdivided into main complex folds and secondary small folds based on their scale. The main complex folds range from several to tens of metres in size. The secondary small folds show tight similar folds with undulating hinges (Fig. 4b). The fault structures in the mining area are widely distributed and subdivided into late Archaean faults and Hercynian–Yanshanian faults based on their formation period (Shen et al. Reference Shen, Song and Li1982). The late Archaean faults have been filled by Archaean meta-diabases (Fig. 4c). Except for F5 and F6, which are normal faults, the rest of the Hercynian–Yanshanian faults are reverse faults (Fig. 4d). These faults predominantly trend NE–NNE with a SE dip, and their inclination ranges from 70° to 85°.
Greyish-green or brown-green meta-diabases, with massive structures and blastophitic textures, are widely distributed. These meta-diabases penetrate into surrounding rocks as veins or dykes and are in conformable contact with their surrounding rocks. Ore dilution or enrichment has often occurred at the contact zones of meta-diabases and iron orebodies (Fig. 4e, f).
The Yuanjiacun BIF is located in a region that is 6 km long from north to south and 0.4–1.5 km wide from east to west, including a total of 20 orebodies of different sizes. The orebody strike is nearly N–S, and the dip is E or SE, with the inclination ranging from 60° to 80°. Most of the orebodies are stratoid, and a few are lenticular and irregular. Corresponding to the three ferruginous sections mentioned above (Zhu et al. Reference Zhu, Zhang and Xu1988), these orebodies are subdivided into three ore belts from west to east. Ore Belt I, hosted in the first ferruginous section, is distributed in the western part of the mining area. It includes three orebodies: No. 1, No. 2, and No. 5. Ore Belt II is hosted in the second ferruginous section. It is the largest ore belt and is distributed in the centre of the mining area. This ore belt is c. 5000 m long, and its width ranges from 200 m to 600 m, including seven different sizes of orebodies such as No. 8, No. 10 and No. 11. Ore Belt III is hosted in the third ferruginous section. It is distributed in the eastern part of the mining area and consists of five medium to small orebodies.
The iron ore structures are banded, streaky, porous and massive. The metallic minerals in the ores are dominated by iron oxides, such as magnetite, martite, haematite and specularite, and include a small amount of siderite and trace pyrite and chalcopyrite. The gangue minerals include predominantly quartz, stilpnomelane and ankerite. Based on their mineral compositions and contents, these iron ores can be subdivided into four mineralization types.
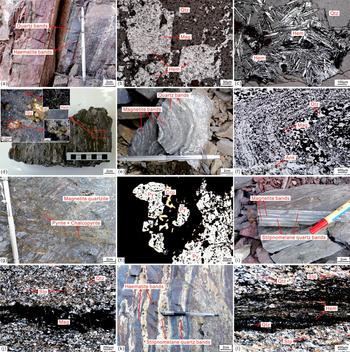
Haematite quartzite is steel blue and blue-black (Fig. 5a). The metallic minerals are dominated by haematite (23 %), which contains 3 % martite, followed by magnetite (5.5–13.2 %). Martite substantially replaces magnetite and forms intact magnetite pseudomorphs (Fig. 5b). The gangue minerals include quartz (54 %) and a small amount of limonite. In orebody No. 10, a small amount of specularite is inhomogeneously distributed along the structural planes, including bedding, foliation and fractures. The specularite exhibits platy or schistose structures 0.1–0.2 mm long and 0.01 mm wide (Fig. 5c). The rich ores consist of black stripes, which are enriched in iron minerals, and grey-black stripes, which have slightly higher quartz contents (Fig. 4b). Some of the haematite quartzite exhibits obvious pore structures (Fig. 5d). The filling materials are quartz and specularite crystals. Large scaly specularite crystals occur along the boundaries of pores.
Sample photos and photomicrographs of the Yuanjiacun BIF. (a) Image of haematite quartzite with a banded structure. (b) Photomicrograph of haematite quartzite with metasomatic pseudomorph texture (reflected light). (c) Photomicrograph of specularite (reflected light). (d) Image of haematite quartzite with pore structure. (e) Image of magnetite quartzite with plasticity-crumpled structure. (f) Photomicrograph of magnetite quartzite with crumpled structure (plane-polarized light). (g) Image of pyrite and chalcopyrite-bearing magnetite quartzite. (h) Photomicrograph of pyrite and chalcopyrite from magnetite quartzite (reflected light). (i) Image of stilpnomelane magnetite quartzite. (j) Photomicrograph of stilpnomelane magnetite quartzite (cross-polarized light). (k) Image of stilpnomelane haematite quartzite. (l) Photomicrograph of stilpnomelane haematite quartzite (plane-polarized light). Hem – haematite (specularite); Mag – magnetite; Ank – ankerite; Stp – stilpnomelane; Py – pyrite; Ccp – chalcopyrite.

Magnetite quartzite is grey and dark grey (Fig. 5e). The metallic minerals include predominantly magnetite (26.2 %), followed by haematite (4.4 %) and small amounts of pyrite and chalcopyrite (Fig. 5f, g, h). The predominant gangue minerals include quartz (46.9 %) and ankerite (7.7 %). Ankerite together with quartz occurs as veins cutting the layers (Fig. 5f). The iron ores exhibit idiomorphic, hypidiomorphic and xenomorphic granular textures and banded or striped structures. The stripes or bands are often strongly crumpled.
Stilpnomelane magnetite quartzite is greyish black. The predominant minerals include magnetite (22–30.9 %), stilpnomelane (21.3–31.1 %) and quartz (23.5–35.7 %). The ores exhibit a silky lustre and a banded-striped structure (Fig. 5i). Dark bands comprise magnetite-joined crystals and contain a few gangue minerals. Light bands comprise quartz and stilpnomelane. Most stilpnomelane forms fibrous aggregates and is densely distributed. The quartz crystals exhibit xenomorphic granular textures. Most grains are 0.02–0.05 mm long, and the coarse grains are 0.08–0.12 mm long. The magnetite in gangue bands occurs as idiomorphic or hypidiomorphic grains that are scattered as disseminations in gangue crystal stock (Fig. 5j).
Stilpnomelane haematite quartzite is brick red with banded structures (Fig. 5k). The predominant metallic minerals include haematite (23 %), magnetite (5.3–9.6 %) and martite (4.5 %). The main gangue minerals include quartz (41.4–48.9 %) and stilpnomelane (15.6–20.1 %). Dark bands predominantly consist of haematite, martite and small amounts of quartz and stilpnomelane. Light bands mostly consist of quartz and stilpnomelane and a small quantity of metallic minerals. The stilpnomelane in light bands is fibrous and disseminated radially in inter-particles of quartz or iron mineral grains (Fig. 5l).
The major surrounding rocks of the Yuanjiacun BIF consist of carbonaceous schist, sericite quartz schist and meta-quartz sandstone.
The carbonaceous schist is greyish black to black with lepidogranoblastic textures and laminated structures (Fig. 4g). This rock is mainly composed of quartz (5–15 %), sericite (20–60 %) and carbonaceous material (5–15 %). Some carbonaceous schist contains a small amount of chlorite (5–15 %). Carbon is present as small star-shaped masses and mixed with sericite. Sericite forms flakes. Quartz presents xenomorphic crystals embedded in sericite aggregates.
The sericite quartz schist is silver white to grey with laminated structures and lepidogranoblastic textures (Fig. 4d). This rock predominantly comprises quartz (40–80 %), sericite (25–60 %) and small amounts of iron minerals and chlorite (Fig. 4h).
The metamorphic quartz sandstone is greyish white with dense block structures and blastopsammitic textures. It is dominated by quartz (>85 %) with obvious undulatory extinction and particle elongation (Fig. 4i). The particle sizes are varied; the coarse particles have diameters of 1–2 mm, and the fine particles have diameters of 0.03–0.01 mm. Small amounts of gravel and iron minerals (>2 mm) occur locally. The predominant cement is siliceous with minor amounts of scaly sericite, biotite and chlorite.
4. Sampling and analytical methods
All samples used for this study were collected from outcrops of the Yuanjiacun BIF and surrounding rocks. After rocks and minerals were identified under the microscope, fresh samples were selected and crushed to filter through 200 mesh. The element analysis was performed at ALS Chemex (Guangzhou) Co. Ltd.
The major-element contents were determined by X-ray fluorescence spectrometry with analytical errors of 1–8 %. The loss of ignition (LOI) was determined using the gravimetric method. The trace-element and rare earth element (REE) contents were determined by inductively coupled plasma mass spectrometry (ICP-MS). The accuracy of the measured concentrations was within 5–10 %.
The chemical separation and determination of the Fe isotope compositions of magnetite and haematite were performed at the ALS Scandinavia Laboratory in Stockholm, Sweden. Sample preparation was carried out in a clean room, and all other critical work, including sample dissolution and purification, was completed in class 100 laminar flow hoods. Samples (0.100 g) were dissolved in 6 ml aqua regia in Teflon beakers for 72 h at 140 °C. All digested samples were left on a hot plate at 80 °C to evaporate to dryness; this procedure was repeated three times using 0.5 ml concentrated hydrochloric acid in order to remove any remaining nitric acid and hydrofluoric acid. Each dry sample was then dissolved in 4 ml 7 M hydrochloric acid for chemical purification, with the iron and other elements separated by ion-exchange chromatography. Finally, the purified iron underwent three dissolutions using 0.5 ml of concentrated nitric acid, with each dissolution followed by evaporation to dryness to remove chloride ions. The final iron eluate was dissolved in 1 % nitric acid to achieve a concentration of 3 ppm for isotope analysis; the iron recoveries for all standard samples were 98–101 %. Iron isotope ratios were determined in high-resolution mode using a Thermo Scientific Neptune multi-collector ICP-MS (MC-ICP-MS). Mass fractionation was calibrated by standard-sample bracketing. The analytical results of Fe isotopes were expressed as per mil deviations relative to the IRMM-014 standard as follows:
 $${{\rm{\delta }}^{{\rm{56}}}}{\rm{F}}{{\rm{e}}_{{\rm{IRMM - 014}}}}{\rm{ = }}\left[ {{{\left( {^{{\rm{56}}}{\rm{Fe}}{{\rm{/}}^{{\rm{54}}}}{\rm{Fe}}} \right)}_{{\rm{sample}}}}{\rm{/ }}{{\left( {^{{\rm{56}}}{\rm{Fe}}{{\rm{/}}^{{\rm{54}}}}{\rm{Fe}}} \right)}_{{\rm{IRMM - 014}}}}{\rm{ - 1}}} \right]{\rm{ \times 1000}}$$
 $${{\rm{\delta }}^{{\rm{57}}}}{\rm{F}}{{\rm{e}}_{{\rm{IRMM - 014}}}}{\rm{ = }}\left[ {{{\left( {^{{\rm{57}}}{\rm{Fe}}{{\rm{/}}^{{\rm{54}}}}{\rm{Fe}}} \right)}_{{\rm{sample}}}}{\rm{/ }}{{\left( {^{{\rm{57}}}{\rm{Fe}}{{\rm{/}}^{{\rm{54}}}}{\rm{Fe}}} \right)}_{{\rm{IRMM - 014}}}}{\rm{ - 1}}} \right]{\rm{ \times 1000}}$$
The analytical precision of the δ56Fe and δ57Fe measurements was 0.08 ‰ (2 SD) and 0.14 ‰ (2 SD), respectively.
The chemical separation and determination of Si and O isotope compositions were undertaken at the ALS Scandinavia Laboratory in Stockholm, Sweden. The Si and O isotope analyses were performed in the same sample preparation unit. At ∼550 °C, quartz was reacted with BrF5 to produce O2 and SiF4. SiF4 and BrF5 were separated from O2 by liquid nitrogen. At 700 °C, O2 was reacted with kryptol and was converted into CO2, which was collected in a sample tube. The liquid nitrogen was then replaced by Drikold-acetone cooling liquid (−78 °C) to freeze impure gas (e.g. BrF5 and BrF3) and release SiF4. The SiF4 released at this stage was frozen by a liquid nitrogen cold trap and then distilled and purified using Drikold-acetone cooling liquid at low temperature (which was repeated three times). The distilled SiF4 may possibly still contain trace amounts of BrF5 and other active fluorides. These impurities would react with the sample tube glass and piston oil on the piston to produce interfering impurities (e.g. SiF4 and CF4) that could influence the measurements of silicon isotopes. To overcome this problem, we ran SiF4 containing trace amounts of impurities through a tube filled with zinc granules and heated it to 70 °C; BrF5 and other active fluorides reacted with the zinc granules and were removed. Because of its relatively high stability, SiF4 did not react with the zinc granules and thus was purified. The oxygen and silicon isotope ratios were measured using a Thermo Finnigan mass spectrometer. The results are expressed in δ notation using V-SMOW and NBS-28 as the standards as follows:
 $${{\rm{\delta }}^{{\rm{18}}}}{{\rm{O}}_{{\rm{V - SMOW}}}}{\rm{ = }}\left[ {{{\left( {^{{\rm{18}}}{\rm{O}}{{\rm{/}}^{{\rm{16}}}}{\rm{O}}} \right)}_{{\rm{sample}}}}{\rm{/ }}{{\left( {^{{\rm{18}}}{\rm{O}}{{\rm{/}}^{{\rm{16}}}}{\rm{O}}} \right)}_{{\rm{V - SMOW}}}}{\rm{- 1}}} \right]{\rm{ \times 1000}}$$
 $${{\rm{\delta }}^{{\rm{30}}}}{\rm{S}}{{\rm{i}}_{{\rm{NBS - 28}}}}{\rm{ = }}\left[ {{{\left( {^{{\rm{30}}}{\rm{Si}}{{\rm{/}}^{{\rm{28}}}}{\rm{Si}}} \right)}_{{\rm{sample}}}}{\rm{/ }}{{\left( {^{{\rm{30}}}{\rm{Si}}{{\rm{/}}^{{\rm{28}}}}{\rm{Si}}} \right)}_{{\rm{NBS - 28}}}}{\rm{- 1}}} \right]{\rm{ \times 1000}}$$
The analytical precisions of the δ18O and δ30Si measurements were 0.2 ‰ (1 SD) and 0.1 ‰ (1 SD), respectively, based on repeated measurements of standard samples.
5. Results
5.a Major elements
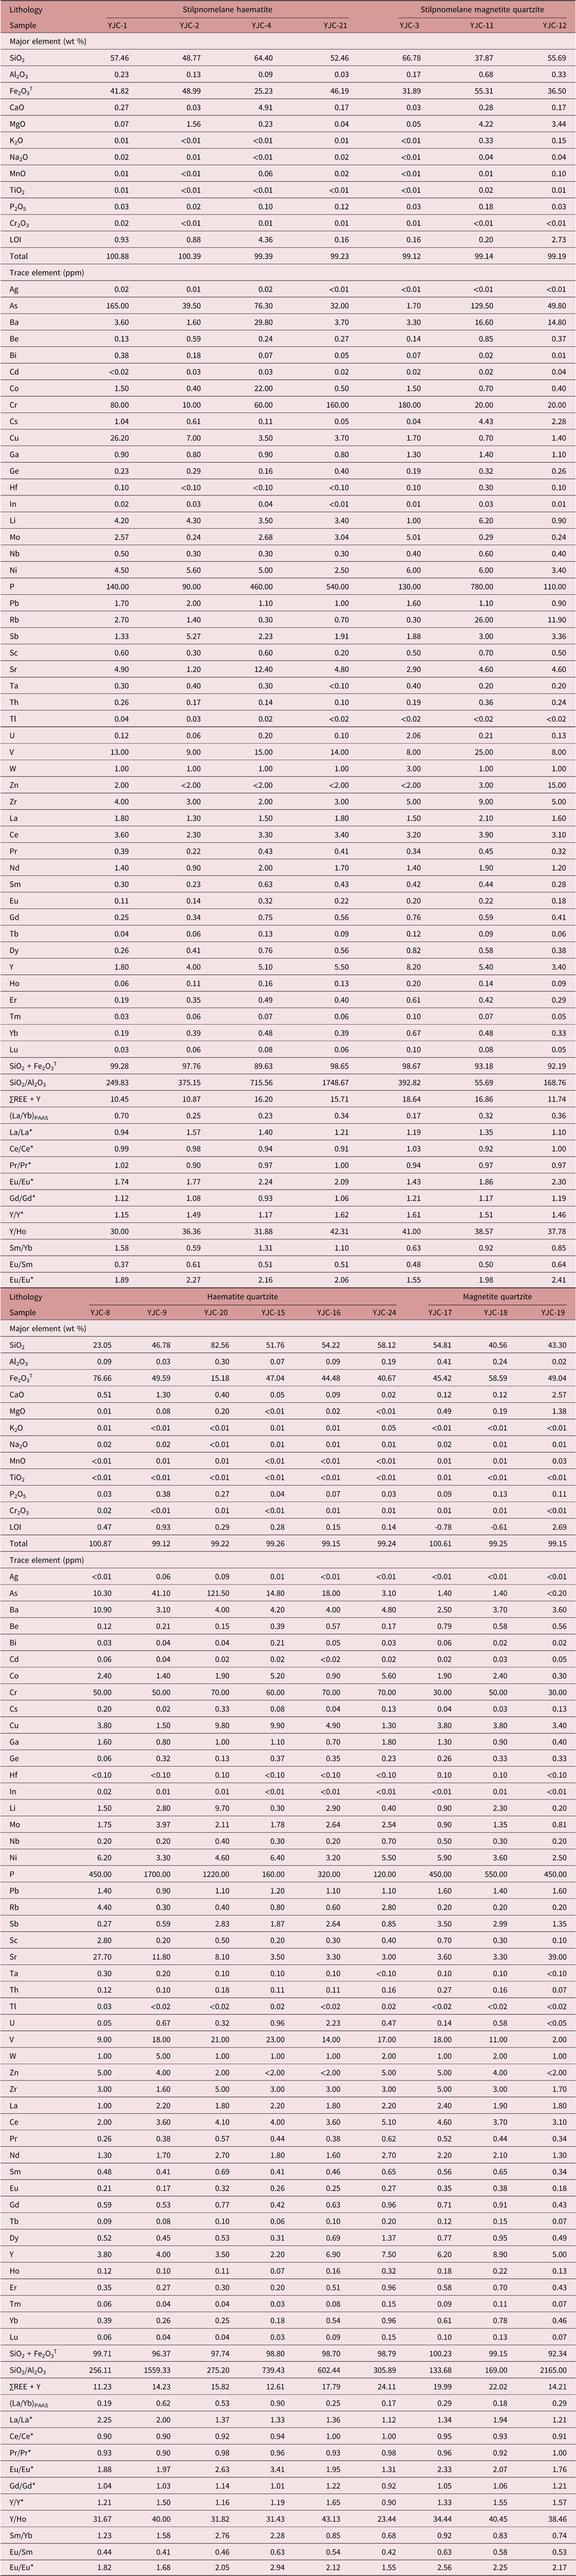
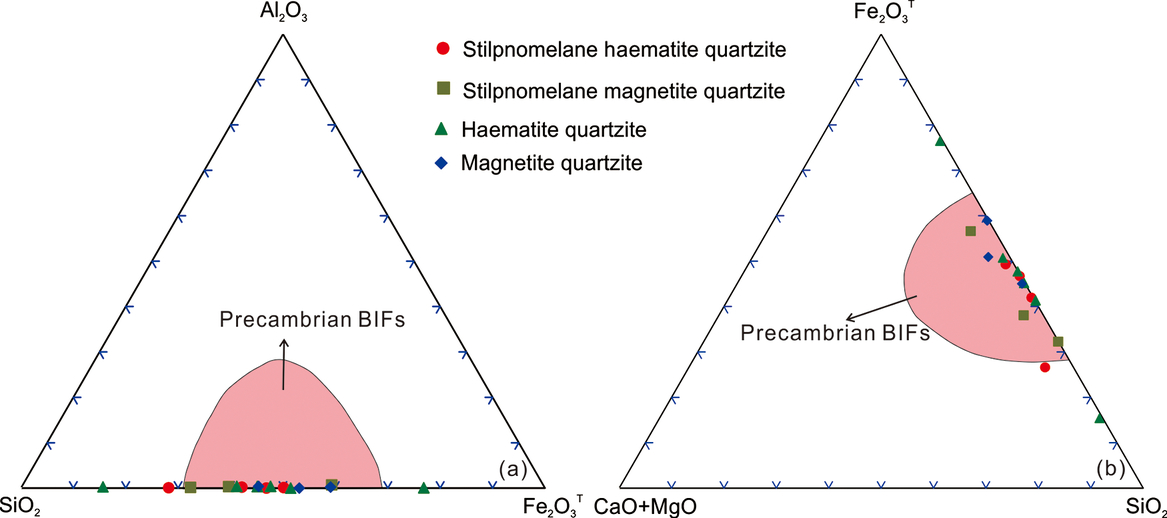
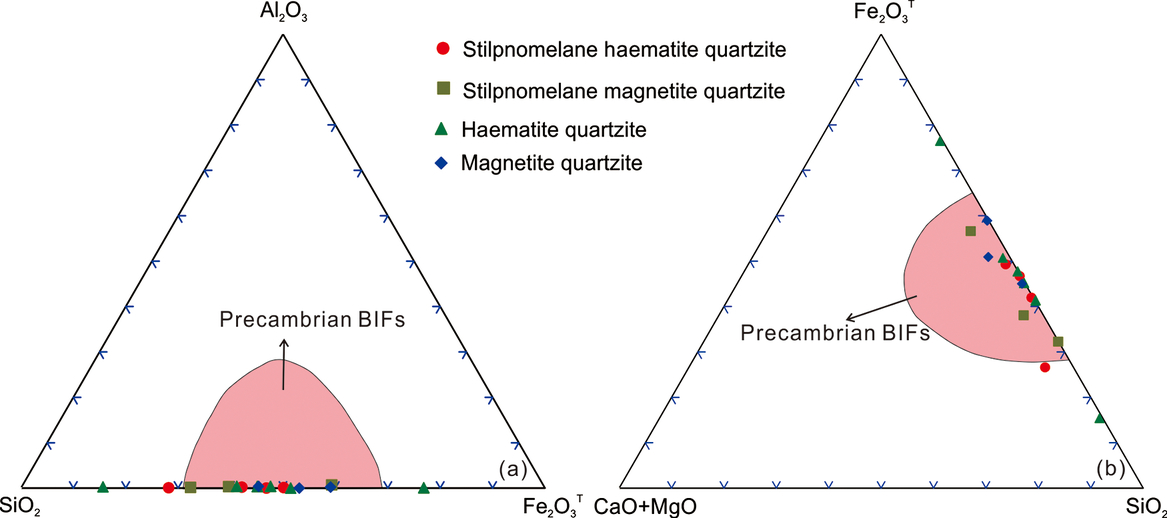
The results of major-element analyses of the Yuanjiacun BIF are shown in Table 1. The contents of SiO2 + Fe2O3 T range from 89.63 % to 100.23 % with an average value of 96.7 %, which indicates that SiO2 and Fe2O3 T are major oxides and show a negative linear correlation. The average contents of Al2O3, CaO and MgO are less than 1 %. The contents of K2O, Na2O, MnO, TiO2 and P2O5 are mostly less than 0.05 %. On the diagrams of Al2O3–SiO2–Fe2O3 T (Lepp & Goldich, Reference Lepp and Goldich1964) and Fe2O3 T–(CaO + MgO)–SiO2 (Govett, Reference Govett1966), the samples predominantly plot in the Precambrian BIF region (Fig. 6), indicating that the major-element components of the Yuanjiacun BIF are similar to those of BIFs worldwide.
Major- and trace-element compositions of the Yuanjiacun BIF

La/La* = LaPAAS/(3 × PrPAAS − 2 × NdPAAS); Ce/Ce* = 2 × CePAAS/(LaPAAS + PrPAAS); Pr/Pr* = 2 × PrPAAS/(CePAAS + NdPAAS); Y/Y* = 2 × YPAAS/(DyPAAS + HoPAAS), after Bolhar et al. (Reference Bolhar, Kamber, Moorbath, Fedo and Whitehouse2004); Eu/Eu* = EuPAAS/(0.67 × SmPAAS + 0.33 × TbPAAS), after Bau & Dulski (Reference Bau and Dulski1996); PAAS values after McLennan (Reference McLennan1989).
Major-element components of the Yuanjiacun BIF: (a) after Lepp & Goldich (Reference Lepp and Goldich1964); (b) after Govett (Reference Govett1966).
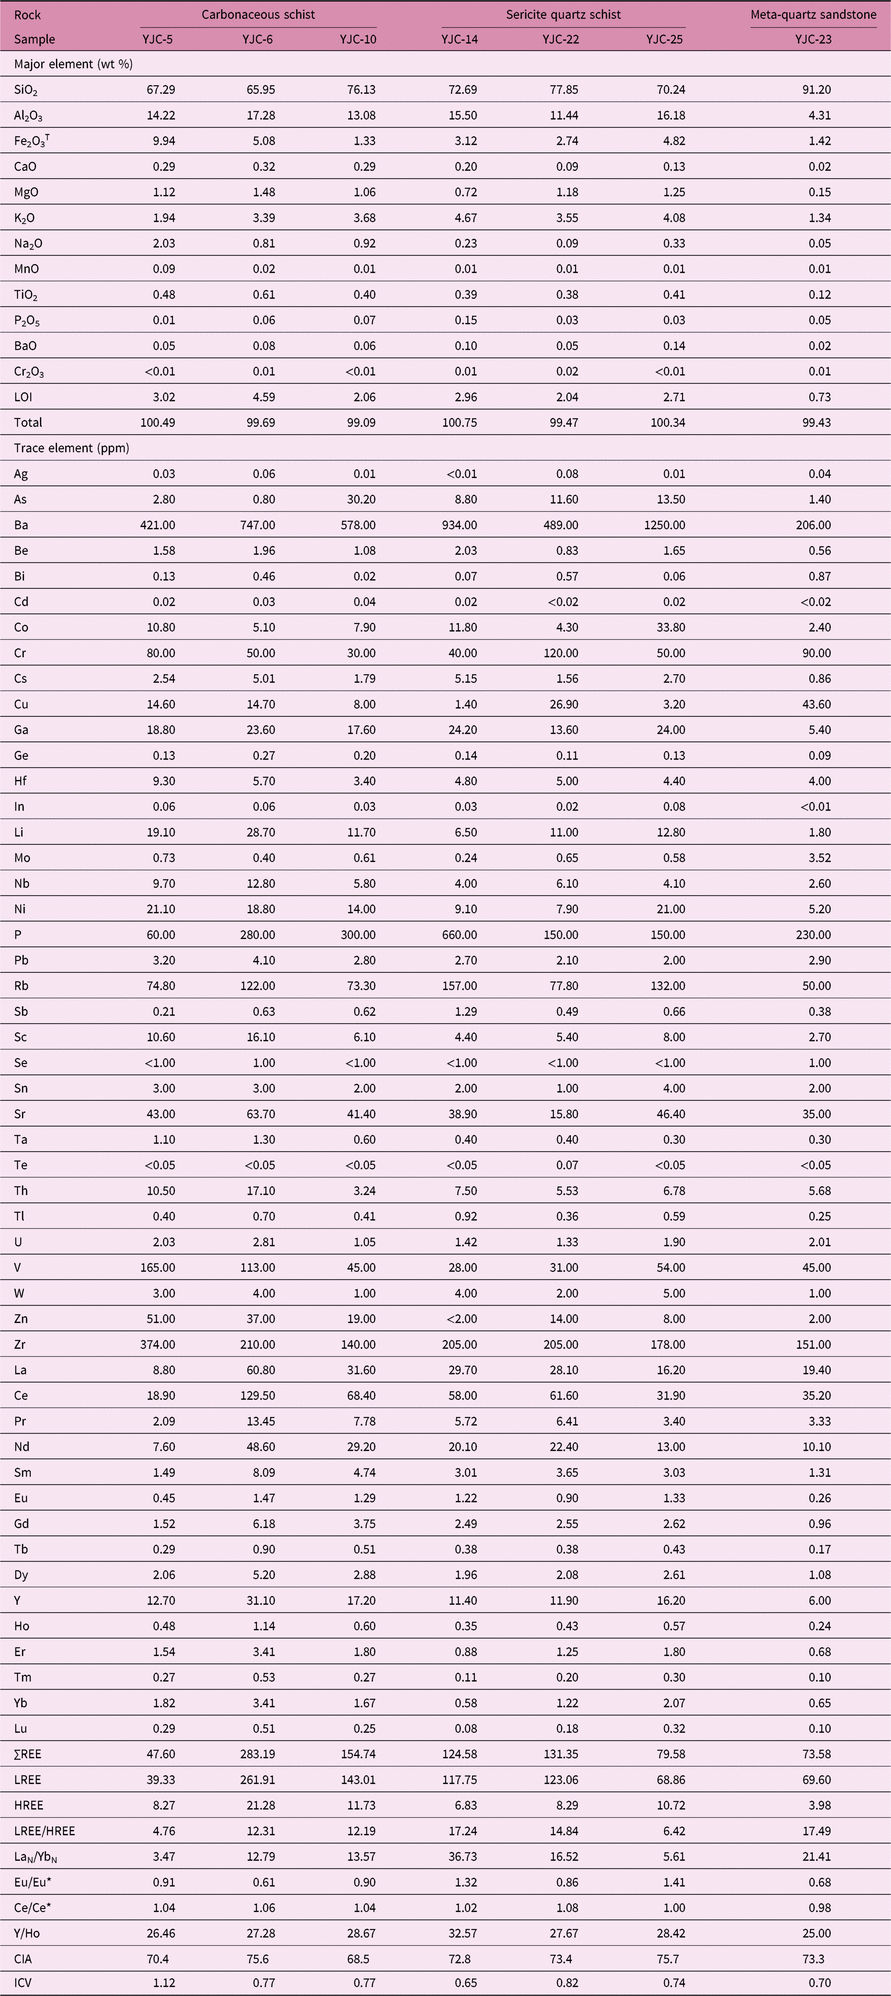
The major elements of the surrounding rocks are dominated by SiO2, Al2O3, Fe2O3 T and K2O (Table 2). The other oxide contents are mostly less than 1 %.
Major- and trace-element compositions of surrounding rocks

Ce/Ce* = 2 × CeN/(LaN + PrN); Eu/Eu* = 2EuN/(SmN + GdN); chondrite values after Sun & McDonough (Reference Sun, McDonough, Saunders and Norry1989); CIA = (Al2O3/(Al2O3 + CaO + Na2O + K2O)) × 100 (molecular proportions), where CaO represents Ca in silicate-bearing minerals (Nesbitt & Young, Reference Nesbitt and Young1982); ICV = (Fe2O3 + K2O + Na2O + CaO + MgO + TiO2)/Al2O3 (Cox et al. Reference Cox, Lowe and Cullers1995).
5.b Trace elements
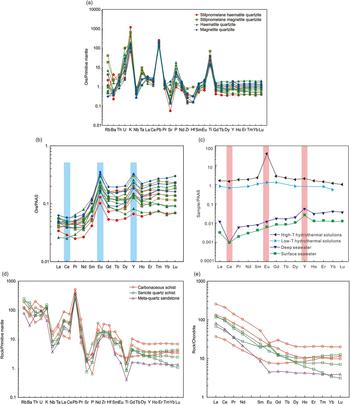
The contents of trace elements in the Yuanjiacun BIF are mostly less than 10 × 10−6 (Table 1). On the primitive mantle-normalized spider diagram (Fig. 7a), large ion lithophile elements (LILEs) such as Rb and Ba and high field strength elements (HFSEs) such as Th, U, Ta and Ti are enriched. The contents of transition metals such as Sc, V, Cr, Co and Cu are relatively low.
The contents of trace elements in the surrounding rocks are higher than those in the BIF (Table 2). On the primitive mantle-normalized spider diagram (Fig. 7d), LILEs such as Rb and Ba and HFSEs such as Th, U, Ta, Nb, Zr and Hf are enriched.
(a) Primitive mantle-normalized trace-element spider diagram for the Yuanjiacun BIF (primitive mantle values after Sun & McDonough, Reference Sun, McDonough, Saunders and Norry1989). (b) PAAS-normalized REE pattern diagram of the Yuanjiacun BIF (PAAS values after McLennan, Reference McLennan1989). (c) PAAS-normalized REE patterns for average hydrothermal fluids (× 105) and seawater (× 105). Average of high-T hydrothermal solutions from the Mid-Atlantic Ridge and East Pacific Rise (Douville et al. Reference Douville, Bienvenu, Charlou, Donval, Fouquet, Appriou and Gamo1999); low-T hydrothermal solutions after Michard et al. (Reference Michard, Michard, Stüben, Stoffers, Cheminée and Binard1993); average of deep seawater from East Pacific Rise (∼2500 m: Klinkhammer et al. Reference Klinkhammer, Elderfield and Hudson1983; Bau et al. Reference Bau, Dulski and Mőller1995; 1000–2000 m: Bau & Dulski, Reference Bau and Dulski1996); surface seawater from north Pacific Ocean (Alibo & Nozaki, Reference Alibo and Nozaki1999). (d) Primitive mantle-normalized trace-element spider diagram for surrounding rocks. (e) Chondrite-normalized REE pattern for surrounding rocks (chondrite normalization values after Sun & McDonough, Reference Sun, McDonough, Saunders and Norry1989).

5.c Rare earth elements
The total contents of ΣREE + Y in the Yuanjiacun BIF range from 11.23 × 10⁻⁶ to 24.11 × 10⁻⁶, with an average value of 15.78 × 10⁻⁶ (Table 1). After normalization to the post-Archaean Australian shale (PAAS; McLennan, Reference McLennan1989), the REE distribution curves show basically consistent characteristics (Fig. 7b), including light REE (LREE) depletion, heavy REE (HREE) enrichment, positive La anomalies, unobvious Pr anomalies, obvious positive Eu anomalies, positive Y anomalies and unobvious Ce anomalies. The Y/Ho ratios range from 23.44 to 43.13 with an average value of 35.80.
The total REE contents of the surrounding rocks range from 47.60 × 10⁻⁶ to 283.19 × 10⁻⁶, with an average value of 127.80 × 10⁻⁶ (Table 2). After normalization to chondrite, the REE distribution curves exhibit the obvious characteristic of right-hand deviation (Fig. 7e). The LREE/HREE ratios range from 4.76 to 17.49. The (La/Yb)N values range from 3.47 to 36.73. Light and heavy REE fractionation is obvious with strong LREE enrichment. The Ce anomalies are extremely weak. The Eu anomalies have a large variation range, with Eu/Eu* = 0.61–1.41 and an average value of 0.96.
5.d Iron, silicon and oxygen isotopes
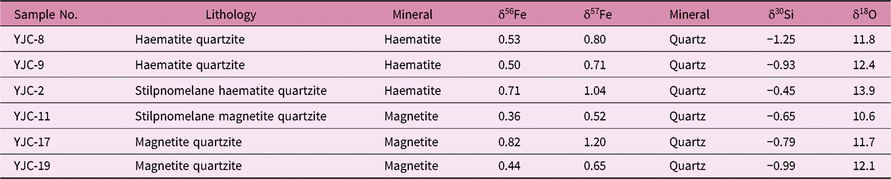
The results of the Fe, Si and O isotope analyses are shown in Table 3. The δ56Fe values range from 0.36 to 0.82 ‰ with an average value of 0.56 ‰. All of these values are positive, which indicates that the Yuanjiacun BIF records enriched heavy iron isotopes.
Iron isotope compositions of iron oxides and silicon and oxygen isotope compositions of quartz

56Fe/54Fe in IRMM-014 = 15.6911 (Finlayson et al. Reference Finlayson, Konter and Ma2015); 57Fe/54Fe in IRMM-014 = 0.391947 (Dideriksena et al. Reference Dideriksena, Baker and Stipp2008); 30Si/28Si in NBS-28 = 0.0335336 (Valkiers et al. Reference Valkiers, Ding, Inkret, Ruße and Taylor2005);18O/16O in V-SMOW = 2005.2 × 10−6 (Wise & Watters, Reference Wise and Watters2005); the δ56FeIRMM-014 values in the standard samples of BCR-2 and BIR-1 were 0.10 ± 0.07 ‰ and 0.03 ± 0.08 ‰ for δ56Fe, respectively, by this analytical method.
The values of δ30SiNBS-28 are small, varying from −0.45 to −1.25 ‰ with an average value of −0.84 ‰. The δ18OV-SMOW values range from 10.6 to 13.9 ‰ with an average value of 12.1 ‰.
6. Discussion
6.a Provenance and tectonic setting
The surrounding rocks of the Yuanjiacun BIF have undergone greenschist-facies metamorphism. Many elements in metamorphic rocks are mobilized by interactions with fluids, melt generation and solid-state diffusion (Rollinson, Reference Rollinson1993). However, the mobility of elements is mainly controlled by fluids, and the effect of solid-state diffusion of elements in metamorphic rocks is negligible (Rollinson, Reference Rollinson1993). Thus, the element ratios of meta-sedimentary rocks are only weakly affected by even higher-grade metamorphism, suggesting that using such a ratio in conjunction with trace-element data can be useful for discriminating the provenance and the tectonic setting (Fralick & Kronberg, Reference Fralick and Kronberg1997; Roser & Korsch, Reference Roser and Korsch1986) of the Yuanjiacun BIF.
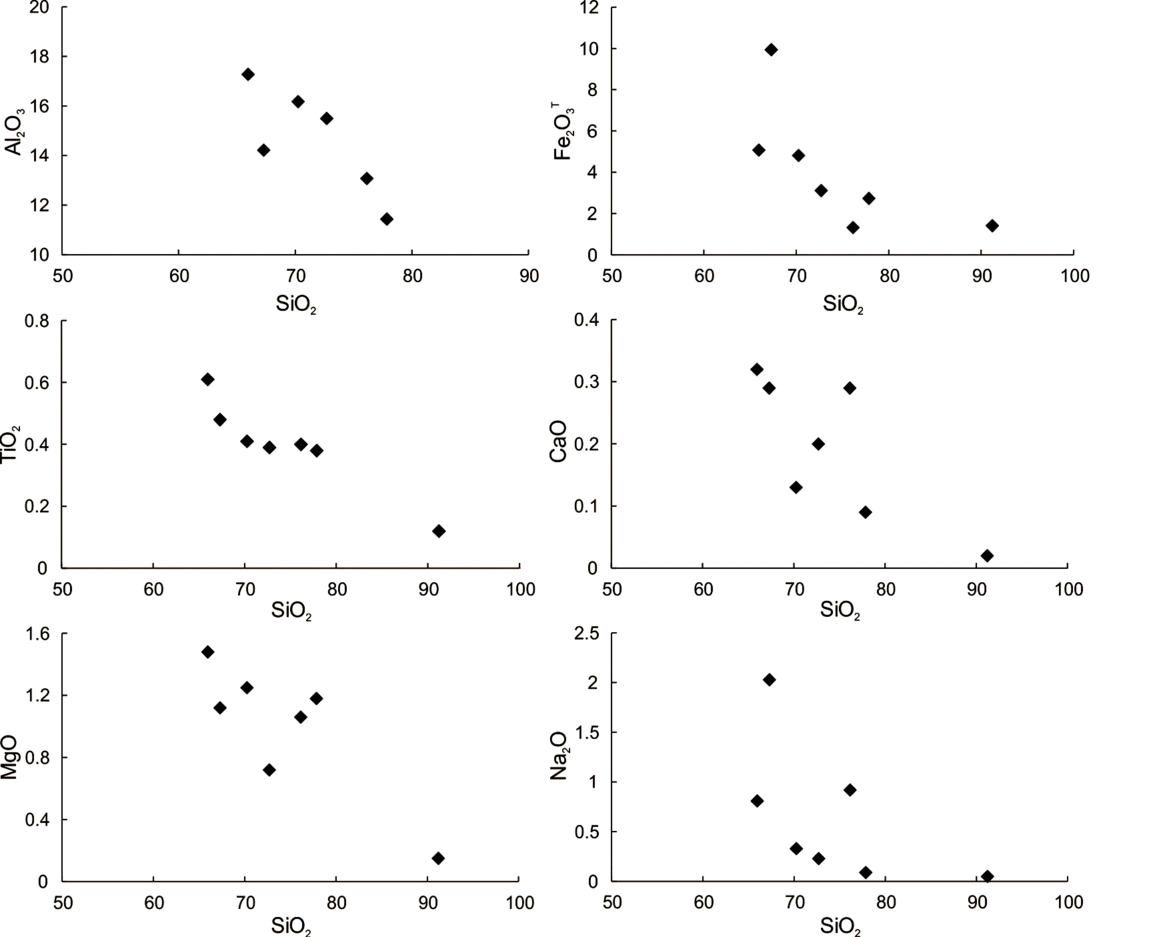
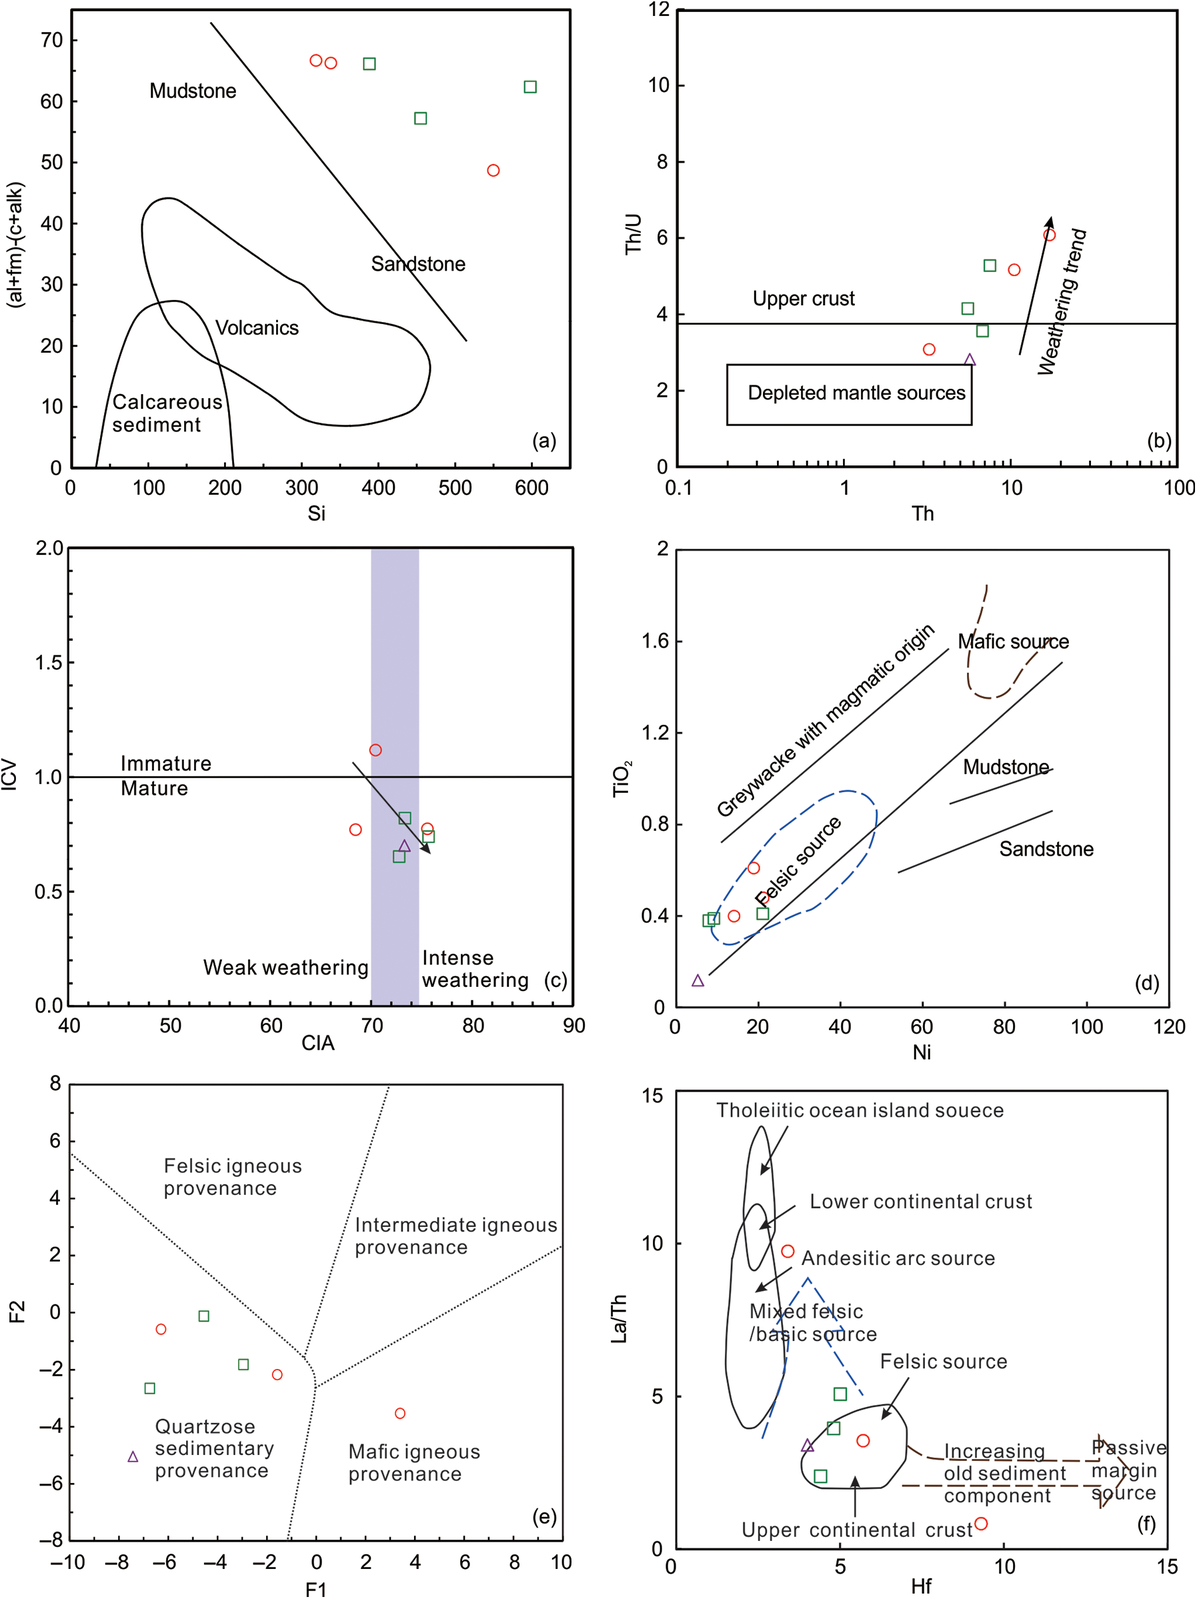
On Harker diagrams (Fig. 8), the contents of SiO2 in the surrounding rocks are significantly negatively correlated with those of Al2O3, Fe2O3 T, TiO2, MgO and CaO and weakly negatively correlated with that of Na2O, indicating that the meta-sedimentary rocks of the Yuanjiacun Formation are para-metamorphic rocks. The increase in the SiO2 content on the Harker diagram reflects an increase in the mineralogical maturity of the rocks (Bhatia, Reference Bhatia1983). The SiO2 content increases from the carbonaceous schist to the meta-quartz sandstone (Table 2), indicating that the maturity gradually increases as the contents of unstable components (debris and feldspar) decrease. Index of compositional variability (ICV) values can be used to determine the compositional maturity of sedimentary rocks (Cox et al. Reference Cox, Lowe and Cullers1995). Compositionally, immature sedimentary rocks usually have high ICV values (>1), indicating their tendency to occur in tectonically active settings and represent characteristically first-cycle deposits. However, compositionally mature sedimentary rocks usually have low ICV values (<1) and are characteristic of tectonically quiescent or cratonic settings (Cox et al. Reference Cox, Lowe and Cullers1995). The ICV values of the surrounding rocks are less than 1 (Table 2), indicating that these rocks are compositionally mature and derived from tectonically quiescent or cratonic environments. The average ICV values decrease from the carbonaceous schist (0.89) to the meta-quartz sandstone (0.70; Table 2), indicating that maturity gradually increases. On the (al + fm)–(c + alk)/Si diagram (Simonen, Reference Simonen1953), all samples plot in the areas of mudstone and sandstone, which indicates that their protoliths are predominantly argillaceous and arenaceous sedimentary rocks (Fig. 9a).
Harker diagrams for the surrounding rocks.

(a) Diagrams for discriminating the protoliths of the surrounding rocks (after Simonen, Reference Simonen1953). (b) Th/U–Th diagram for the surrounding rocks (after McLennan et al. Reference McLennan, Hemming, McDaniel and Hanson1993). (c) ICV–CIA diagram for the surrounding rocks (after Nesbitt & Young, Reference Nesbitt and Young1982; Cox et al. Reference Cox, Lowe and Cullers1995). (d) TiO2–Ni diagram for metamorphic detrital rocks (after Floyd et al. Reference Floyd, Winchester and Park1989). (e) F1–F2 discrimination function diagram for the provenance signatures of metamorphic detrital rocks (after Roser & Korsch, Reference Roser and Korsch1988). (f) La/Th–Hf diagram of the surrounding rocks (after Floyd & Leveridge, Reference Floyd and Leveridge1987).

The Th/U value can indicate the processes of weathering and precipitation (McLennan & Taylor, Reference McLennan and Taylor1991). With successive cycles of weathering and resedimentation, the Th/U values increases. The Th/U values of the surrounding rocks range from 2.83 to 6.09 with an average value of 4.31, which is higher than the average value in the upper crust (3.8; McLennan & Taylor, Reference McLennan and Taylor1980; Fig. 9b). This result suggests that these sedimentary rocks underwent intense weathering. The chemical index of alteration (CIA) provides a useful measure of the weathering degree of the sedimentary protoliths. Unweathered rocks generally have low CIA values (<50), whereas rocks that experienced intense weathering produce high CIA values close to 100 (Nesbitt & Young, Reference Nesbitt and Young1982). The CIA values of the surrounding rocks range from 68.5 to 78.7 with an average value of 72.8 (Fig. 9c), indicating that the source rocks underwent relatively intermediate-intense weathering.
The Cr/Zr and Th/Sc ratios are sensitive indicators of crustal evolution and can be used to assess the relative contents of mafic and felsic components (Wronkeiwicz & Condie, Reference Wronkeiwicz and Condie1989; McLennan & Taylor, Reference McLennan and Taylor1991). The Cr/Zr ratios range from 0.20 to 0.60 with an average value of 0.33; the Th/Sc ratios range from 0.53 to 2.10 with an average value of 1.18. These ratios indicate that the source rocks contained negligible mafic components and that the sediments were predominantly derived from felsic rocks. On the Ni–TiO2 diagram, the samples concentrate in the felsic source field far from the mafic source field, indicating that their provenance is felsic source rocks (Fig. 9d). Roser & Korsch (Reference Roser and Korsch1988) proposed an F1–F2 diagram to identify the provenance of clastic rocks. On this diagram, all samples plot in the area of quartzose sedimentary provenance, which contains high-maturity recycled sedimentary rocks (Fig. 9e). This result indicates that the provenance of the metamorphic rocks was pre-existing high-maturity sedimentary rocks. On the La/Th–Hf provenance discrimination diagram (Floyd & Leveridge, Reference Floyd and Leveridge1987), the samples mainly plot in and around the upper crust and felsic source regions, and only a few samples exhibit the characteristics of ancient sediment and andesitic island arc compositions (Fig. 9f). This result suggests that the source materials were predominantly upper crust felsic sedimentary rocks and that a few rocks with ancient sediment or andesitic island arc igneous compositions were involved in this deposition.
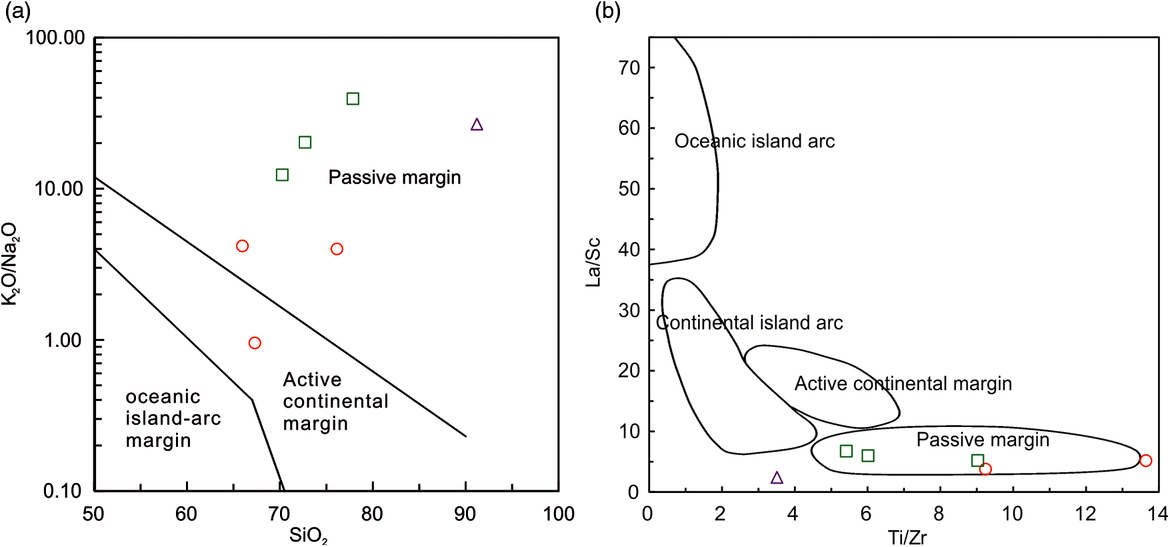
The Yuanjiacun Formation is composed of three ferruginous sections, which are thought to have precipitated in three sedimentary-metallogenic cycles and to have undergone intense weathering based on their aforementioned geochemical characteristics. These characteristics indicate that the surrounding rocks are likely to have formed in a stable cratonic setting. Roser & Korsch (Reference Roser and Korsch1986) proposed that the tectonic setting of sandstone–mudstone suites can be distinguished by the values of K2O/Na2O and the contents of SiO2. On the SiO2–K2O/Na2O diagram, the samples plot in the passive continental margin field (Fig. 10a). The immobile trace elements (e.g. La, Th Y, Zr, Ti, Co and Ni) in clastic sedimentary rocks can also be used to determine the tectonic environment of their formation (Bhatia & Crook, Reference Bhatia and Crook1986). On the Ti/Zr–La/Sc tectonic setting discrimination diagram, all samples plot in and around the passive continental margin region (Fig. 10b), indicating that the Yuanjiacun BIF might have precipitated in a passive continental margin setting.
(a) K2O/Na2O–SiO2 diagram (after Roser & Korsch, Reference Roser and Korsch1986). (b) La/Sc–Ti/Zr diagram (after Bhatia & Crook, Reference Bhatia and Crook1986).

As mentioned above, the Yuanjiacun Formation predominantly comprises metamorphic terrigenous clastic rocks. The protoliths consisted of argillaceous and arenaceous sedimentary rocks, and the predominant provenance was a high-maturity felsic sedimentary terrane. The Jinzhouyu Formation comprises meta-basic volcanic rocks that formed in a volcanic arc setting (Liu et al. Reference Liu, Zhang, Li, Zhang, Wang and Yang2012). The Dujiagou Formation mainly consists of meta-rhyolite, which formed in a continental rift environment (Geng et al. Reference Geng, Yang and Wan2006). The absence of syn-depositional igneous rocks in the Yuanjiacun Formation indicates that its tectonic setting was distinct from those of the Jinzhouyu and Dujiagou formations. Moreover, the Jinzhouyu and Dujiagou formations overlie the Yuanjiacun and Peijiazhuang formations with a parallel unconformity, which is represented by the presence of basal conglomerate located in the lowermost part of the Jinzhouyu Formation (Yu et al. Reference Yu, Wang and Wang1997). This unconformity also indicates a distinct tectonic setting for the Yuanjiacun BIF, which might have precipitated in a stable epicontinental marine setting. This conclusion is consistent with the viewpoint suggested by Zhao et al. (Reference Zhao, Sun, Wilde and Li2005, Reference Zhao, Wilde, Guo, Cawood, Sun and Li2010). In late Archaean to early Palaeoproterozoic times, ancient oceanic crust subducted beneath the western margin of the Eastern Block, resulting in the formation of island and magmatic arcs. Meanwhile, the western margin was a stable passive continental margin setting.
6.b Source of metallogenic materials
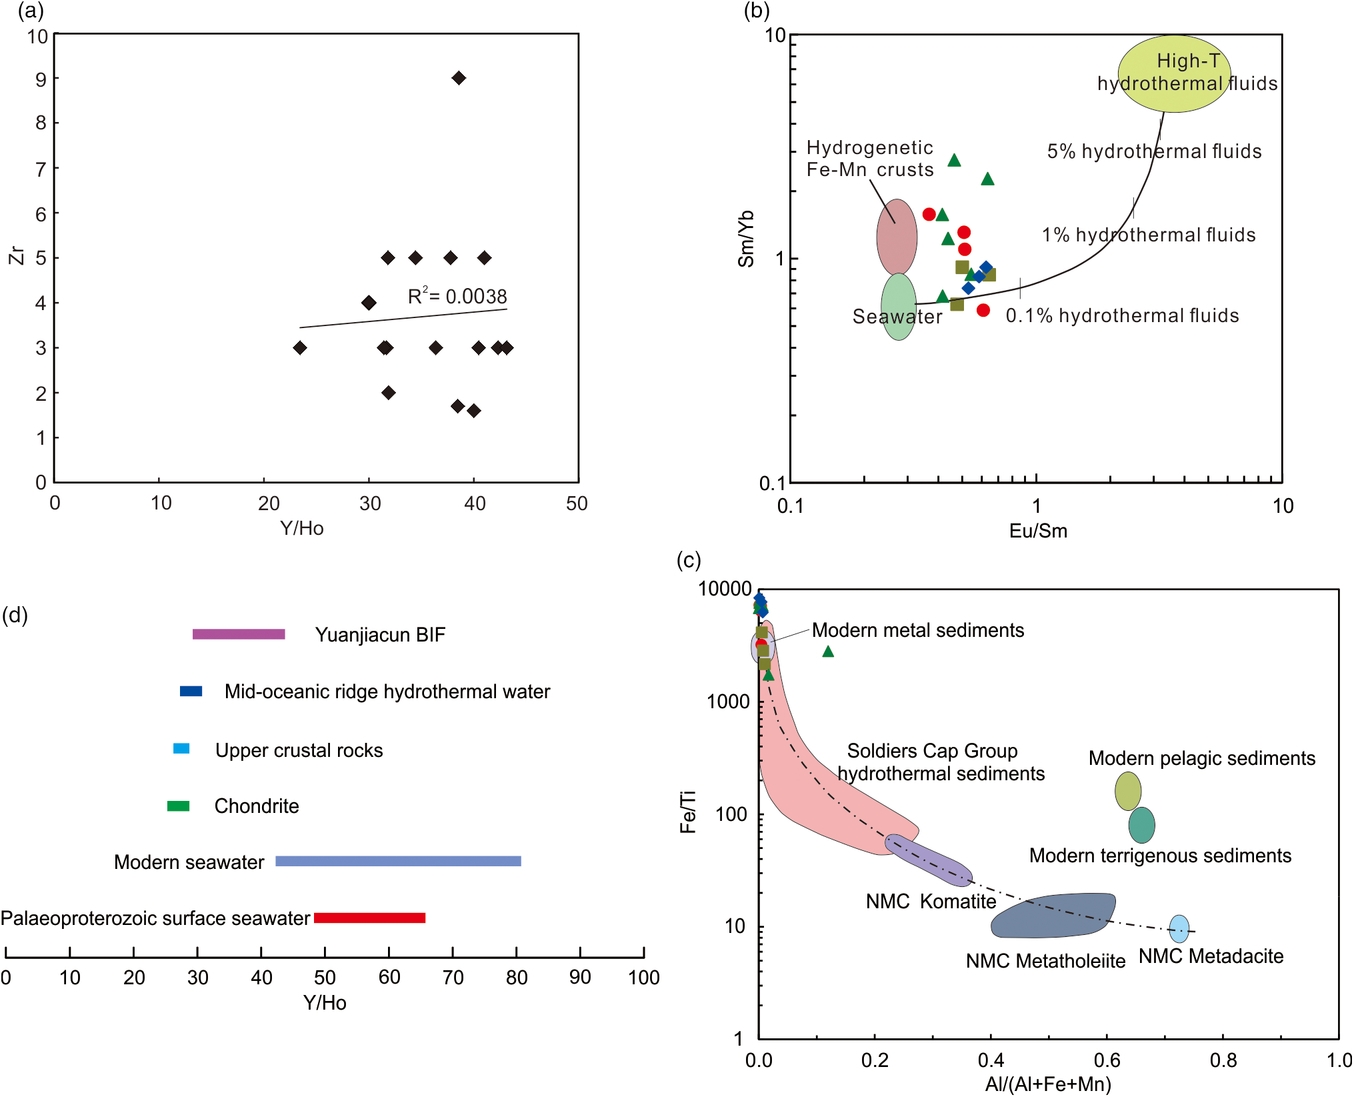
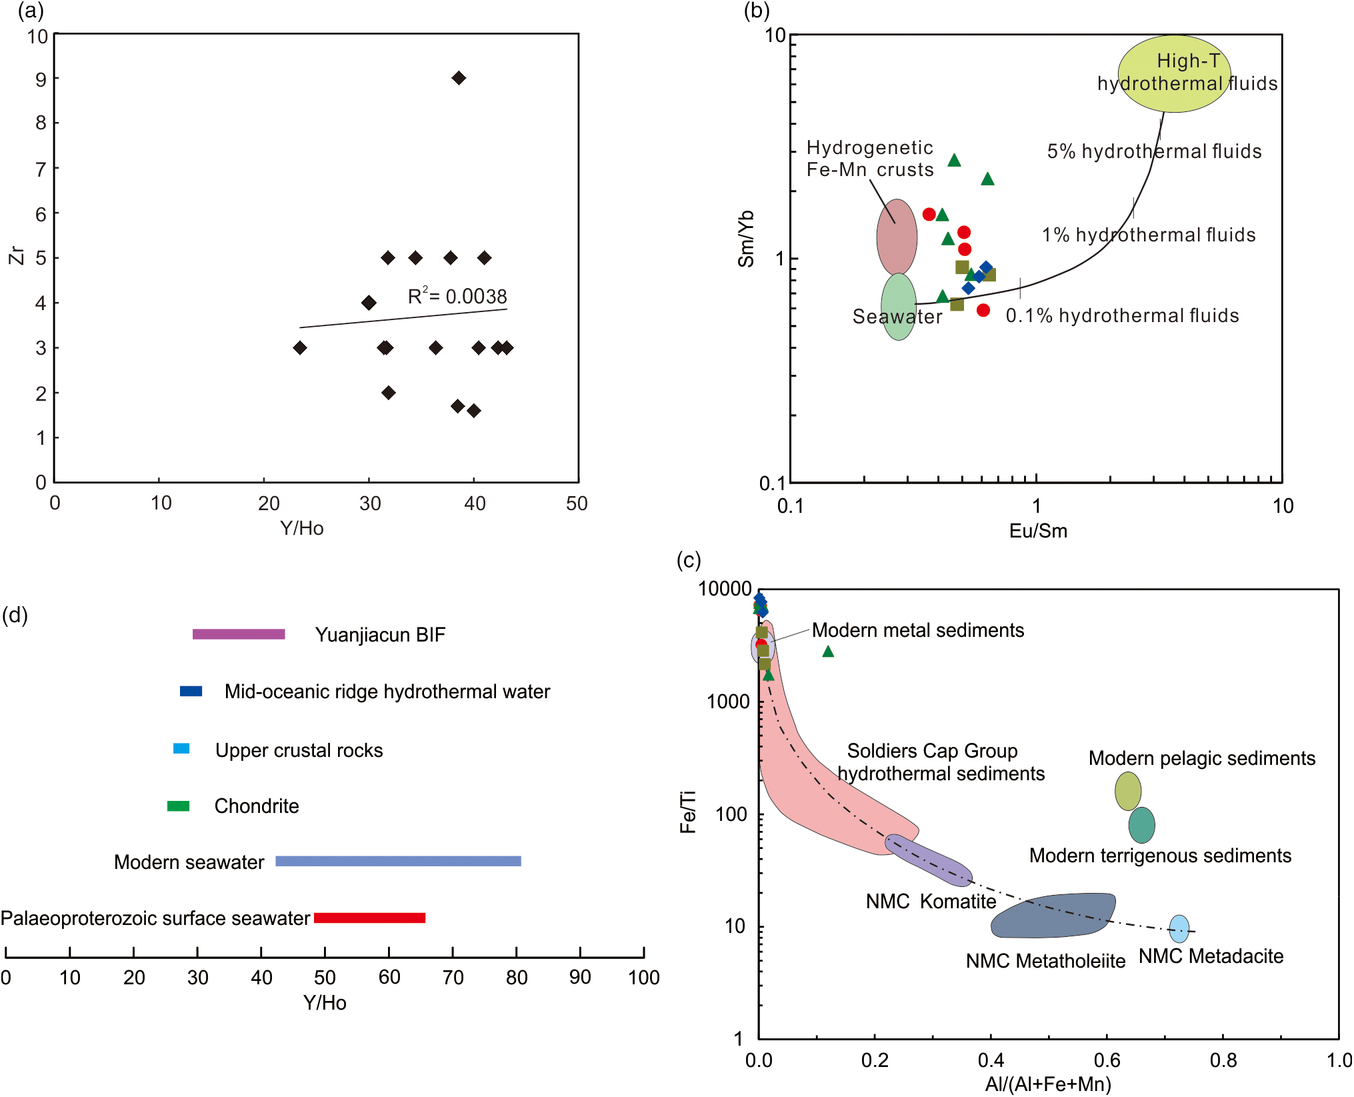
BIFs are generally accepted to have formed by chemical precipitation and are mainly composed of iron oxides and silica with relatively minor amounts of other oxides (James, Reference James1954). However, some BIFs, e.g. the Changyi, Dahongliutang and Huoqiu BIFs, are not entirely pure chemical sediments and commonly involve terrigenous components (Lan et al. Reference Lan, Fan, Hu, Yang, Zheng and Zhang2012; Hu et al. Reference Hu, Wang and Wang2017; Hou et al. Reference Hou, Ma, Li, Liu and Han2017). Many of the major elements (e.g. Al2O3 and TiO2), incompatible elements (e.g. Zr, Sr and Th) and transition elements (e.g. Sc, V, Cr, and Co) can be useful for indicating the contributions of terrigenous clastic materials to a BIF as well as tracing the material sources of the sediments (Shaw, Reference Shaw1980; Calvert & Pedersen, Reference Calvert and Pedersen1993; Bolhar et al. Reference Bolhar, Kamber, Moorbath, Fedo and Whitehouse2004; Shen et al. Reference Shen, Song, Yang and Wan2011). The BIFs containing terrigenous materials would show high contents of these elements. However, the contents of these elements are significantly low in the Yuanjiacun BIF (Table 1; Fig. 7a), indicating that the metallogenic materials might not have been derived from the weathering of felsic rocks. In the Zr–Y/Ho discrimination diagram (Fig. 11a; correlation coefficient, R2 = 0.0038), the samples are distributed discretely, further implying that the Yuanjiacun BIF has not been contaminated by terrigenous materials.
Diagrams for discriminating the sources of metallogenic materials. (a) Zr–Y/Ho diagram. (b) High-temperature hydrothermal component and seawater component mixing model based on Sm/Yb v. Eu/Sm ratios (after Bau & Dulski, Reference Bau and Dulski1999; Alibo & Nozaki, Reference Alibo and Nozaki1999; Alexander et al. Reference Alexander, Bau, Andersson and Dulski2008; Mloszewska et al. Reference Mloszewska, Pecoits, Cates, Mojzsis, O’Neil, Robbins and Konhauser2012). (c) Y/Ho ratios of the Yuanjiacun BIF and materials on the surface of the Earth (after Byrne & Lee, Reference Byrne and Lee1993; Nozaki et al. Reference Nozaki, Zhang and Amakawa1997; Bau & Dulski, Reference Bau and Dulski1999; Bolhar et al. Reference Bolhar, Kamber, Moorbath, Fedo and Whitehouse2004; Robert & Ali, Reference Robert and Ali2007). (d) Fe/Ti–Al/(Al + Fe + Mn) discrimination diagram (after Boström, Reference Boström1973).
In addition, as mentioned in Section 6.a, the protoliths and provenance of the surrounding rocks indicate that the exposed ancient crust near the Yuanjiacun BIF consisted of felsic terrane during the precipitation. However, the weathering of felsic continental crust cannot provide Fe materials for BIF formation (Cloud, Reference Cloud1973; Kholodov & Butuzova, Reference Kholodov and Butuzova2001). The Yuanjiacun BIF formed after the initiation of the Great Oxygenation Event (GOE) with increased oxygen content in the atmosphere (Wang et al. Reference Wang, Zhang, Lan and Dai2014). The Fe in mafic rocks far from the Yuanjiacun BIF was oxidized to Fe3+ by the oxygen in the atmosphere during weathering. Fe3+ cannot dissolve in water to be washed away by rainwater. Therefore, the weathering of the ancient crust did not provide Fe for the formation of the Yuanjiacun BIF under aerobic conditions.
The REEs are particularly accurate tracers for indicating the origin of metallogenic material because of their minimal fractionation during deposition of BIFs and their immobility during post-depositional low-grade metamorphism (Bau & Dulski, Reference Bau and Dulski1996, Reference Bau and Dulski1999; Bekker et al. Reference Bekker, Slack, Planavsky, Krapez, Hofmann, Konhauser and Oliver2010; Zhang et al. Reference Zhang, Zhai, Wan, Guo, Dai, Wang and Liu2012; Hou et al. Reference Hou, Ma, Li, Liu and Han2017). The Yuanjiacun BIF is characterized by LREE depletion, HREE enrichment, and positive La and Y anomalies (Fig. 7b). These characteristics are inherited REE features of seawater (Fig. 7c; Zhang et al. Reference Zhang, Amakawa and Nozaki1994; Alibo & Nozaki, Reference Alibo and Nozaki1999; Bolhar et al. Reference Bolhar, Kamber, Moorbath, Fedo and Whitehouse2004), suggesting that the Yuanjiacun BIF was deposited in seawater.
However, the Yuanjiacun BIF shows positive Eu anomalies (Fig. 7b), which could not be inherited from seawater. Thus, other sources with positive Eu anomalies might have been involved in the deposition of the Yuanjiacun BIF. Research has shown that submarine high-temperature hydrothermal solutions are characterized by intense positive Eu anomalies (Fig. 7c; Danielson et al. Reference Danielson, Möller and Dulski1992; Douville et al. Reference Douville, Bienvenu, Charlou, Donval, Fouquet, Appriou and Gamo1999). The REEs of the Yuanjiacun BIF inherited this characteristic, indicating that hydrothermal solutions might have played an important role in the deposition of the Yuanjiacun BIF. Experimental results have further shown that the REEs of a mixed solution of seawater and hydrothermal fluid at a ratio of 100:1 are characterized by positive Eu anomalies, positive La anomalies, LREE depletion and HREE enrichment (Dymek & Klein, Reference Dymek and Klein1988). The REE characteristics of the Yuanjiacun BIF are in accord with those of mixed fluids. The ratios of (La/Yb)PAAS in hydrothermal fluids are greater than 1, while the mixing of seawater and hydrothermal fluid results in (La/Yb)PAAS ratios less than 1 (Sugitani, Reference Sugitani1992). The (La/Yb)PAAS values of the Yuanjiacun BIF range from 0.17 to 0.70, showing the characteristics of mixed seawater and hydrothermal fluid. On the Sm/Yb–Eu/Sm diagram (Alexander et al. Reference Alexander, Bau, Andersson and Dulski2008; Mloszewska et al. Reference Mloszewska, Pecoits, Cates, Mojzsis, O’Neil, Robbins and Konhauser2012), the samples plot along and over the mixing line of high-temperature hydrothermal fluid and seawater (Fig. 11b). This diagram shows that the deposition of the Yuanjiacun BIF was mainly controlled by the mixing of seawater and hydrothermal fluids.
The Y/Ho ratios of Palaeoproterozoic surface water range from 49 to 65; the Y/Ho ratios of modern seawater range from 43 to 80 and decrease with depth; the Y/Ho ratios of chondrite are 26 to 28; and the Y/Ho ratios of mid-oceanic ridge hydrothermal solutions are 28 to 30 (Byrne & Lee, Reference Byrne and Lee1993; Nozaki et al. Reference Nozaki, Zhang and Amakawa1997; Bau & Dulski, Reference Bau and Dulski1999; Bolhar et al. Reference Bolhar, Kamber, Moorbath, Fedo and Whitehouse2004; Robert & Ali, Reference Robert and Ali2007). The Y/Ho values of the Yuanjiacun BIF range from 23.44 to 43.13, with an average value of 35.80, which is close to values of mid-oceanic ridge hydrothermal solutions and much higher than those of Palaeoproterozoic surface water and modern seawater (Fig. 11c). This result suggests that the metallogenic materials of the Yuanjiacun BIF might have been mainly derived from hydrothermal fluids. On the Fe/Ti–Al/(Al + Fe + Mn) diagram (Boström, Reference Boström1973), the samples of the Yuanjiacun BIF plot in the regions of modern marine metal sediments and hydrothermal sediments, far from the regions of modern pelagic sediments and terrigenous sediments (Fig. 11d). This diagram further indicates that the major components of iron and silica in the Yuanjiacun BIF were derived from hydrothermal solutions erupting from the seafloor. Because of the absence of submarine volcanoes, metallogenic materials might have originated from the leaching of mafic oceanic crust by hydrothermal fluids.
6.c Sedimentary environment
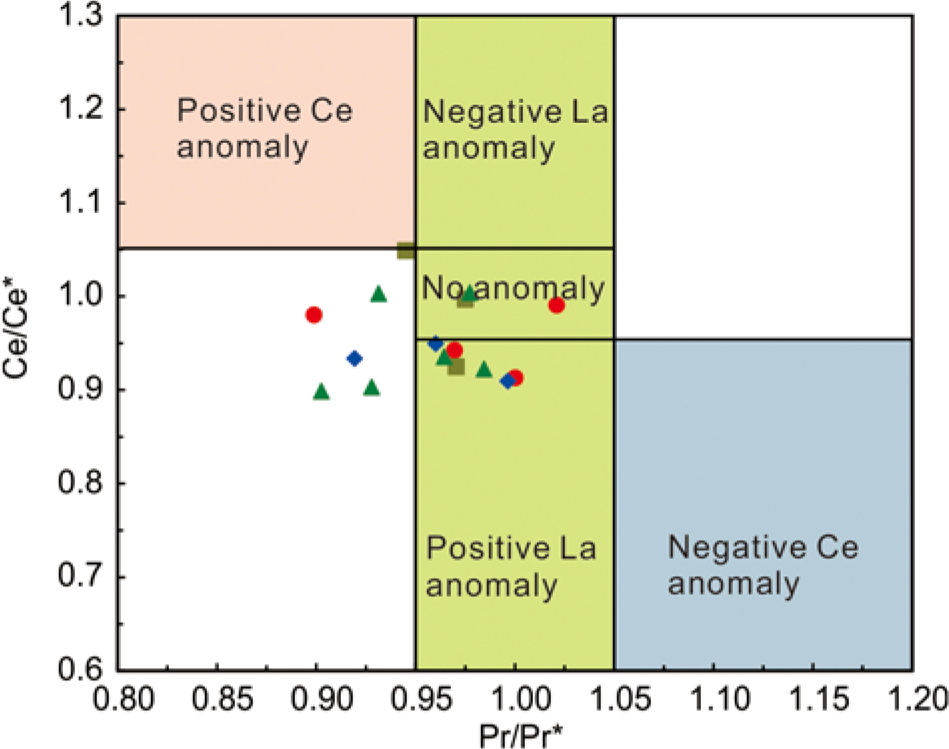
Cerium is very sensitive to oxygen fugacity. In oxidized seawater, Ce3+ is readily oxidized to Ce4+, which has a lower solubility and is adsorbed by hydroxides of Mn and Fe, clay particles and organic matter and then precipitated, thus leading to depletion in Ce (Byrne & Sholkovitz, Reference Byrne, Sholkovitz, Gschneidner and Eyring1996). Therefore, Ce can be used to indicate the redox environment of the palaeo-ocean during the deposition of BIFs (German & Elderfield, Reference German and Elderfield1990). Oxidized seawater normalized to PAAS has obvious negative Ce anomalies, whereas low-oxygen or anoxic seawater has unobvious Ce anomalies (Byrne & Sholkovitz, Reference Byrne, Sholkovitz, Gschneidner and Eyring1996; Nozaki et al. Reference Nozaki, Alibo, Amakawa, Gamo and Hasumoto1999). On the Ce/Ce*–Pr/Pr* diagram (Fig. 12; Bau & Dulski, Reference Bau and Dulski1996), the samples of the Yuanjiacun BIF show unobvious Ce anomalies.
Ce/Ce*–Pr/Pr* discrimination diagram for Ce anomalies (after Bau & Dulski, Reference Bau and Dulski1996).

Experimental analyses indicate that in completely oxidized seawater, Fe almost completely precipitates and iron isotope fractionation does not occur (Bullen et al. Reference Bullen, White, Childs, Vivit and Schulz2001; Balci et al. Reference Balci, Bullen, Witte-Lien, Shanks, Motelica and Mandernack2006). However, in incompletely oxidized seawater, Fe partially precipitates, and isotopic mass fractionation of Fe occurs (Bullen et al. Reference Bullen, White, Childs, Vivit and Schulz2001; Balci et al. Reference Balci, Bullen, Witte-Lien, Shanks, Motelica and Mandernack2006). Compared with the Fe2+ observed in solution, heavy Fe isotopes are enriched in sediments (Bullen et al. Reference Bullen, White, Childs, Vivit and Schulz2001; Balci et al. Reference Balci, Bullen, Witte-Lien, Shanks, Motelica and Mandernack2006; Johnson et al. Reference Johnson, Beard, Klein, Beukes and Roden2008). The magnitude of this Fe isotope fractionation depends on the proportion of Fe precipitates (Li, Z. H. et al. Reference Li, Zhu and Tang2012). A lower proportion of Fe precipitates within seawater leads to BIFs with heavier Fe isotopes, whereas increasing amounts of Fe precipitation should correspond to BIFs with lighter Fe isotope compositions. As a consequence, the Fe isotope composition in BIFs is an indicator that can be used to trace the redox state of the palaeo-ocean (Rouxel et al. Reference Rouxel, Bekker and Edwards2005; Whitehouse & Fedo, Reference Whitehouse and Fedo2007; Anbar & Rouxel, Reference Anbar and Rouxel2007). The δ56Fe values of the BIFs in the Anshan–Benxi area range from 0.08 to 1.27 ‰ with an average value of 0.55 ‰ (Li, Z. H. et al. Reference Li, Zhu and Tang2012), and these values are basically consistent with those of the Yuanjiacun BIF. The positive Fe isotope ratios of the Yuanjiacun BIF indicate that the Fe2+ in palaeo-seawater was partially but not completely oxidized to Fe3+ and that the palaeo-seawater was still reducing during the formation of this BIF. In a redox-stratified ocean, the Yuanjiacun BIF formed in reducing seawater below the oxidation–reduction transition zone.
6.d Metallogenic mechanism
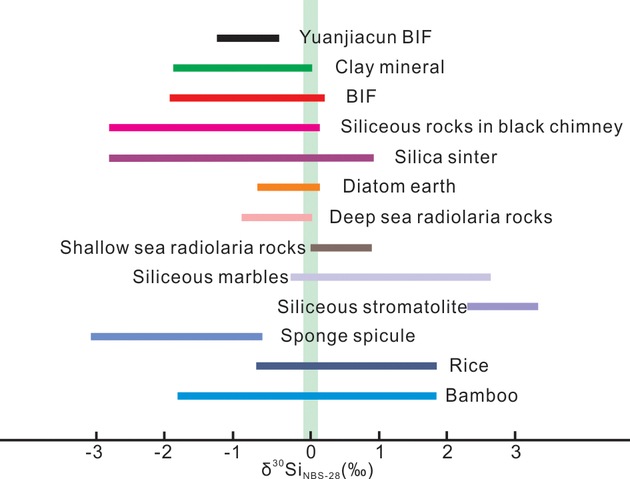
In late Archaean and early Proterozoic times, the temperature of seawater was relatively high (Robert & Chaussidon, Reference Robert and Chaussidon2006), and the concentration of silicon dissolved in seawater might have approached the saturation point (Maliva et al. Reference Maliva, Knoll and Simonson2005). After high-temperature hydrothermal solutions with abundant silicon erupted from the seafloor, the temperature decreased rapidly owing to the mixing of high-temperature hydrothermal solutions with seawater, so that silicon became supersaturated and rapidly precipitated (Li et al. Reference Li, Hou, Wan, Zhang and Yue2014). This process could produce kinetic fractionation of silicon isotopes (Douthitt, Reference Douthitt1982; Li et al. Reference Li, Ding and Wan1995). The δ30SiNBS-28 values of this first precipitated silicon are significantly negative. For example, the δ30SiNBS-28 values of modern black chimneys in the Mariana Trough range from −0.4 ‰ to −3.4 ‰ with an average value of −1.6 ‰; the δ30SiNBS-28 values of sinters in a hot spring at Tengchong, Yunnan Province, range from −0.9 ‰ to −0.2 ‰ (Jiang et al. Reference Jiang, Ding, Wang and Li1993; Li, Y. H. et al. Reference Li, Ding and Wan1995, Reference Li, Hou, Wan and Zhang2012). The δ30SiNBS-28 values of quartz in the Yuanjiacun BIF are obviously depleted, similar to those of black chimneys and hot springs (Fig. 13). In addition, the δ30SiNBS-28 values of other BIFs in the NCC are also obviously depleted. The δ30SiNBS-28 values of the BIFs in the Anshan–Benxi area range from −2.0 ‰ to 0.3 ‰ with an average value of −0.80 ‰; the δ30SiNBS-28 values of the BIFs in Eastern Hebei range from −2.0 ‰ to 0.2 ‰ with an average value of −0.96 ‰ (Jiang et al. Reference Jiang, Ding, Wang and Li1993; Li et al. Reference Li, Hou, Wang, Zhang and Le2010). These values indicate that the genesis of the Yuanjiacun BIF and other BIFs in the NCC may be in accordance with those of black chimneys and hot springs.
Silicon isotopic composition of materials on the surface of the Earth (Douthitt, Reference Douthitt1982; Jiang et al. Reference Jiang, Ding, Wang and Li1993; Ding et al. Reference Ding, Wan, Wang and Zhang2004).

The δ18OV-SMOW values in the Anshan–Benxi area range from 10.5 ‰ to 17.4 ‰ with an average value of 14.1 ‰; the δ18OV-SMOW values in Eastern Hebei range from 11.1 ‰ to 15.9 ‰ with an average value of 13.4 ‰ (Li, Y. H. et al. Reference Li, Hou, Wan and Zhang2012). The δ18OV-SMOW values of the Yuanjiacun BIF and other BIFs in the NCC are basically the same; both are distributed between the ranges of quartz in magmatic rocks and marine siliceous rocks formed at normal temperatures and are similar to the δ18OV-SMOW values of hydrothermal sedimentary siliceous rocks (Li et al. Reference Li, Ding and Wan1995; Ding et al. Reference Ding, Wan, Wang and Zhang2004). Post-depositional metamorphism and hydrothermal fluids could have resulted in the reduction of the δ18OV-SMOW values in quartz (Knauth & Lowe, Reference Knauth and Lowe2003; Knauth, Reference Knauth2005; Robert & Chaussidon, Reference Robert and Chaussidon2006). The Yuanjiacun BIF has undergone greenschist-facies metamorphism, which results in δ18OV-SMOW values in primary quartz that are higher than the measured values. The formation of the Yuanjiacun BIF may be closely related to submarine exhalative sedimentation.
Fe2+ is first oxidized to Fe3+ during the deposition of a BIF (Klein, Reference Klein2005; Dauphas & Rouxel, Reference Dauphas and Rouxel2006). Currently, Fe2+ is considered to be oxidized in one of two ways: biological or non-biological. There are three pathways of biological oxidation: first, abundant cyanobacteria develop in the upper ocean and produce O2 through oxygenic photosynthesis, and the produced O2 oxidizes Fe2+ to Fe3+ (2Fe2+ + 0.5O2 + 5H2O → 2Fe(OH)3 + 4H+) (Rao & Naqvi, Reference Rao and Naqvi1995); second, iron bacteria with high oxidation efficiency use CO2, H2O and only a small amount of O2 to metabolize and oxidize Fe2+ to Fe3+ (6Fe2+ + 0.5O2 + CO2 + 16H2O → CH2O + 6Fe(OH)3 + 12H+) (Bekker et al. Reference Bekker, Slack, Planavsky, Krapez, Hofmann, Konhauser and Oliver2010); third, anaerobic bacteria directly oxidize Fe2+ to Fe3+ through anoxygenic photosynthesis (4Fe2+ + CO2 + 11H2O → CH2O + 4Fe(OH)3 + 8H+) (Kappler et al. Reference Kappler, Pasquero, Konhauser and Newman2005; Heimann et al. Reference Heimann, Johnson, Beard, Valley, Roden, Spicuzza and Beukes2010). The main method of abiological oxidation involves Fe2+ directly oxidizing to Fe3+ under ultraviolet radiation (2Fe(aq) 2+ + 2H+ + hv → 2Fe(aq) 3+ + H2) (Cairns-Smith, Reference Cairns-Smith1978; Braterman et al. Reference Braterman, Cairns-Smith and Sloper1983). However, abiological oxidation is impossible for BIFs (Konhauser et al. Reference Konhauser, Amskold, Lalonde, Posth, Kappler and Anbar2007). The characteristics of the Ce anomalies and iron isotopes in the Yuanjiacun BIF show that the seawater was anoxic. Thus, owing to the lack of O2 needed to oxidize Fe2+, the precipitation of iron may have been accomplished by microbial oxidation.
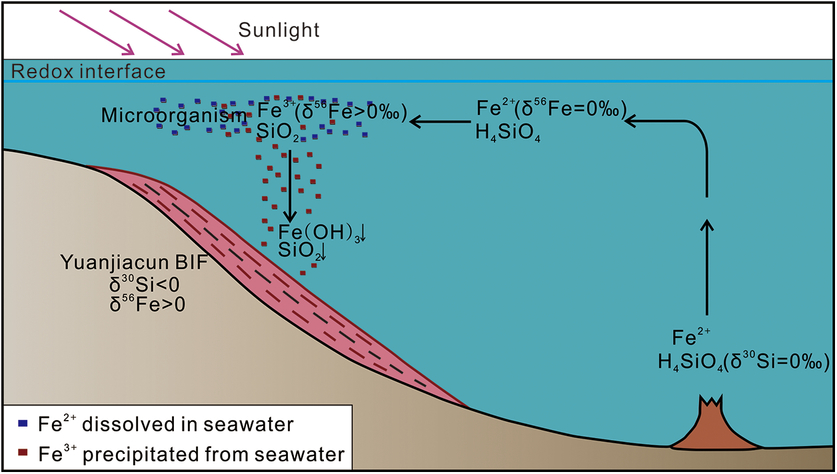
Therefore, none of the three hypotheses for BIF genesis is considered completely suitable for the Yuanjiacun BIF. The metallogenic process for the Yuanjiacun BIF is proposed in Figure 14. Hydrothermal solutions dissolving abundant Fe and Si erupted from the seafloor in early Proterozoic time. The Fe and Si were transported to the stable passive continental margin by thermal convection of seawater. The temperature of hydrothermal solutions decreased as they mixed with seawater, resulting in rapid precipitation of supersaturated silicon. In an anoxic oceanic environment, Fe2+ was oxidized to Fe3+ by microorganisms and precipitated. Consequently, the primary Yuanjiacun BIF was formed.
Formation model of the Yuanjiacun BIF.

7. Conclusions
The following conclusions have been reached through this study. (1) Terrigenous materials played a role of little significance in the deposition of the Yuanjiacun BIF. The metallogenic materials originated from the leaching of mafic oceanic crust by hydrothermal fluids. (2) The Yuanjiacun BIF formed in an anoxic oceanic environment. (3) The protoliths of the surrounding rocks were predominantly argillaceous and arenaceous sedimentary rocks, and their provenance was high-maturity felsic sedimentary rocks. The metallogenic tectonic setting was a passive continental margin. (4) The formation of the Yuanjiacun BIF was closely related to submarine exhalative sedimentation.
Author ORCIDs
Yekai Men, 0000-0002-6178-7615; Sanshi Jia, 0000-0002-3262-450X
Acknowledgements
This research was financially supported by the National Key Research and Development Program (No. 2016YFC0801603), Major State Basic Research Programme of the People’s Republic of China (No. 2012CB416801), Fundamental Research Funds for the Central Universities (No. N172303015), and Scientific Research Fund of Northeastern University at Qinhuangdao (No. XNB201720).