


Two debates have dominated the comparative political economy of advanced economies in the past three or four decades. The first, initiated in the neocorporatist literature, explores the linkages between wage bargaining, incomes policy, and competitiveness. The second seeks to understand redistribution and the welfare state as a function of partisanship and the political system. These literatures rarely speak to each other, but in this article we argue that they are closely linked through the role that skill formation plays in both distributive politics and international competitiveness. The model we build argues that union centralization, or at least cross-sectoral coordination in wage bargaining, has been necessary for expanding publically subsidized training on a large scale because it has required wage restraint among existing skilled workers, but it has also required political coalitions willing to subsidize such training so that enough workers have an incentive to train when the skill premium is relatively low. Such coalitions have been more likely under proportional representative (PR) electoral institutions, implying that industrial relations systems and electoral institutions are complements to one another.
Our model enables us to explain two major unsolved puzzles in comparative and international political economy. The first is the purchasing power parity (PPP) puzzle: why do some countries have persistently higher real exchange rates, or price levels, than others? The law of one price implies convergence in an open international economy (Rogoff Reference Rogoff1996), and the puzzle is considered one of the most important in international economics (Obstfeld and Rogoff 2000). Despite literally hundreds of papers it remains unsolved (see Taylor and Taylor Reference Taylor and Taylor2004, for a review). The second is a competitiveness puzzle: why are some countries with above-average real exchange rates, many found in continental Europe, nevertheless stellar export performers? If prices reflect costs, then high real exchange rates should be associated with poor performance (Rogowski and Kayser Reference Rogowski and Kayser2002). Yet, from the perspective of the quite different literature on neocorporatism and wage bargaining, the competitiveness of these (in fact, corporatist) countries is not just accepted, but taken as a starting point and dependent variable. It is explained in this literature as a function of wage restraint that keeps costs and prices low. As far as we are aware, the (at least apparently) contradictory coexistence with high real exchange rates has never been identified or explained. We set out our explanation more fully later in the article. However, put simply, systems of extensive vocational training have worked most effectively when coordinated unions have boosted international competitiveness by sufficient wage restraint to absorb trained workers into the open sectors of the economy. Wages in the less skilled sheltered sectors have been pushed up in the process both because of tightening labor markets and because coordinated unions have frequently followed policies of wage compression; this implies high consumer prices and hence high real exchange rates. Absent extensive vocational training and wage compression, therefore, international competitiveness and real exchange rates have both been lower.
The two puzzles are illustrated in Figure 1, which shows the national price levels on the x axis and a measure of export performance on the y axis from 1972 to 2000. Panel (a) defines the price level as the (log of) consumer price level in country I relative to the U.S. consumer price level, deflated by the nominal dollar exchange rate (so as to express it in a common currency). Unity (0 after logging) means purchasing power parity with the United States so that a dollar buys the same goods and services in country I as in the United States; higher values mean that a dollar will buy less in country I than in the United States (so country I has an “overvalued” exchange rate). The price level defined in this way is technically the inverse of the real exchange rate as defined in economics, but in line with common usage we refer to high prices and high real exchange rates as synonymous throughout. Export performance is measured as a country's share of Organisation for Economic Co-operation and Development (OECD) exports divided by its share of OECD output. To adjust for the fact that small countries trade more than large ones for reasons that are unrelated to competitiveness, we subtracted the effect of country gross domestic product (GDP) on performance by first regressing relative export shares on real exchange rates and country GDPs. The correction makes large countries look relatively better, but strengthens the overall relationship.
Price Levels and Export Performance in 20 OECD Countries, 1972–2000 a: Export performance as a function of price level (real exchange rate) b: Adjustment for Balassa-Samuelson effect

The PPP puzzle consists of the large and persistent differences in price levels across countries recorded on the x axis. The small dots in Figure 1 are the individual country-year observations and exhibit a great deal of variation. However, even if we average by country across the entire 29-year period (the large dots), most (almost 60%) of the variance in price levels remains, whereas standard economic theory would predict convergence. If there is free trade, then the only explanation for this in economic theory is the Balassa-Samuelson effect (Balassa Reference Balassa1964; Samuelson Reference Samuelson1964), which is the tendency for the overall price level to rise when wages and prices in the nontraded, low-productivity sector are pushed up in line with productivity growth in the export sector. Yet, here we are considering only developed countries, and even when we subtract the effect of GDP per capita on the real exchange rate, large permanent differences persist, as illustrated in panel (b). In the fully specified regression model estimated here, Swedish prices, for example, are nearly 40% higher on average than U.S. prices across the 29-year time span. This cannot be due to barriers to trade because we focus on the period since the end of Bretton Woods, which is widely regarded as the beginning of a truly globalized international economy (at least for OECD countries).Footnote 1
One possible solution to the PPP puzzle is that prices in some countries are kept high by heavily regulated product markets. It is notable that the economies with the highest real exchange rates are those in northern Europe, which are often highlighted as examples of overregulated, cost-inflated economies. In an innovative article, Rogowski and Kayser (Reference Rogowski and Kayser2002) use the well-known Stigler-Peltzman model of regulation (Peltzman Reference Peltzman1976; Stigler [1971] Reference Stigler and Stigler1975) to argue that higher consumer prices are a reflection of organized producer interests trumping consumer interests through regulatory policies. To account for the cross-national variation, they argue that PR electoral systems give politicians incentives to cater to well-organized producers without having to be overly concerned with losing elections, whereas in majoritarian systems politicians cannot stray far from the preferences of the median voter, who in their model represents consumer interests. The proportionality of the electoral system is thus positively related to regulations that raise prices. Rogowski and Kayser (2002, 538) draw the conclusion that this makes PR systems less competitive in an increasingly globalized world economy, and they imply that it may even lead to attempts at switching to more efficient majoritarian institutions.Footnote 2
However, this conclusion is challenged by the competitiveness puzzle, also captured by Figure 1: there is a surprising positive relationship between price levels and export performance. When prices are adjusted for differences in GDP per capita [panel (b)], the correlation is 0.61, and it is even higher (0.72) using unadjusted prices [panel (a)]. Those presumably cost-inflated northern European economies do spectacularly well in international competition! At first blush, this may seem entirely consistent with a large literature in comparative political economy that argues that success in export markets is related to the institutional capacity of employers and unions to keep wages and prices down (Adolph Reference Adolph2004; Flanagan, Soskice, and Ulman Reference Flanagan, Soskice and Ulman1983; Hall and Franzese Reference Hall and Franzese1998; Iversen Reference Iversen1999; Soskice Reference Soskice1990). Because wage bargaining tends to be highly coordinated in PR countries (Cusack, Iversen, and Soskice Reference Cusack, Iversen and Soskice2007; Katzenstein Reference Katzenstein1985), this argument runs counter to the Rogowski-Kayser model. Yet, by the same token, it raises a new puzzle because we should then expect price levels and real exchange rates to be lowest in centralized systems with PR, and the opposite is the case.
The model we present in this article solves the two puzzles simultaneously by emphasizing the central role of skill formation in relation to the export sector, with two possible institutional equilibria: high state-subsidized skill formation, compressed wages, and a large export sector; or low state-subsidized skill formation, dispersed wages, and a smaller export sector. These equilibria are the result of the complementary interaction of wage-setting institutions and political institutions. Export sector workers tend to be more highly skilled than workers in the service sector (we are excluding professionals from this comparison for reasons explained later in this article). They also tend to be better organized, and their interest is against state-subsidized expansion of skills for three reasons: it drives down their real wage because lower export costs are needed to expand export demand sufficiently to absorb the newly skilled workers. It increases taxes or reduces cash transfers to them because resources are needed to subsidize the additional training. And the reduced supply of service sector workers raises the price of services. For these reasons, unions in a decentralized bargaining system would hold up real wages in the traded sector, preventing a successful state-subsidized expansion of skills; and a majoritarian electoral system catering to the median voter (including the privately financed skilled worker) would not adopt such a policy in the first place. Thus, the institutional equilibrium generated by decentralized unions and a majoritarian electoral system is characterized by a relatively high-wage traded sector and relatively low-wage nontraded sector (again excluding professionals). The former directly explains why low competitiveness is associated with decentralized unions and a majoritarian electoral system. In turn, the relatively low-wage sheltered sector implies low sheltered sector prices and explains why the real exchange rate is also low (so long as traded goods can be purchased at world prices and no single country affects these).
In contrast, the ability of centralized unions (representing a coalition across sectors) to engineer long-term wage compression depends on a state-subsidized training system that ensures a large enough supply of skilled workers to the export sectors so that shop floor pressure against compression can be contained. With a majoritarian system, this is a nonstarter. But we show here why a PR system is biased to coalitions between center and left and, specifically, to the negotiation of state-subsidized training outcomes. In this equilibrium, real wages in the export sector are relatively lower, explaining high competitiveness. And real wages in the sheltered sector are relatively higher on account of its reduced supply of labor and wage compression, implying higher sheltered sector prices and a higher real exchange rate. Both centralized bargaining and PR thus matter, although in a manner not anticipated in any of the existing literature. Whether our logic will continue to apply in the future under the impact of technological change that puts coordinated bargaining under pressure is unclear, but as we suggest in the conclusion, understanding our model is a key to understanding how and why the politics of distribution and competitiveness may be changing.
The model contributes to two major literatures that seldom speak to each other. Almost universally, work in recent decades on coordinated wage bargaining has neglected what we view as the central link between wage bargaining systems and publically subsidized training systems. This is also true of work on public spending on education, which treats such spending as independent of the organization of labor markets (e.g., Ansell Reference Ansell2008; Busemeyer Reference Busemeyer2007). In our view, subsidized training depends on supportive government coalitions, and these coalitions are at least partly a function of political institutions and partisanship (Iversen and Stephens Reference Iversen and Stephens2008). In particular, we argue that PR electoral systems enable coalitions of skilled and semiskilled workers, and these are complementary to centralized institutions in the labor market. The importance of electoral institutions is also key to Rogowski and Kayser (Reference Rogowski and Kayser2002), but we propose a very different mechanism for how these institutions affect prices. In the conclusion, we suggest that the two mechanisms may be complementary because product market regulations help firms in the services sector pass through higher wages to prices. However, we disagree with the implication that Rogowski and Kayser draw for competitiveness because our model predicts that PR countries (with centralized bargaining) are more, not less, competitive.
The logic underpinning the economic argument has its origins in the old and largely forgotten “EFO model,” which focuses on intersectoral coordination of wages, especially the role of the export sector as a “leader” for wage setting in the nontraded sector (Aukrust Reference Aukrust, Krause and Salant1977; Edgren, Faxen, and Odhner Reference Edgren, Faxen and Odhner1973). We capture the key insight of the EFO model in a setup that combines modern open economy macroeconomics with recent insights into the effects of collective wage bargaining on wages. The model shows how wage-setting institutions can simultaneously affect competitiveness, prices, and international division of labor. These effects, however, are contingent on public investment in training, which is in turn closely related to electoral institutions and government partisanship. Our contribution is to show how economic and political institutions interact to simultaneously shape distribution and economic performance.
The rest of the article is divided into four sections. In the next two sections, we present the model (different equilibria in the labor market, and then different political equilibria); in the empirical section, we test its key implications for real exchange rates and competitiveness; and the final section concludes.
AN INSTITUTIONAL MODEL OF REAL EXCHANGE RATES AND COMPETITIVENESS
In this section, we first show how the key intuitions of the article—that coordinated bargaining and public investment in skills generate both high real exchange rates and a larger share of world markets for traded goods—can be derived from modern open economy models. In the next section, we turn to the game over wage-setting and government educational policies that provides the political underpinnings for the outcomes we identify.
Basic Assumptions
The past decade or so has seen the development in macroeconomics of a new basic model of the open economy (Lane Reference Lane2001; Obstfelt and Rogoff 1995), characterized by economies each specializing in different traded goods, and microfounded on differentiated product oligopolistic markets as opposed to perfect competition. The generic model is often referred to as the new open economy model (NOEM). We develop a simplified version of NOEM in which each of N symmetrically endowed countries produces a specific traded good; the traded good is produced by workers trained in the specific skills necessary to produce it; and there are two sectors in each economy, the traded goods sector and a nontraded (mostly services) sector, in which only general skills are required.Footnote 3 Following the now standard Melitz (Reference Melitz2003) model of trade, we assume that only the most productive firms are exporters and that high-productivity production requires high skilled workers.Footnote 4 Specifically, workers in the traded (T) sector are “skilled” with unit hourly productivity, whereas those in the sheltered (S) sector are “unskilled” with productivity lS < 1. The nontraded sector is thus a relatively low skill, low productivity, and low wage sector.Footnote 5
In addition to S-sector jobs requiring workers with low general skills and T-sector jobs requiring high specific skills, we distinguish high-income workers with general skills (“professionals”). We assume that these workers are high paid and nonunionized, whereas all other workers are unionized. For simplicity, the wages of professionals can be thought of as being determined competitively in an internationally traded service, in which case their wages are completely exogenous to the domestic economy. With this simplifying assumption, professionals play no role in the economic model of the domestic economy, but we later show that they do in the political model.
Finally, we assume that the number of economies, N, is large enough that no individual country can affect aggregate economic variables in the rest of the world. This ensures that prices on exports are not affecting domestic price levels and hence the real exchange rate. Note also that the assumption of symmetric economies implies that workers (or households) everywhere have identical preferences over the N traded goods and domestically produced services.
We distinguish between two types of economies. In the coordinated (C) type, a centralized union confederation sets wages for all unionized workers and seeks to ensure that they get the same wage in both sectors, whereas investments in skills for nonprofessionals are publicly subsidized to the point where supply and demand meet (we modify this assumption later). In uncoordinated (U) economies, unions bargain independently in each sector (again excluding professionals), and workers are responsible for their own training. Using these assumptions, we show that the real exchange rate and international competitiveness are both higher in C economies than in U economies, and the same is true for the proportion of the workforce in the traded sector relative to the service sector. For these results to hold politically, low wage workers must have influence on public training policies (in addition to influence within the union confederation). As we discuss, this condition is more likely to hold under PR political systems in which left parties support center-left coalitions in exchange for skill subsidization. In majoritarian systems, government coalitions tend to represent the interests of skilled workers (including professionals) only. This is incompatible with high public subsidization of training and a centralized bargaining system. Our argument thus emphasizes the role of distributive coalitions in both the industrial relations system and the political system, as well as the extent to which these coalitions are mutually reinforcing.
Needless to say, these are ideal types, and there is a continuum of economies in between. The Scandinavian countries are commonly recognized to have more centralized unions than elsewhere, but all continental European countries, with the exception of France, have highly coordinated wage-setting systems with a wage structure that is far more compressed than is true of liberal market economies (including France). The box plot in Figure 2 illustrates this fact by comparing the median and range of wage compression in the 1990s—measured by d1/d5 ratios for full-time workers, which should be a good proxy for the relative unskilled to skilled wage—for relatively coordinated and uncoordinated bargaining systems. In the former, which include Belgium, Denmark, Finland, Germany, Italy, Norway, the Netherlands, Sweden, and Switzerland, wages vary in a fairly narrow range, despite the fact that some systems are more centralized than others. Coordinated systems with compressed wages are therefore not restricted to a few countries.Footnote 6
Coordinated Wage Bargaining and Wage Compression, 1990s

Supply and Demand for Sectoral Labor
In this and the next subsection, we set out the NOEM model in simple graphic form (Figures 3 and 4). The full model is in the Appendix. We assume—in order to keep the two types of economies strictly comparable—that there is union bargaining in both T and S sectors (except for professionals, whose wages are always competitively set). The size of the unionized workforce is 1, with β working in T and 1 − β in S.
Real Wages and the Distribution of Labor across Two Sectors

Effect of Coordinated Wage Bargaining on Relative Wages and Employment

The Traded Sector Real Wage Schedule. The T-sector union sets a real wage that declines as the supply of labor, β, increases, as shown by the solid black line sloping down from left to right in Figure 3. The intuition is straightforward. The demand for the traded good in our generic economy depends on total world demand and the relative price of the traded good. As the proportion, β, of the workforce in T increases, the union has to accept a lower real wage to enable firms in T to set a lower relative price and hence increase net export demand and employment.
The Sheltered Sector Real Wage Schedule. A similar relationship holds for the services sector. The demand for the services sector in our economy depends on national income and the relative price of services. As the proportion of the workforce in services, 1 − β, increases, the real wage has to fall to allow the relative price of services to fall sufficiently to raise the demand for (and employment in) services. This relationship is also illustrated in Figure 3 (the upward-sloping black line), where an increase in the supply of labor in the S sector is a move left along the horizontal axis.
The Skill Investment Function. We now introduce investment in skills. Assume there is a cost, c, of acquiring the specific skills necessary to work in the T sector, which may be offset by a subsidy from the state of σ. Then, in equilibrium, there will be some relationship between the net cost of training to the individual, c − σ, and the return to the training that is equal to w − wS (the wage premium of skilled employment, where, again, wS stands for wages in services). Assuming that labor markets clear, the long-run equilibrium is w − wS = c − σ. If the government subsidy is σ, then the feasible long-run equilibrium is the dashed line in Figure 3. What this shows is that when the proportion of workers in T is β and in S is 1 − β, the gap between real wages in the two sectors is  − S. If the wage gap is equal to c − σ as shown by the vertical arrowed line, there is no further incentive for S workers to train and move to T. If unions set wages to ensure full employment, then this is then the equilibrium, and it is useful to think of this as a baseline outcome where unions essentially mimic a market-clearing competitive market. However, unions are not constrained to set wages to ensure full employment, which implies that union strategies play an important independent role in determining the outcome.
To see this, recall that the supply of skilled workers (β) refers to workers with the requisite specific skills to work in T-sector firms, and some of these can only be acquired on the job. So, for workers who have gone through a public training program to be able to find jobs, they depend on skilled unions reducing wages sufficiently for export demand to absorb the newly trained workers. However, if each uncoordinated skilled union only represents its own members, then it has no incentive to do so. Even if the reduced wage was initially only for new workers, once they are hired and acquire specific skills on the job, β rises and unions will be forced to reduce wages for their old members. In other words, there is an insider–outsider division that would prevent newly trained workers from finding jobs in the T sector. If so, they would not train in the first place because even with a public subsidy they will carry some of the cost themselves, and since the supply in the S sector does not fall, wages in that sector will not compensate newly skilled workers. So, public training subsidies are a necessary, but not sufficient, condition for wage dispersion to fall.
A sufficient condition is that skilled unions cooperate with unskilled unions to compress wages enough to clear the markets for both skilled and semiskilled workers. In other words, an effective public training scheme requires a coalition of skilled and semiskilled workers in the industrial relations system. We therefore turn to the analysis of coordinated bargaining systems next. As becomes apparent, such systems in turn cannot function without the government subsidizing training. So coordination between skilled and semiskilled workers also involves coordination with the government. It is perhaps not surprising, then, that our political analysis concludes that coordinated bargaining and wage compression depends on coalitions in the political system that include both skilled and semiskilled workers. Wage compression, high real exchange rates, and international competitiveness ultimately depend on a political compromise in both the industrial relations system and the political system.
The Role of Wage Bargaining
As noted, we distinguish between coordinated C and uncoordinated U collective bargaining systems.Footnote 7 In C systems, the centralized confederation has as an objective to secure equal wages for its members (the horizontal dashed line in Figure 4). Such “wage solidarism” conforms to an old and very robust finding in the literature on wage-setting systems that the more encompassing is bargaining, the more compressed are wages (see Freeman Reference Freeman1988; Iversen Reference Iversen1999; Rueda and Pontusson Reference Rueda and Pontusson2000; Wallerstein Reference Wallerstein1999). Although there are several explanations for the underlying political-economic logic—including an interest in redistribution by the median union member, insurance against wage losses, and ideological commitments—in our model, it is the result of a bargain between the S- and T-sector unions, in which government plays a supporting role and in which skill formation is of central importance. We argue that the role of the government differs with partisanship, which is itself tied to the electoral system. For now, what matters is the possibility that an encompassing union can strike a bargain with center-left coalition governments, whereby in exchange for a subsidized training system, it will guarantee that wages are suitably held down in the T sector and suitably increased in the S sector.
We hasten to add that although our model explains how the bargaining and electoral systems mutually affect each other and either facilitate or inhibit particular wage and training policies, we do not offer a theory of institutional origins or choice. In particular, we do not provide a sufficient set of conditions for skilled unions consenting to coordinated and solidaristic bargaining. In accounting for this phenomenon, the existing literature has variously emphasized the role of complementarities between skilled and unskilled workers (Wallerstein Reference Wallerstein1990), the collective gains from controlling wage inflation (Iversen 1995; Katzenstein Reference Katzenstein1985), the distribution of strike capacity across unions (Ahlquist Reference Ahlquist2010), and (most important, in our view) the capacity of employers in the export sector to impose coordination in order to reduce the cost of skilled labor (Swenson Reference Swenson1991; Thelen Reference Thelen2004). These factors (employer preferences, in particular) have probably also played a role in the shift away from highly centralized bargaining in some countries, but our model is designed to explain the consequences of these shifts, not their causes.
To illustrate the role of bargaining, we contrast the C case in which a center-left government provides a complete subsidy of σC = c and the U case in which a center-right government gives no training subsidy, σU = 0. In Figure 4, the U case is where U − S,C = c, implying in the U equilibrium that β = βU. In the C case, we assume the C confederation has sufficient power to impose the lower wage C on its T-sector union, while allowing its S-sector union to bargain the same wage S,C = C. The center-left government, seeing that the C confederation has the power to compress wages in this way (suggested by the arrows down in the left and up in the right margins) is prepared to subsidize training. Here, we assume for simplicity that there is a complete subsidy, σC = c, we relax this assumption in the next section, where it is modeled as an outcome of coalition bargaining. It turns out that with bargaining the government will only provide a partial subsidy, and that unions will only reduce, not eliminate, wage differentials (consistent with the empirical data).
It is not difficult to see that two opposite problems can arise in the centralized bargaining case: (1) if the confederation has insufficient power to control the T union (or the T union cannot control its existing members), then the T wage will be pushed too high to employ the newly trained workers. In this case, C > wS,C and the unemployed skilled workers then seek work in the S sector, preventing the S wage from rising. Or (2) if, in contrast, the government fails to deliver on training, but the confederation tries to compress wages, then there will be pressure for wage drift in the T sector and unemployment in the S sector. Exports will also be hurt to the extent that fewer workers invest in training in response to a smaller gain in wages.
If, however, the confederation is strong and can set C = wS,C, and the government is prepared to accommodate wage compression through subsidization of training, σC = c, then we get the first result of the model:
Result 1. The coordinated economy will have a higher proportion of the workforce in the traded sector than the uncoordinated economy, that is, βC > βU.
We do not test this implication of the model, but it has in fact been recognized for a long time that coordinated wage bargaining systems with compressed wages underperform uncoordinated economies in terms of low skilled, private sector/service sector employment (see Esping-Andersen Reference Esping-Andersen1990, ch. 4; Iversen and Wren Reference Iversen and Wren1998; Scharpf Reference Scharpf2000). In these countries, it is typically the case that social service provision outside the market is subsidized to take place in the family (continental Europe) or in the public sector (Scandinavia).
Real Exchange Rates and Competitiveness
The effects of wage setting on the real exchange rate and competitiveness are captured by two simple relationships.
International Competitiveness as Decreasing Function of Traded Sector Real Wage. First, international competitiveness, measured as relative unit labor costs, is inversely correlated with the real wage divided by labor productivity in the T sector. Intuitively, because the real wage is lower in the C economies and because productivity is assumed the same, this implies higher international competitiveness. (The Appendix shows that this intuitive relationship is not quite self-evident.)
Result 2. International competitiveness is higher in the coordinated economies than in the uncoordinated economies.
Result 2 also implies higher exports in C economies (as a proportion of GDP) as long as the government accommodates wage compression through training subsidies. If not, exporting firms cannot meet international demand, there will be strong wage drift pressure, and output and exports will fall over time as fewer workers invest in training and real wages get pushed back up. The effect of centralized wage setting on exports is thus conditional on government training policies.
Real Exchange Rate as Increasing Function of Sheltered Real Wage. The real exchange rate is the ratio of the consumer price index, PC, to the world consumer price index, P*C (where the subscript C indicates consumer prices). The real exchange rate is positively correlated with the nontraded service sector real wage.Footnote 8 The reason is as follows. The service sector real wage is wS ≡ WS/ PC. PC is the weighted average of the service sector price level, PS, and the world price of tradables, P*T (in which the price of the domestically produced tradable has an insignificant weight with a large N)Footnote 9. PS is a markup on service sector costs of production, namely, the service sector wage divided by the service sector labor productivity, and with the specific assumption of Bertrand pricing, PS = WS/lS. So,

where q ≡ PC/ P*C is the real exchange rate.Footnote 10 Hence, a rise in wS , the service sector real wage, implies a rise in q, the real exchange rate.Footnote 11
The intuition here is that service sector wages affect the consumer price index, but the wage in the traded sector does not (or only minimally) because traded sector prices are (largely) set abroad. So, the higher are service sector wages, the higher will be the (inverse of the) real exchange rate:
Result 3. The real exchange rate is higher in coordinated economies than in uncoordinated economies because service sector wages are higher in C economies.
The three results are illustrated in Figure 5 (and proved in the Appendix). Panel (a) shows the uncoordinated case where wages are bargained separately in the two sectors. The center portion of Figure 5 shows the bargained real wage (BRW) in the two sectors and the corresponding allocation of labor across the two sectors (the line projection). Wages in the service sector determine the real exchange rate because (1) this is set by the consumer price index when the nominal exchange rate is given, and (2) the consumer index is a weighted average of world prices on traded goods and prices on nontraded goods. With wages in services relatively low, the real exchange rate is also low. Conversely, prices on exports, and hence cost competitiveness, are determined by wages in the export sector. The higher are export sector wages, the lower is international competitiveness.
Relationship between the Bargained Real Wage, Real Exchange Rate, Cost Competitiveness, and Allocation of Labor a: Uncoordinated bargaining b: Coordinated bargaining

Panel (b) shows what happens to the results when wage bargaining is centralized and wages are set identically in the two sectors. The comparative statics are captured by the effects labeled i, ii, and iii. First, because the wage level in the export sector is lower than in the uncoordinated case, cost competitiveness is higher (effect i). This can be seen by comparing line projections for the coordinated and uncoordinated cases. Second, lower wages also imply higher employment shares as exporters hire more workers.
Conversely, relatively higher wages in services imply that a smaller share of the labor force will be employed in that sector (effect ii). Finally, higher relative sheltered sector wages push up prices on nontradables, which increases the consumer price index and the real exchange rate (effect iii). Consequently, if countries vary in terms of the degree of centralization in their wage-setting institutions, then high competitiveness will go hand in hand with high real exchange rates.
THE ROLE OF GOVERNMENT COALITIONS
As noted previously, without public subsidies for training, solidaristic wage policies by an encompassing union will be difficult because the absence of subsidies produces an undersupply of skilled workers and an oversupply of unskilled workers. Even if we assume that the confederation is very powerful, it is not difficult to see that it will find it increasingly difficult to prevent wage drift among high-wage workers, or outright defection by the high-wage union, as the gap between coordinated and uncoordinated wages increases. At some point of low public subsidization of training, therefore, centralized bargaining is likely to break down. With high subsidization, however, coordinated wages are sustainable because it brings the supply of labor into line with the demand at bargained rates (at σC = c in Figure 4).
Public training subsidies work differently in an uncoordinated bargaining system because each union sets wages to maximize the interest of its existing membership. Because some skills are specific to particular companies and industries, and therefore require on-the-job training, currently employed skilled workers have no incentive to reduce their wages in order to price newly trained workers into employment. So, newly trained workers would either end up as unemployed or in low-paid jobs where their skills are not needed. In this situation, there would be no incentive to invest in training, and a public training scheme would likely fail. Because there is thus a strategic complementarity between wage-setting and public training policies, we need to endogenize the government decision to invest in training. Because this decision is shaped by electoral institutions, our argument implies an equilibrium relationship between these institutions and prices or real exchange rates. This is precisely what Rogowski and Kayser (Reference Rogowski and Kayser2002) find, although their explanation is different.
In the simple game developed here, the government is assumed to be a minimal winning coalition of parties representing particular economic groups. In our setup, the groups are low-wage unskilled workers (L), medium-wage skilled workers (M), and high-wage professionals (H). We assume that both the bargaining system (coordinated or uncoordinated) and the electoral system (PR or majoritarian) are exogenous, so that there are four possible games of which we consider two: that in which there is a centralized union and a PR electoral system, and that in which there are many unions and a majoritarian electoral system. We discuss the other two combinations informally here. In both games, there are two moves in which the government first chooses an educational policy and the union(s) choose wages knowing the government's policy.
For simplicity, we assume that the high-income group H (professionals) gain their income directly from world markets and have a taxable capacity of  H, where for convenience this taxable capacity is equal to the cost of training enough of the nonprofessional workforce to equalize wages in the traded and sheltered sectors, H = c β1, where β1 is defined by the proportion of trained workers in the economy such that w = wS =
 , or what we may refer to as “full” training (σC = c).Footnote 12 Among L (which make up the share 1 − β of the nonprofessional workforce), β1 − β will train if training is public. For (mathematical) convenience, the taxable capacity of the nonprofessional workforce is assumed to be zero.Footnote 13
The government can choose a tax rate up to the taxable capacity of H (T ≤ H), and it can decide to spend it on either training or transfers, or any combination of the two, subject to the constraint that net taxes and transfers for the three groups are nonregressive (i.e., L gets at least as much as M, and M gets at least as much as H). Without a training subsidy, M would earn and spend c on private training, whereas L is unable to pay for, or finance, its own training without a state subsidy. L therefore gets S.Footnote 14 The payoff for L with full public training is (the equalized wage), and the payoff to M is + c (because skilled workers would no longer pay for their own training).Footnote 15 If taxes are spent on a cash transfer instead, then each group would receive a share of that transfer that in the PR case is determined by bargaining between parties that combined have a majority of votes. Assuming that parties represent groups, the outcome of such bargaining depends on the policy preferences of the groups. Subject to the regressivity constraint, these are as follows (with justifications provided):
(i) H prefers T = 0 (so M and L both get 0).
(ii) M prefers T =
 H; and spending on an equal cash transfer to M and L rather than on an equal subsidy of training to M and L.
(iii) L prefers T =
H; and spending on an equal subsidy of training to M and L rather than on an equal cash transfer to M and L.
The reason that H would prefer zero taxes and L and M would want to maximize these is obvious. The difference in preferences between L and M over the composition of transfers and training requires more discussion (note that H is indifferent because it benefits from neither). M prefers spending on transfers because spending on training has a negative effect on skilled wages. Specifically, if taxes were spent on training, then M would get c + , where H/2 = c exactly covers M's training costs.Footnote 16 If the same spending instead went to L and M as transfers, then M would get c + .
It might be objected here that if L prefers training to subsidies, (some) unskilled workers would use the transfer to pay for private training, thus producing the same outcome as with public training (and hence making M indifferent between transfers and public training). However, this is not true because for an individual it never pays to invest in training if the wage gain is lower than c (the cost of training). This will not be the case because the supply of skilled workers β intersects the downward-sloping demand curve for skilled workers exactly at a point where the skilled wage premium, − s, is equal to the cost of training, c. Beyond this point, the wage premium would be lower than the individual cost of training, and no one from L would therefore pay that cost.
Yet, this does not imply that training is not advantageous to L as a group. The reason is that the increase in unskilled wages, − s, provides a gain for the group as a whole, even as it is completely discounted by the individual group members deciding whether to invest in training. For L as a group to prefer public training to transfers only requires that the collective gain in wages outweighs the value of the cash transfer. Specifically, with a full cash transfer, L gets (1 − β)S + c(β1 − β), whereas with full public training, L gets (1 − β), so the condition for L to prefer training is

This holds as long as traded sector wages do not fall too far, and the proportion of remaining sheltered sector workers is not too small. If there are externality effects on overall productivity, then these conditions are likely to be satisfied. In essence, because spending on L is the same with either policy, if there are efficiency gains of having a more trained workforce, then it is better for L to spend on (productivity-enhancing) training than on (unproductive) transfers. We think this is a very plausible assumption. If it is not satisfied, then no group would ever want public spending on training, but we know that some governments (especially those including representation of L) spend on such training.
With these assumptions in mind, we can now hypothesize spending behavior in both types of political systems. Following Iversen and Soskice (Reference Iversen and Soskice2006), we assume there are two parties in the majoritarian system, one of which can be thought of as representing some part of M and H (MH or the center-right party) and the other some part of M and L (LM or the center-left party), whereas in the PR system there are three parties H, M, and L, each representing the relevant social group (italicization signals parties as opposed to groups).Footnote 17 In the majoritarian game, M is the decisive voter and is indifferent between MH and LM, both of whom propose a full cash distribution. This policy is H, divided equally between M and L. The payoff to M is thus H/2. This result will be somewhat modified if governments cannot fully commit to an M platform; however, as long as the probability of reneging on electoral promises is not too high, it will not affect the conclusion that most spending is cash and that training is all or mostly private. When training is private, the decentralized union(s) set w = in the second stage of the game.
In the PR game, M is the formateur and chooses to form a coalition with either H or L, in both cases making the first offer.Footnote 18 In each case, we assume the coalition splits the difference between ideal points, which follows straightforwardly from Rubinstein bargaining theory when discount rates are the same.Footnote 19 Hence, in the MH coalition, M's preference is for a full cash distribution, in which case M gets cβ (which requires T = H), and H's preference is for H = 0. Then splitting the difference implies that H pays H /2 and M gets cβ /2 (with L getting c(β1 − β)/2 because of the nonregressivity assumption). Note that because it is only the size of the cash distribution that is being bargained over between M and H (neither M nor H prefer training), skilled wages are unaffected (w = ) so that the full payoff to M under an MH coalition is  .
In the LM coalition, if L and M bargained only over transfers (M's preference), then M would get β( + c), whereas with a “pure” public training scheme (L's preference), M would get β( + c). The compromise lies between these two outcomes. So, as long as the traded wage line and the sheltered wage line are both linear, we can split the difference with either. So M's payoff in the LM coalition will be

We can now compare this payoff to M's payoff under an MH government, which implies that M will choose L over H iff

and this is always true because c = − S and > S. The intuition is that M will be more than compensated for the drop in its wages because the total tax take, and the transfer, is now twice of what it is in the MH coalition.
The implication is that an LM coalition will form in the PR case and choose partial public training, with full training subsidy for all those trained plus a cash distribution, and the equilibrium wage in the traded sector being

Note that this is less than full equalization; however, as we discussed previously, it will be difficult for the centralized union to compress wages more than what the government and training subsidy will support. Moreover, this conforms to the reality of coordinated systems that there remains a difference between skilled and unskilled earnings, even if it is notably smaller than in uncoordinated systems. If we use d5/d1 wage ratios as a proxy for the skilled to unskilled wage, then we find that this is 1.46 in countries with relatively coordinated bargaining systems (and PR) and 1.85 in countries with relatively uncoordinated bargaining systems (and majoritarian electoral systems).Footnote 20 Dividing the latter by the former yields a ratio of 1.27. In the theoretical model, this ratio is  , or 1.21, if we use the d1/d5 ratio in uncoordinated systems to proxy for s / . So, the differences in observed wage structures are almost exactly equal to the prediction of the theoretical model, despite its simple assumptions. There is also ample empirical evidence that PR and center-left governments are associated with more spending on primary and secondary education (see Ansell Reference Ansell2008; Busemeyer Reference Busemeyer2007; Iversen and Stephens Reference Iversen and Stephens2008).
An objection to our argument is that if M can play L and H against each other, it would be able to get its preferred outcome. There would then be no difference to the majoritarian system. But although this is true if M could make take-it-or-leave-it offers to both L and H, Rubinstein bargaining is different and conforms better to the reality of coalition bargaining. We see this as a major, and largely overlooked, reason for why partisanship matters because government policies are virtually always decided through bargaining as opposed to ultimata by the center party. The formal proof of why Rubinstein bargaining leads to policies that diverge from M's ideal point is available in the supplementary online Appendix,Footnote 21 but the intuition is that offers that deviate from the Rubinstein solution from any player are not credible. For example, H will be motivated to offer M in an LM coalition a better deal, and M would be interested in such a deal. But the offer would not be time consistent because once M leaves L for a new coalition with H, the cost of moving back to L (which in Rubinstein bargaining theory is the cost of a squared one period delay in the bargain) will cause H to renege on its offer and give M something just slightly worse than M would have received had it stayed with L. The logic is a special case of the outside option principle (see Osborne and Rubinstein Reference Osborne and Rubinstein1994, 7.4.3, 128).
The interaction between the wage-setting system and the political system can be summarized as in Table 1. The model we discuss in this section directly covers the two shaded cells, but it has implications for the other two as well. As we argue, a centralized bargaining system is only sustainable when the government subsidizes training, and such subsidies are higher under center-left governments, which we show are more prevalent in PR electoral systems. Without such subsidization, centralized bargaining is difficult to sustain because skilled workers will object to wage compression and be in strong market positions to strike separate deals with employers. The problem will grow over time as fewer workers invest in training given the small wage premium. Because majoritarian systems are associated with lower subsidization of training, bargaining will for the same reason tend to be decentralized—and hence also associated with higher wage dispersion, lower real exchange rates, and lower competitiveness.
Coordinated Bargaining, Electoral Systems, and Economic Outcomes

In the case of decentralized wage bargaining and PR, skilled unions will again pose a problem of cooperation. As we note in the previous section, currently employed skilled workers have no incentive to reduce their wages in order to price newly trained workers into employment (at least as long as skills are specific). The assumption we used in the PR centralized case that all members of L would experience a rise in wages is therefore no longer satisfied, and the party representing these workers would be better off with a transfer. Of course, this still makes center-left governments more likely (the interest of L and M are in fact even better aligned than before because M also prefers transfers), but wages would not be affected. This is consistent with the one case, New Zealand since 1996, where the dominant pattern has switched from center-right governments under the previous majoritarian system to center-left coalitions under PR, but in which unions were decentralized before and after the change. Predictably, there has been no significant move to mass subsidized training.
The reason for the predominance of the coordinated-PR and uncoordinated-majoritarian combinations has, we believe, to do with the historical origins of PR, which occurred exclusively in protocoordinated political economies (Cusack, Iversen, and Soskice Reference Cusack, Iversen and Soskice2007). Centralization is therefore strongly related to proportionality of the electoral system. With the partial exception of New Zealand already noted, a simple dichotomization of each variable would arguably produce a perfect correlation over longer periods of time (i.e., all cases would fall into the shaded cells).Footnote 22 In turn, the relationship between PR and centralization explains why PR is linked to higher real exchange rates (“price levels”) and higher competitiveness.
EMPIRICAL TEST
The strategy is to estimate real exchange rates and competitiveness as a function of wage compression, centralization of wage setting, and PR. Each regression (or set of regressions) corresponds to one of the two puzzles in the introduction. As implied by effect iii in Figure 5, we show that the real exchange rate is a function of the centralization of the bargaining system, with wage compression as the key intervening mechanism. PR also has the expected effect on real exchange rates, but it disappears once we control for centralization or wages, consistent with our argument. We then show (more briefly) that compressed wages and PR are positively related to export performance. This is implication i in Figure 5.
Estimating Equation for Real Exchange Rates
The (inverse) real exchange rate q—or the price level—is defined as

where p is the domestic consumer price index, p* is the foreign consumer price index, and e is the nominal exchange rate. The fraction e = p/ p* implying q = 1 is the nominal PPP exchange rate.
According to the law of one, price q should equal 1. This is the null hypothesis in PPP theory. If prices are sticky, however, short-term price or exchange rate shocks will not be immediately eliminated. Parity is thus achieved only after the period of time it takes for prices to adapt. To estimate this price conversion process, we first express Equation (1) in natural logarithms:

If PPP holds in the long run, the right-hand side must revert to zero over time, which is equivalent to the real exchange rate being equal to 1. By implication, deviations from zero must be temporary, and any disturbance must be followed by a decay process. It is standard to model this decay process using

where ρ must be between 0 and 1 for disturbances to decay over time. Equivalently, by subtracting ln qt −1 on both sides, Equation (3) can be written as

where δ = ρ − 1 is each period's decay in the initial deviation from PPP. For example, if δ = −0.25, then disturbances are damped out at 25% in each period. Because we want to detect cross-national differences in deviations from PPP, we write Equation (4) as

where i indexes countries. We control for the Balassa-Samuelson effect by including a GDP per capita variable:

where yi,t is per capita income in country i at time t. The lagged difference term removes remaining first-order correlation, so that ηi,t is spherical.Footnote 23
Rogoff (Reference Rogoff1996) shows that the Balassa-Samuelson proposition is supported by data covering both rich and poor countries, but per capita income fails to explain most of the variance among developed countries. This variance can be captured in a fixed-effects model, where real exchange rates revert to different means, implying a systematic violation of the law of one price (see Frankel and Rose Reference Frankel and Rose1996; Lothian and Taylor Reference Lothian and Taylor1996; Oh Reference Oh1996; Papell Reference Papell1997). Including country-specific effects, the model is

where di is the dummy variable for country i.
Our argument is that the persistent deviations from parity (one price) are due to cross-national differences in the institutionally mediated wage structure. We test this argument against the standard model by substituting in measures of wage compression, centralized bargaining, and PR for the country dummies (because institutions vary little in our sample). Except for the work by Rogowski and Kayser (Reference Rogowski and Kayser2002), no existing work to our knowledge seeks to explain the different national intercepts.Footnote 24
Data
The data on real exchange rates and real GDP per capita income are from the Penn World Table (PWT), Mark 6.2. We focus on the post–Bretton Woods era (post-1971) and have data for 21 advanced democracies (the same countries as in Figure 1).Footnote 25 Coverage is more limited for the wage bargaining centralization variable, where we have data for 16 countries, covering between 21 and 25 years (in most cases, 1973–95).Footnote 26 The centralization measure is from Iversen (Reference Iversen1999) and combines two dimensions of coordinated wage bargaining: the level at which bargaining occurs and the concentration of membership in unions covered by collective agreements at each level. It is defined as (∑wjp 2ij)1/2, where wj is the weight accorded to each bargaining level j, (0 ≤ wj ≤ 1 and ∑wj = 1), and pij is the share of workers covered by union (or federation) i at level j. It is essentially a measure of the extent to which wage setting is “encompassing” in the sense of wages being determined for all workers within and across industries. A value of one would mean that all wages are set at the national level, where the labor side is represented by a single confederation. As such, it approximates the notion of centralization that we use in the theoretical model.Footnote 27 Because the measure shows periods of considerable volatility, which are unlikely to be related to short-term changes in our dependent variables, we use a 5-year moving average.
We calculate wage compression using two different measures. One is OECD's estimate of the earnings of a full-time worker at the bottom decile of the earnings distribution as a share of the earnings of a full-time worker at the median (d1/d5 earnings ratios). These data are available for all 16 countries for which we have centralization data, but the time coverage varies a great deal from country to country. Of the 379 country-years for which we have centralization data, there are 268 country-years with d1/d5 earnings data. The second wage compression measure is hourly wages in retail, wholesale, hotels, and restaurants (RWHR) relative to hourly wages in manufacturing (MAN). The former is used as a proxy for wages in nontraded services, and the latter for wages in traded industry (it is referred to here as the relative nontraded sector wage). The data are based on industry earnings data from the 1998 OECD International Sectoral Data Base (ISDB) and cover 14 of the 16 countries with centralization data, for a total of 323 country-years. As expected, relative RWHR to MAN earnings are always below one. The correlation with the d1/d5 measure is 0.73.Footnote 28
Finally, we use the 0–1 dummy variable for PR as defined in Rogowski and Kayser (Reference Rogowski and Kayser2002).Footnote 29 The countries coded as majoritarian (or SMD) are Australia, Canada, France, New Zealand, United Kingdom, and the United States—the rest are coded as PR. To check the robustness of our results, we also use Gallagher's (Reference Gallagher1991) measure of vote-seat disproportionality, which is defined as the square root of the sum of squared differences between vote and seat shares for the lower house. We inversed and standardized it to vary between 0 and 1 so that it presents a comparable measure to the PR dummy. The correlation between the two is 0.78. The data for each country-year was obtained from Armingeon et al. (Reference Armingeon, Engler, Gerber, Leimgruber and Beyeler2009).
Findings for Real Exchange Rates
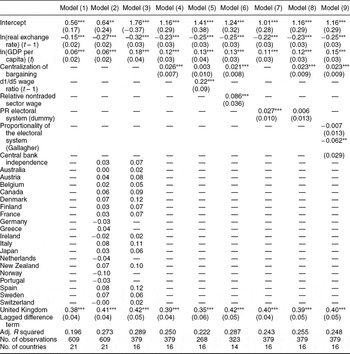
Table 2, model (1), shows the results of estimating Equation (6) on the complete data for the 21 OECD countries in the post–Bretton Woods era (1972–2000). Note that the parameter on the lagged dependent-level variable is negative so that deviations from PPP dampen out over time. This process of mean reversion is slow, however, with a half-life of almost 4 years. When we control for country-specific effects, as in model (2) of Table 2 (using the United States as the reference country), there is a notable increase in the explained variance, and an F test unambiguously shows that the country dummies belong in the model. Moreover, the half-life of deviations from parity is now significantly reduced to only 2 years. This is more consistent with a sticky price hypothesis, and similar to existing estimates using a similar setup.Footnote 30 The key insight for our purposes, however, is the fact that real exchange rates in many countries never converge to PPP. To find out how much the real exchange rate of a country is under- or overvalued, we take the inverse log of the parameter for that country's dummy and subtract 1 (parity) from the result. The long-run equilibrium value is determined by dividing by −δ (the parameter on the lagged dependent-level variable). Using this formula, the (inverse) Swedish real exchange rate, to take a specific example, turns out to be an average of 30% overvalued compared to the U.S. dollar. Hence, a dollar would on average buy you 30% less in Sweden than in the United States from 1973 to 1997. That difference is equivalent to $7,600 in 2000 prices.
Change in Real Exchange Rates for 14 to 23 OECD Countries, 1972–2000a
Sources: Real exchange rates and real per capita GDP in 2000 prices: Penn World Tables (PWT), Mark 6.2; d5/d1 ratios: OECD Electronic Data Base on Wage Dispersion (released in 2006); relative hourly wages in retail, wholesale, hotels, and restaurants (RWHR) as share of the hourly wages in manufacturing (MAN): International Sectoral Data Base (ISDB), OECD 1998; centralization of bargaining: Iversen (Reference Iversen1999); SMD dummy: Rogowski and Kayser (Reference Rogowski and Kayser2002). Proportionality of the electoral system is Gallagher's (Reference Gallagher1991) vote-seat disproportionality measure inversed and 0–1 standardized; the data are from Armingeon et al. (Reference Armingeon, Engler, Gerber, Leimgruber and Beyeler2009). Central bank independence is Cukierman's (Reference Cukierman1992) legal index of independence from Armingeon et al. (Reference Armingeon, Engler, Gerber, Leimgruber and Beyeler2009).
Notes: GDP, gross domestic product; OECD, Organisation for Economic Co-operation and Development; PR, proportional representative.
aExchange rates are measured against the U.S. dollar and expressed in logged differences. The reference country for the country dummies is United States.
***< .01; **< .05 (standard errors in parentheses).
For the smaller sample of 16 countries where we have centralization data (column 3), the overvaluation of the Swedish krona is nearly 40%, and the average currency deviations from parity are also larger. Our argument is that if wages are set through collective bargaining, then the most important determinant of the price effects of productivity differences is the extent of cross-industry wage coordination. The effect of wage compression is illustrated in Figure 6, which shows the relationship between earnings compression and the percentage overvaluation of countries' real exchange rates [using the estimates of the fixed effects from model (3), and the procedure described in the preceding Swedish example]. The dispersion measure used here is OECD's d5/d1 ratios.
Compression of Wages and Currency Overvaluation

The relationship is in the predicted direction and moderately strong (r = 0.60). For example, the three egalitarian Scandinavian countries have significantly “overvalued” exchange rates, whereas three inegalitarian countries—Britain, Canada, and the United States—have relatively undervalued currencies. Italy is clearly an outlier, exhibiting a compressed wage structure, as well as a relatively “cheap” currency. The likely reason is that, although the formal wage structure is compressed as a result of union wage policies, this led in Italy to an expansion of informal labor markets in the sheltered sector of the economy (Erikson and Ichino Reference Erikson, Ichino, Katz and Freeman1995). This may have been a reflection of the relative failure of publically subsidized training outside the north of Italy. It may also in part reflect measurement issues because whereas on the d1/d5 measure, it is tied for the fourth rank, on the nontraded sector wage measure, it is ninth. Omitting Italy, the correlation between d1/d5 ratios and overvaluation is 0.77. If we use the relative nontraded sector wage as the compression measure, the correlation is 0.68, including Italy.
Wage compression is in turn a function of the centralization of the wage-setting system. The correlation between the two variables is 0.65, and centralization is also positively associated with the real exchange rate (r = 0.60). The latter effect is estimated more precisely in model (4) of Table 2, where centralization takes the place of the country dummies. Not surprisingly, given the correlation between the centralization variable and the fixed effects, there is a strong positive impact of centralization on real exchange rates. A one standard deviation increase in centralization raises the expected long-term real exchange rate by one fourth of a standard deviation, or 7.1%. In terms of purchasing power, this is equivalent to an average of $1,750 in 2000 prices.
In models (5) and (6), we include wage compression as a variable to make the simple point that much, if not all, of the effect of centralization runs through the wage structure. If we use d1/d5 ratios, then the entire direct effect of centralization disappears, and wage compression now explains much of the variance in real exchange rates. A standard deviation increase in the wage of a worker in the bottom decile relative to a worker at the median raises the equilibrium real exchange rate by 9.2%. The corresponding figure when using the relative nontraded wage is 6.4% if centralization is included and 8.8% if it is omitted. Centralization appears to have a residual direct effect on the real exchange rate after controlling for the nontraded sector wage, which suggests that the latter measure does not capture the entire wage effect of centralization. Be that as it may, it seems safe to conclude that centralization raises the real exchange rate and that much, if not all, of this effect runs through wage compression.
Model (7) substitutes the PR dummy for the centralization variable. We find that PR electoral systems are associated with higher real exchange rates, just as predicted by Rogowski and Kayser (Reference Rogowski and Kayser2002). In fact, the magnitude of a 12.4% reduction in equilibrium prices in majoritarian systems is slightly larger than the effect of 10.4% that Rogowski and Kayser report. But note that the variable registers no effect when centralization is also included in model (8). The same is true if we use Gallagher's (Reference Gallagher1991) disproportionality index [model (9)].Footnote 31 This index arguably captures the logic of their argument better because it measures whether the translation of votes into seats is continuous or discontinuous, which is key to their argument. The negative finding for PR when centralization is included in the model suggests to us that the electoral system affects the real exchange rate at least partly through the mechanism that we have identified.Footnote 32 Yet, because coordination of bargaining, wage compression, and PR are highly collinear, one must be careful in attributing precise weights to the different mechanisms. Measurement error and model specification can affect the results, and it is perfectly conceivable that PR shapes both product and labor market regulations. The latter channel is important, however, if we want to understand the relationship between the political system and competitiveness.
Finally, we tested for the possibility that central bank independence affects real exchange rates [model (9)]. Because the most conservative banks are found in coordinated economies, perhaps this can explain why these tend to have higher real exchange rates? But although it has been argued that central banks can delay or speed up adjustments to price shocks (see Taylor Reference Taylor2004), there is no support in standard open economy macro for the idea that they can permanently affect price levels. The reason is that monetary policy in these models has no effect on the real economy, and hence real exchange rates, beyond the short term. In the Iversen-Soskice (Iversen Reference Iversen1999; Soskice and Iversen Reference Soskice and Iversen2000) and Hall-Franzese (1998) models, central banks can induce wage setters to accept lower real wages with real economic effects, but such restraint would reduce, not increase, real exchange rates.Footnote 33 As it turns out, if we use Cukierman's (Reference Cukierman1992) legal measure of independence, central banks do in fact reduce real exchange rates, but the effect is fairly weak and leaves our other results unaltered.Footnote 34
Findings for Competitiveness
Recall that the electoral system matters for competitiveness because it affects partisanship and investment in skills, and thus also both competitiveness and the division of labor. Unlike the Rogowski-Kayser model, our argument implies that PR countries will outperform majoritarian countries in international competition and generate more employment in high-productivity exports. Moreover, this effect will be rising in the coordination of the wage-setting system because more trained workers will then be priced into jobs through skilled union wage restraint (so PR and its interaction with centralization will both be positive). Centralized wage bargaining will also improve export performance, but only if it is coupled with PR and subsidized training; otherwise, a smaller skill premium will dissuade individual from acquiring skills (so centralization has a positive effect when interacted with PR, but a negative effect otherwise). This corresponds to consequence i in Figure 5b (which assumes that the government accommodates wage compression through training). Finally, when public investment in training is included as a variable, the effect of PR on performance should vanish because it goes through training.
As in Figure 1, we measure export competitiveness as a country's share of OECD exports to its share of OECD output, which in our sample ranges between 0.4 and 4.9. Because this ratio is partly a function of the size of a country's domestic market, we control for total GDP (measured in constant PPP dollars). We also correct for first-order autocorrelation within each series (Prais-Winsten regression),Footnote 35 and in order to eliminate temporary shocks to competitiveness (due to the oil crises, decline in regional export markets, etc.), we estimate the model using year fixed effects (although results are similar without these). Following Beck and Katz (Reference Beck and Katz1995), the reported standard errors adjust for heteroscedasticity and contemporaneous correlation. The results are shown in Table 3 (excluding the year fixed effects).
Export Performance in 16 to 21 OECD Countries, 1972–2000 (column 1) or 1973–95 (columns 2–5)

Sources: Export and output data are from the OECD Stan Data Base. Real exchange rates, labor productivity, and country GDP data (all logged) are from the Penn World Tables (PWT), Mark 6.2 or 6.3; the centralization of bargaining index (logged) is from Iversen (Reference Iversen1999). Countries not coded as SMD in Rogowski and Kayser (Reference Rogowski and Kayser2002) are coded as PR. Proportionality of the electoral system based on Gallagher's (Reference Gallagher1991) vote-seat disproportionality measure (inversed and 0–1).
Notes: Export performance is the share of OECD exports divided by share of OECD output for each country-year. GDP, gross domestic product; OECD, Organisation for Economic Co-operation and Development; PR, proportional representative.
***< .01; **< .05 (standard errors in parentheses). All regressions include year fixed effects (not shown).
We begin by confirming the positive relationship between real exchange rates and export performance shown in Figure 1. Contrary to the conventional wisdom, an increase in the real exchange rate is associated with an improvement in export performance. The magnitude is about 20% of a standard deviation rise in competitiveness for every standard deviation increase in real exchange rates. This is true whether we consider the large sample of 21 countries from 1972 to 2000 (as in Figure 1), or the more restricted sample of 16 countries from 1973 to 1995. Of course, our argument is not that higher real exchange rates cause higher competitiveness, but rather that high real exchange rates are a symptom of wage-setting and educational policies that simultaneously hold down wages in skilled exports while expanding the supply of skilled workers necessary to meet the demand of exporters. We model this combination of policies as a function of coordinated bargaining and PR in column 3 of Table 3.
It turns out that PR always improves export performance, but that the effect is magnified by centralized bargaining. Thus, if the bargaining system is centralized (measured as one standard deviation above the mean), then the predicted effect of PR is about 60% above the effect if the bargaining system is decentralized. In terms of the model, we would interpret this difference as reflecting the difficulty of governments in PR systems to raise competitiveness without the support of a bargaining system that facilitates cooperation among skilled unions.
It is also noteworthy that whereas centralization improves export performance in a PR system by as much as 30% (comparing a system that is one standard deviation above the mean to one that is one standard deviation below), it reduces performance in a majoritarian system by roughly the same amount (in each case, the predicted export performance of the comparison “group”—either PR with decentralization or SMD with centralization—is about 1). In terms of our argument (and the theoretical predictions in Table 1), centralization hurts export performance if skill formation is privately financed because wage compression undermines individual incentives to invest in skills. If the government does not step in to subsidize the cost of training—and we know from past research that public subsidization of training is low in (center-right–dominated) majoritarian systems—then the number of skilled workers would fall and firms in the traded sector would be unable to expand production and exports. Under PR and center-left governments, in contrast, public investment in training would expand the number of skilled workers and hence satisfy the higher demand associated with centralized bargaining and compressed wages. This enables firms to increase exports and capture a disproportionate share of world markets.
In principle, we should be able to confirm that the effect of PR runs through public investment in training by including a measure of such investments, but unfortunately there is no comparative spending data in this area. Instead, we use United Nations Educational, Scientific and Cultural Organization data on the share of an age cohort in either secondary or postsecondary (ISCED5) vocational training. These data are only available for the 1980s and early 1990s, and they do not exhibit any meaningful variance over time. Because vocational training systems are very stable features of the countries we are examining, we instead treat the averages as measures of enduring institutional differences. This will not allow us to move beyond correlation, but it does solve the problem that annual data on spending would cause endogeneity issues with export performance. With these qualifications in mind, the results in column 4 clearly support the notion that public training is the mechanism through which PR affects competitiveness. As expected, centralization continues to play a role, especially under PR, which is the effect of coordinated bargaining on wages.
We believe that these results lend support to our conjecture that industrial relations and political institutions are complementary to each other. Because there is relatively little off-diagonal variance (i.e., PR systems with uncoordinated bargaining and majoritarian systems with coordinated bargaining), this conclusion must be viewed with some caution, but the interaction between PR and coordinated wage bargaining is in fact more pronounced if we use the Gallagher index, which varies over time and is less strongly correlated with coordinated bargaining (r = 0.54) (see column 4 in Table 3).
Most unambiguous is the evidence that PR systems with coordinated bargaining produce better export performance than majoritarian systems with uncoordinated bargaining. On this issue, we disagree with the conclusion in Rogowski and Kayser (Reference Rogowski and Kayser2002) that PR is bad for performance, even if their fundamental argument that PR is associated with higher levels of product market regulation may be correct. If this is the case, then any adverse effects of such regulation on competitiveness must be more than compensated for by the beneficial effects of PR through the collective bargaining and skill formation mechanisms we have identified. There is also no evidence that these positive effects are mitigated by firms in uncoordinated systems investing more in capital-intensive technologies, thus raising productivity and closing the performance gap with coordinated economies (see column 5). Although labor productivity does have a positive effect on exports, it has no effect on the other results.
CONCLUSION
There are two interrelated core arguments in this article. First, centralization of wage bargaining, because it implies the compression of wages between the skilled export sector and the less skilled sheltered sector, and hence high wages in the latter, leads to relatively high prices in the sheltered sector. Because the prices of traded goods are largely determined in world markets, and given that the consumer price index is a weighted average of prices in the traded and sheltered sectors, high prices in the sheltered sector imply high consumer prices and hence a high real exchange rate. This goes a long way, we submit, in accounting for the long-standing purchasing power puzzle in political economy. But centralized bargaining also implies that wages in the export sector are relatively lower, which in turn explains why high real exchange rates go together with high international competitiveness and exports—what we have referred to as the competitiveness puzzle. Combining the two price-wage effects also explains differences across countries in the sectoral division of labor.
The second and related argument is that wage compression is only feasible in the long term if there is a sufficient supply of skilled labor in the traded sector, and this we argue results from a political coalition behind the public provision of training in PR political systems with centralized wage bargaining. In contrast, in majoritarian political systems with uncoordinated wage bargaining, training is private and depends on a high skilled wage premium (hence also more restricted demand). We suggest that these two core logics of political coalition and industrial relations system reinforced each other over long periods of time, producing distinct patterns of comparative advantage, wage compression, and skill formation; this offers a new explanation of the pattern analyzed by Lange and Garrett (Reference Lange and Garrett1985).
But our model can also help throw light on changes over time. During the first three decades after the war, the complementarities in production between skilled and low skilled workers that were the result of the spread of Fordist mass production everywhere led to more centralized and solidaristic wage bargaining, strongly supported by export-oriented business. However, where these developments were not accompanied by a major expansion of public investment in vocational training, such as the United States or Britain, this shift proved tenuous and difficult to sustain. More recent technological changes associated with the end of Fordism have undermined complementarities between skilled and low skilled workers and pose a serious challenge to previously highly coordinated systems. Once unions of skilled workers no longer accept solidaristic wage policies, it is difficult for governments to counter rising inequality through investment in training because such training will not lead to skilled employment unless skilled unions are prepared to reduce their wages. The result is dualism and rising wage inequality, a phenomenon that has become pronounced in Germany and other continental European countries. Yet, it is not an inevitable outcome as illustrated by the Scandinavian cases where low skilled groups still have enough clout in the industrial relations system and in the political system to retain relatively egalitarian solutions with significant new investment in active labor market programs and public education.
Theoretically, our model points to a very different reason for the observed correlation between PR and real exchange rates than in the Rogowski-Kayser model, and it clearly suggests a different perspective on the relationship between PR and competitiveness. Yet, our argument is not necessarily contradictory to theirs. The reason is that wage compression pushes up wages in the sheltered sector so that the danger of low-cost competition to unionized employers in the sector increases. Thus, both the centralized union and sheltered sector employers have an aligned interest in regulating product market competition in services. Because consensus political systems exactly allow for the inclusion in regulatory policy making of representative groups excluded from the governmental coalition, it is a short step to the regulation of competition and hence the safeguarding of profit margins in the service sector. In this perspective, the Rogowski-Kayser argument is complementary to ours, and the relationship between the two approaches seems a fruitful area for further research.
APPENDIX: NEW OPEN ECONOMY MODEL
Preferences, Product Demand Equations, and Price Indices
There are N economies where N is a large number. Each economy I produces one traded good i with quantity ti, and a large number M of services, indexed j, of quantity sIj. The traded good i can only be produced in economy I. It is sold at the same price Pti in every economy (law of one price for traded goods). There is a workforce of size 1 in each economy. In economy I, βI workers have specific skills and an hourly productivity of 1 in the production of the traded good ti. 1 − βI workers have only general skills and an hourly productivity of l < 1 in the production of services. (We avoid discussion of the professional class by assuming that they are immobile across sectors, provide the same traded service, and hence earn the same product real wage.) Preferences of all workers in all economies are identical and are generically given by

where e is the number of hours worked. (We can also interpret e as the probability of employment.)
From this utility specification, the demand for T (real value of traded goods) in any one country is

where PT is the (world) price index of traded goods and PC the country-specific consumer price index. The demand for ti in any one country as a function of T is

and substituting this back into the utility function we derive PT:

where for large N PT can be taken as exogenous.
The world demand for ti is then

where is the world demand for traded goods and η is the common elasticity of demand for each traded good. Note that for large N, can be taken as exogenous in any individual economy.
We can analogously derive the total demand for services in say economy I as

where the Is have been made explicit. The demand for the jth service in I is

where  is the common elasticity of demand for individual services.
Substituting back into the utility function, we derive the price index for services in I:

Finally, we can write the consumer price index for I in one of two forms:

Labor Market in I
We now turn to the labor market in economy I. The money wage of a worker in ti is Wti and in sIj is WSj. A skilled worker works eti hours, and an unskilled worker eSIj hours. We assume for simplicity that there is Bertrand competition in the production of each good and service so that

where Pti is the price of the traded good i and PSj of service j (in economy I).
Labor Demand. We derive first the labor demand equation for the ith traded good, and then for each M service. The total labor supply for ti is βI eti; from now on, we drop the I or i subscripts. And because we want labor demand in terms of the consumer real wage, note that  , where wt is the hourly consumer real wage:

Similarly, for the jth service,

where this equation is the same for each service in I.
Wage Equations. There is an independent monopoly union in the t sector and in each j service sector; workers cannot move between sectors. Unions simultaneously set wages to maximize the indirect utility function of a representative worker, subject to the relevant employment demand equation (because of Bertrand pricing profits are uniformly zero).

Given large N and M, each union can take PC, PS, PT as given; the T union can take  , and the jth S union C as given.
This implies the FOCs for the T sector:

and for an individual S sector:

Cost of Training Equilibrium
The final component of the model is the condition that

where the return to training, Ūt / Ūs, is equal to its net cost, 1 + c − σ. (Note that because training subsidies are paid by professionals, they do not affect the results so far.) Because  , and given Equation (14),
 and
 .
Results
We now derive the three results in the text.
Result 1. The C economy will have a higher proportion of the workforce in the traded sector than the U economy, that is βC > βU.
Proof. In the C economy, there is full wage compression. and training is fully subsidized to bring this about. Hence, at βC,  . In the U economy, with βU,
 . Because wt 2(β) < 0 (from Proof in Result 3) and wS 2(β) > 0 (from Proof in Result 3) for 1 > β > 0, βC > βU.
Result 2. The real exchange rate in a C economy is higher than in a U economy.
Proof. The real exchange rate is PCI / C, where C is the average consumer price index in the rest of the world. Because C is independent of βI, we need to show that an increase in βI increases PCI. Dropping I and i subscripts,
 in equilibrium because service sectors are identical. From Equation (22),
 so that
 , implying
 . Using Equation (16),
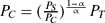 , where PT is fixed with large N. Hence,
 . Thus, from Result 1, the real exchange rate is higher in a C economy than in a U economy.
Result 3. The international competitiveness of a C economy, measured in terms of relative unit labor costs, is higher than that of a U economy. This holds as long as α > β.
Proof. From Equation (11), given Bertrand pricing and because productivity is assumed uniformly equal to 1, and with large N,  measures unit labor costs in the rest of the world, and hence t ≡ Wti /PT measures I's relative unit labor costs. Noting that
 , we can write
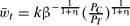 from Equation (21). From the proof of Proposition 1,
 , and from Equation (16),
 , so
 . This implies
 iff α > β. Because βC > βU, the result holds.
(We would normally expect the condition α > β to hold for similarly sized economies as modeled here given differences in labor productivity between traded and services sector. The perverse case where the preference for services, 1 − α, is very large means that a switch of labor from services to traded goods implies a rise in PC and a fall in wt sharp enough that  falls by more than β rises. This then means that trises rather than falls with ti falling corresponding to the fall in βet.)
 as var(u) goes to zero; hence, close to zero. So, we follow Achen's advice and use the Prais-Winsten transformation to eliminate autocorrelation and correct first period heteroscedasticity, and then use PCSEs with OLS on the transformed data.
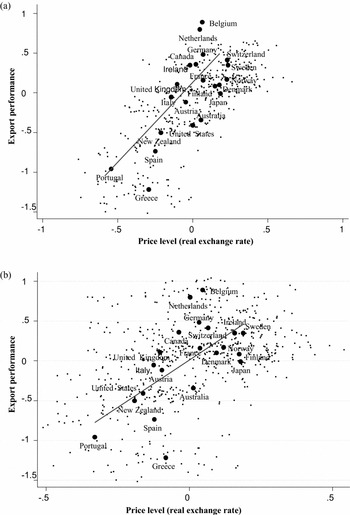
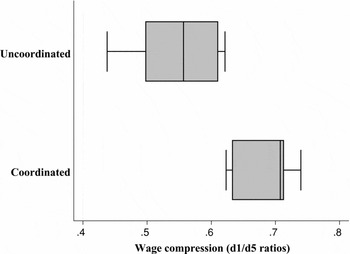
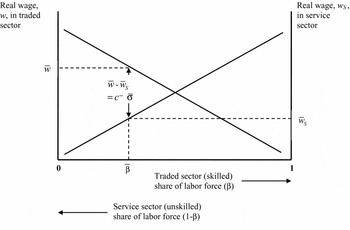
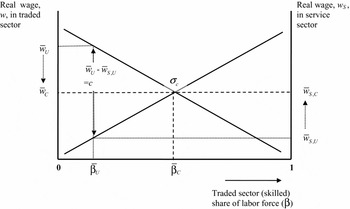
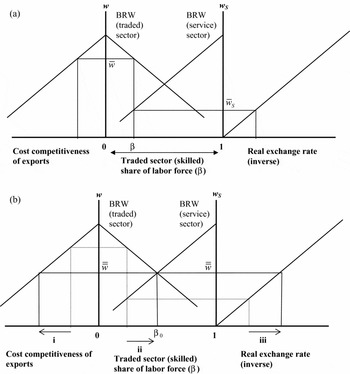
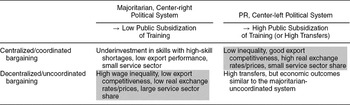
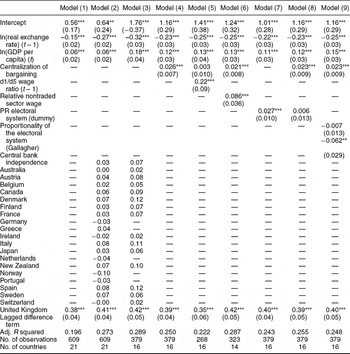
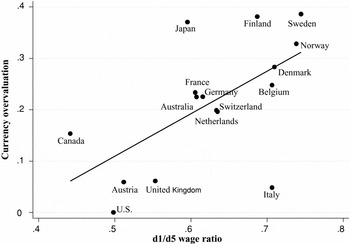
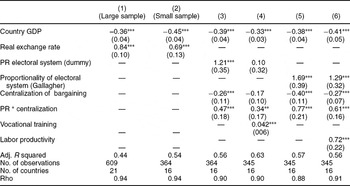




Comments
No Comments have been published for this article.