In the past 25 years, education funding in Oklahoma has stagnated. In some schools, students learn about American politics from tattered textbooks in which George W. Bush is listed as the current president (Hendry and Pasquantonio Reference Hendry and Pasquantonio2018). Across the board, teachers are grossly underpaid, yet many are compelled to buy school supplies with their own funds (Felder Reference Felder2018a). Moreover, in one out of five schools, students come to class only four days a week (Carlson Reference Carlson2018). After the state legislature failed to pass a funding package to sufficiently increase spending on schools and salaries in early 2018, teachers across Oklahoma walked out on their jobs to protest at the Capitol for nine days. In addition to sharing their grievances, the hundreds of protesting educators had something else in common: many were women.
The link between gender and education is neither new nor surprising. More than 75% of public-school teachers are women (National Education Association 2015), and the two largest teachers’ unions are led by women. Consistent with this, much of the public perceives women candidates as more competent on education policy because of their gender (Bauer Reference Bauer2019; Fox and Oxley Reference Fox and Oxley2003; Huddy and Terkildsen Reference Huddy and Terkildsen1993). In a process called “group implication” (Winter Reference Winter2008), attitudes toward particular groups often become linked to policy opinions. Gender attitudes can be linked to healthcare and childcare policy (Barnes and Cassese Reference Barnes and Cassese2017; Winter Reference Winter2008) and racial attitudes are tied to policy preferences on welfare, crime, social security, and immigration (Brader, Valentino, and Suhay Reference Brader, Valentino and Suhay2008; Gilens Reference Gilens1999; Gilliam and Iyengar Reference Gilliam and Iyengar2000; Mendelberg Reference Mendelberg2001; Pérez Reference Pérez2010; Valentino, Brader, and Jardina Reference Valentino, Brader and Jardina2013; Winter Reference Winter2008). This article explores such a connection between gender and education.
Using the 2018 state legislative elections in Oklahoma as a case study, we tested how education’s association with women shapes political preferences on education spending and voter behavior. We argue that the teacher walkout activated gender attitudes and encouraged voters to draw on these beliefs when they cast their ballots in 2018.
THEORETICAL EXPECTATIONS
Policies often are associated with particular groups, which influences political attitudes and behavior. This process of group implication occurs when a group is viewed as a policy beneficiary, which leads to an association between beliefs about that group and issue opinions. Social groups’ implication with policies eventually can crystallize such that beliefs about these implicated groups shape policy opinion—even when the policy lacks an explicit connection to that group (Nelson and Kinder Reference Nelson and Kinder1996; Winter Reference Winter2008). Education is an issue traditionally associated with women, and we argue that attention surrounding the Oklahoma teacher walkout intensified this association because of the prominent role women played in the walkout and the media focus on them.
Education is an issue traditionally associated with women, and we argue that attention surrounding the Oklahoma teacher walkout intensified this association because of the prominent role women played in the walkout and the media focus on them.
For example, during the nine-day protest, the 15 articles published about the walkout in Oklahoma’s most widely circulated daily newspaper directly quoted 25 striking teachers, teacher spokespersons, and teacher organizers who are women.Footnote 1 The same articles quoted only 10 men. The media also predominantly displayed images of women teachers during this time and highlighted women’s advocacy groups. One group’s advocacy went viral when 100 women attorneys walked from the Oklahoma Bar Association to the state Capitol dressed in all black to support “ending the educational funding nightmare” (Weiss Reference Weiss2018). The perception of a women-led walkout violates the norm of men playing the predominant role in political life (Alexander and Andersen Reference Alexander and Andersen1993; Kahn Reference Kahn1996); therefore, it may have implicitly prompted a stronger association between gender beliefs and individuals’ attitudes toward education policy. Because of this increased symbolic attachment between gender and education, we expected that gender attitudes (i.e., sexism) are tied to preferences for educational spending.
Hypothesis 1: Sexism will be negatively associated with support for the teacher walkout, for increased educational spending, and for increased teacher pay.
Additionally, the Oklahoma teacher walkout seemed to pit teachers against the Republican-dominated state legislature and Republican governor. Although walkout participants were ideologically diverse, much of the media coverage of the walkout drew a sharp contrast between the protesters and Republican legislators, framing the issue as a revolt against conservative policies on taxation and spending (Felder Reference Felder2018b). Moreover, the public disagreement between the GOP and the predominantly women teachers may have promoted the idea that the Republican Party is not aligned with women’s interests.
Republican criticism of the walkout often struck a sexist tone such as when lawmakers chastised the teachers for acting like petulant children. The Republican governor, Mary Fallin, compared the teachers to a teenager demanding a better car; a Republican state representative promised, “I’m not voting for another stinking measure when they’re acting the way they’re acting” (Galchen Reference Galchen2018). In short, the tenor of the Republican-dominated criticism portrayed teachers as undeserving and entitled—rhetoric often used to delegitimize the political demands of marginalized groups (Gilens Reference Gilens1999). The tension between the GOP and the protesting teachers informed our next two expectations.
Hypothesis 2: Sexism will be negatively associated with voting for Democratic candidates.
Hypothesis 3: Opposition to the teacher walkout will be negatively associated with voting for Democratic candidates.
The linkage between attitudes toward social groups and political issues varies over time, responding to the political agenda, events, and changes in media coverage (Gilens Reference Gilens1999; Winter Reference Winter2008). Therefore, we expected the association between sexism and education funding preferences to be stronger in 2018 than 2016 because women were the leaders behind these public, political efforts. This is not to say that sexism did not shape voters’ decision making in 2016; sexism certainly was activated in the presidential race (Bracic, Israel-Trummel, and Shortle Reference Bracic, Israel-Trummel and Shortle2019; Cassese and Barnes Reference Cassese and Barnes2019; Cassese and Holman Reference Cassese and Holman2019; Frasure-Yokley Reference Frasure-Yokley2018). However, we did not expect gender to have been implicated specifically with regard to education in 2016. The gendered context of Oklahoma’s educational-policy debate rhetoric during the walkout likely led to a stronger connection between sexism and educational policy preferences in 2018. This led to our final expectation.
Hypothesis 4: The association between sexism and education policy preferences will be stronger in 2018 than in 2016.
DATA AND METHODS
We used original data from the 2016 and 2018 Oklahoma City Election Day exit polls to test our hypotheses (Bracic, Israel-Trummel, and Shortle Reference Bracic, Israel-Trummel and Shortle2016; Reference Bracic, Israel-Trummel and Shortle2018). In 2016, we surveyed 1,317 respondents at 12 precincts in both racially segregated and racially diverse neighborhoods in Oklahoma City; in 2018, we surveyed 1,360 respondents at the same precincts. Exit polls offer researchers opportunities to test how confirmed voters make their decisions (Benjamin Reference Benjamin2017; Benjamin and Miller Reference Benjamin and Miller2019; Bracic, Israel-Trummel, and Shortle Reference Bracic, Israel-Trummel and Shortle2017; Lupia Reference Lupia1994). To comply with state election law and decrease social-desirability bias, all surveys were self-administered by respondents rather than completed face to face (Bishop and Fisher Reference Bishop and Fisher1995).
Our key independent variables were measures of gender attitudes developed from well-established prior work (Alexander and Andersen Reference Alexander and Andersen1993; Bracic, Israel-Trummel, and Shortle Reference Bracic, Israel-Trummel and Shortle2019; Sanbonmatsu Reference Sanbonmatsu2002). Respondents were asked to indicate their agreement with the following two statements on a four-point scale:
1. Most men are better suited emotionally for politics than are most women.
2. A man should be in control of his wife.
We modeled the following dependent variables: educational policy preferences in 2018 (i.e., support for the teacher walkout, educational spending, and increased teacher pay); Democratic vote in 2018 state legislative and congressional elections; and 2016 vote on State Question (SQ) 779, which would have created a penny sales tax to help fund educational spending, including a $5,000 raise for teachers.
Several of the precincts we surveyed had uncontested legislative races and, per Oklahoma law, those races did not appear on voters’ ballots. Therefore, we analyzed only the legislative vote of those that had a contested race (i.e., Districts 83 and 85 for State House; Districts 40 and 48 for State Senate). Our analysis includes a host of control variables listed in tables 1–3 (see the appendix for the wording of all questions).
2018 Support for Teacher Walkout, Educational Spending, and Teacher Pay
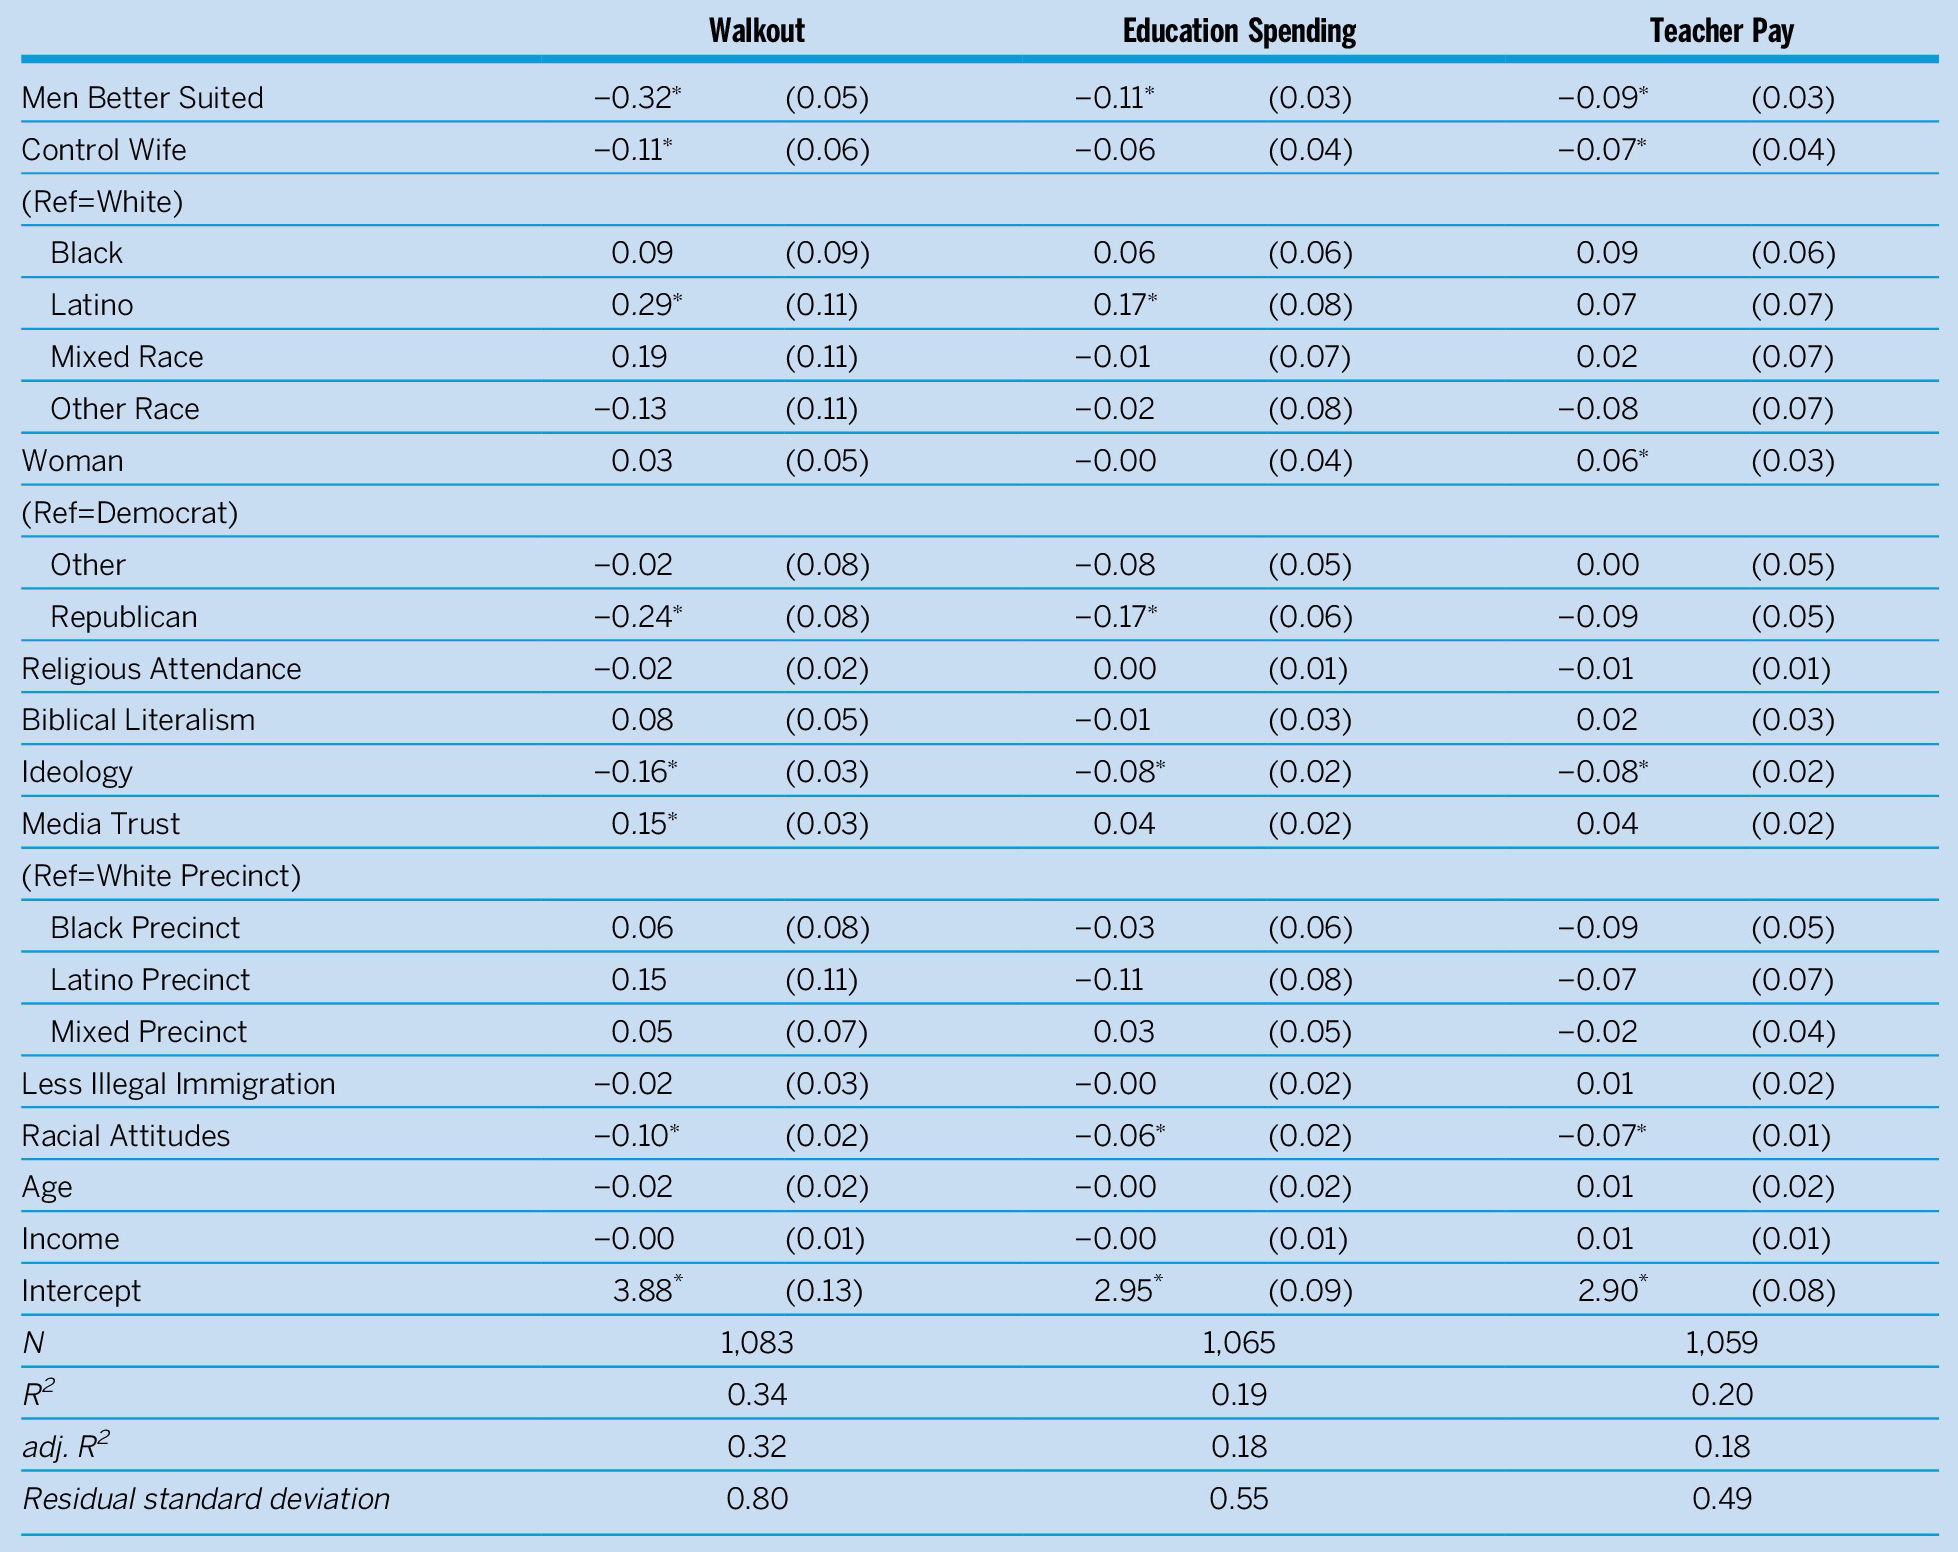
Notes: ∗Significant at p<0.05. These are OLS regression models with standard errors in parentheses. The dependent variables for these models are, in order, support for the 2018 teacher walkout, support for increased educational spending, and support for increased teacher pay. For the variable racial attitudes, the question wording is slightly different between 2016 and 2018 but both are a five-point scale that capture anti-Black racial attitudes (see the appendix).
2018 Democratic Vote for State House, State Senate, and Congress
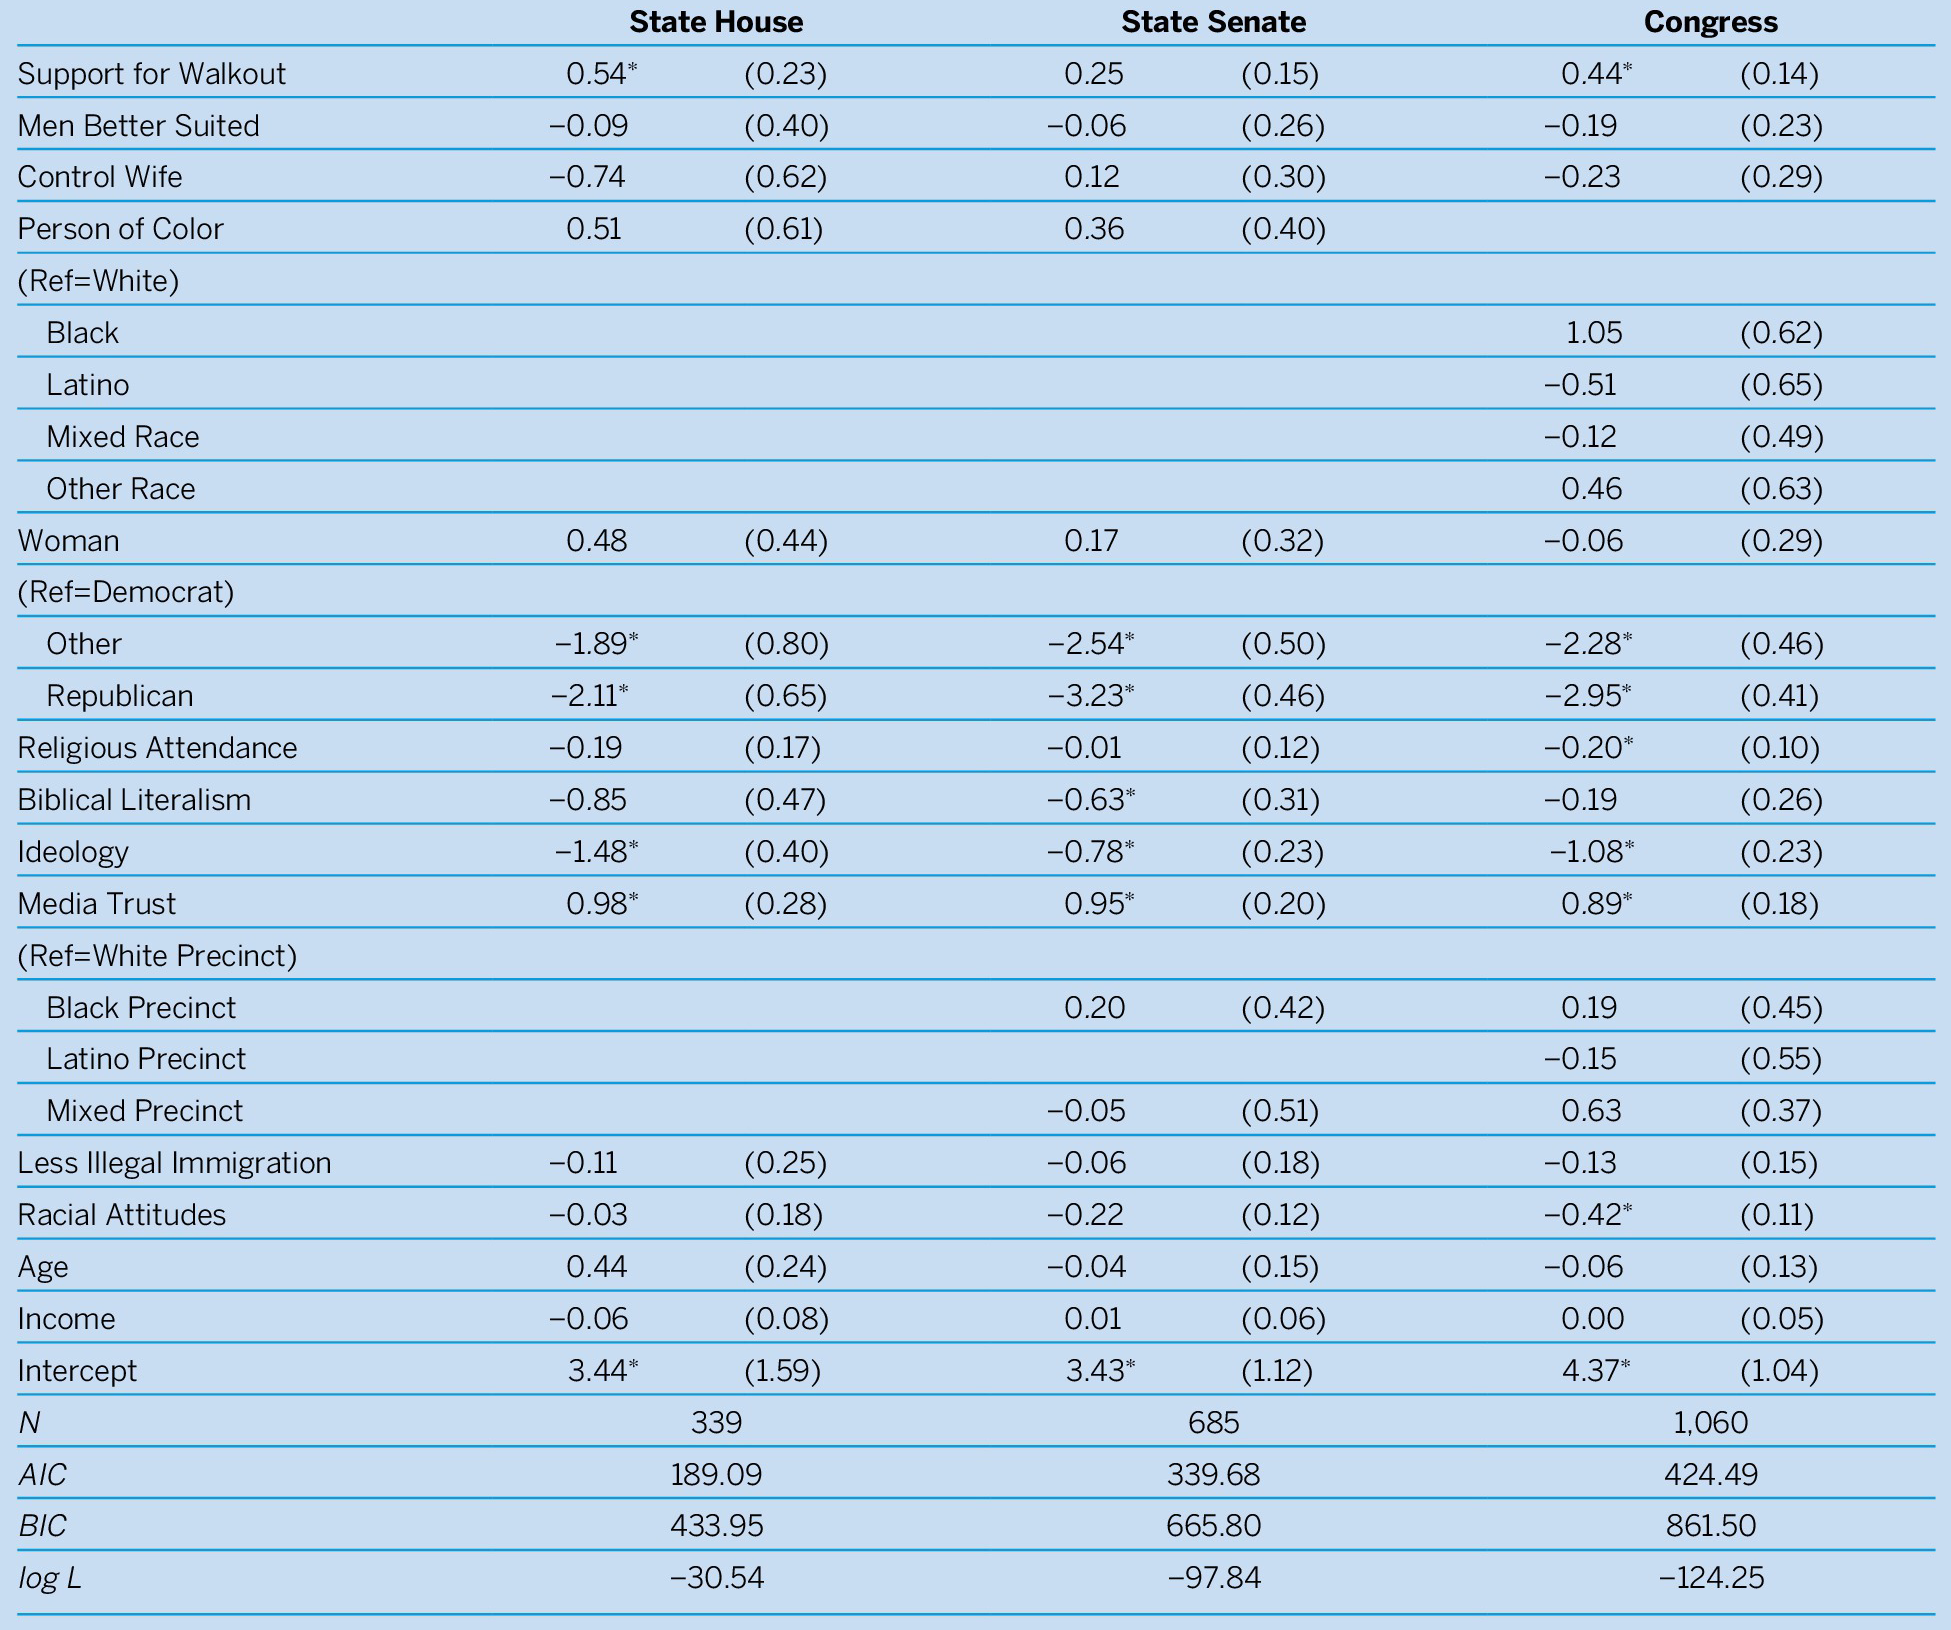
Notes: ∗Significant at p<0.05. These are logistic regression models with standard errors in parentheses. The dependent variables for these models are, in order, Democratic vote for the Oklahoma State House, Democratic vote for the Oklahoma State Senate, and Democratic vote for the US House of Representatives. Some precincts had an uncontested State House or State Senate race; therefore, those respondents were excluded from this analysis. Because of the lack of racial diversity in respondents who voted in State House and State Senate elections, the race variable was collapsed into a binary of whether the individual was white or a person of color. Additionally, the precinct variable was excluded from the State House model due to uncontested races.
2016 Support for SQ 779
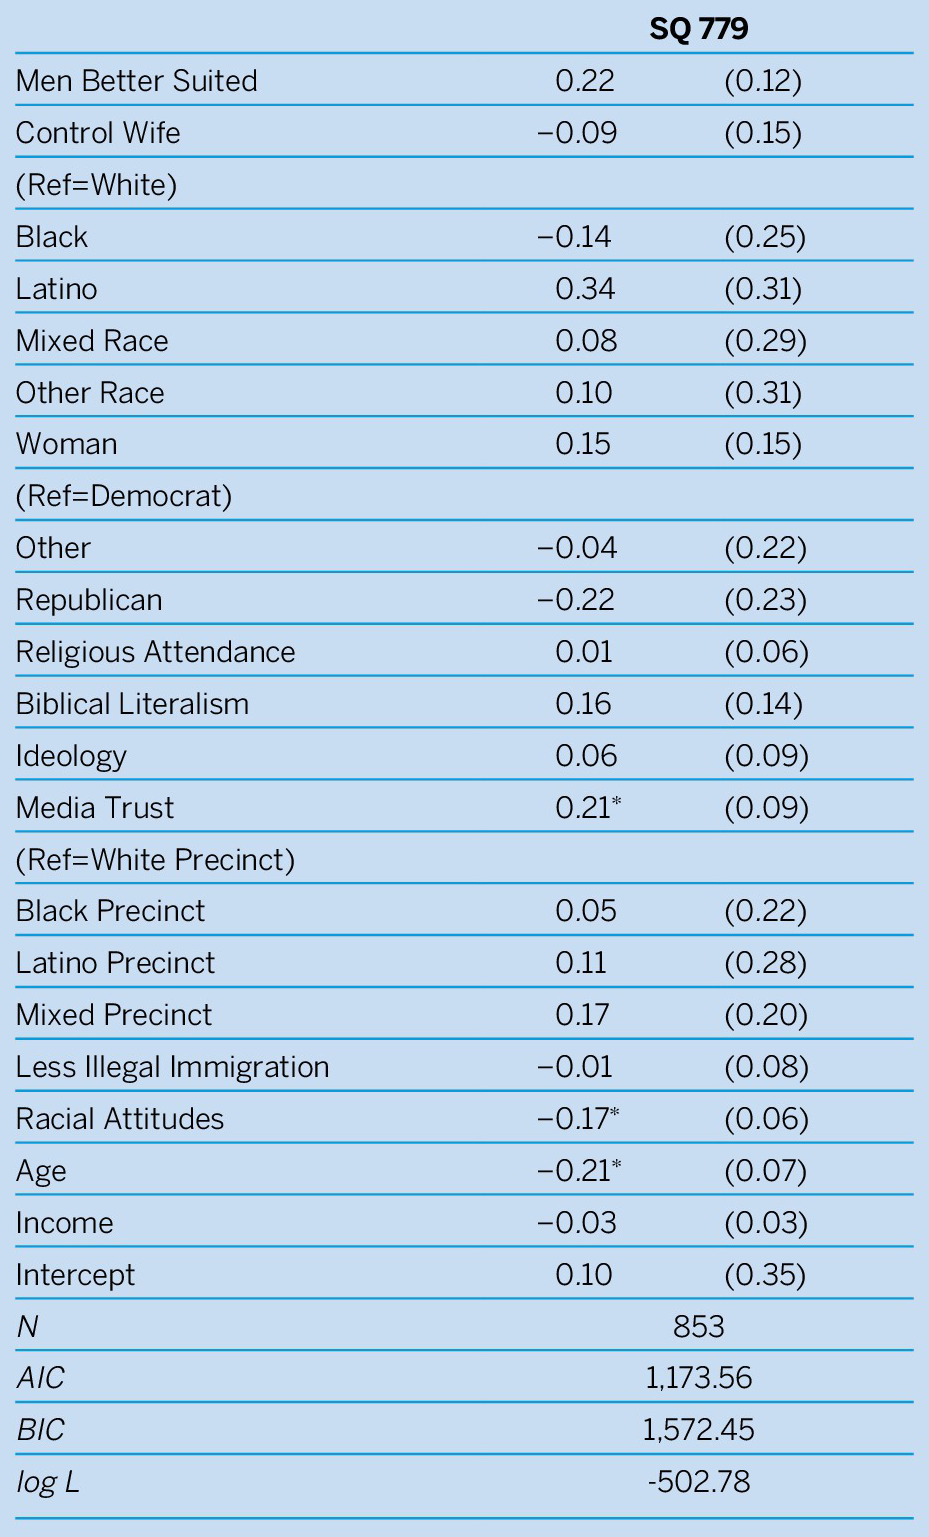
Notes: *Significant at p<0.05. This is a logistic regression model with standard errors in parentheses. The dependent variable for this model is the vote on SQ 779, with 1 coded as a “yes” vote to increase sales taxes for education funding.
RESULTS
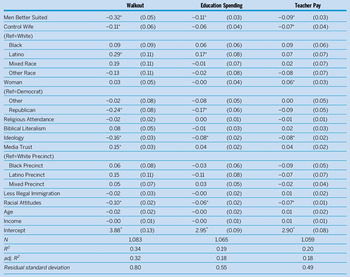
Table 1 presents results from OLS regressions that examine the relationship between sexism and educational policy preferences in 2018. In the first model of walkout support, we found a statistically significant relationship between both sexism measures and support for the walkout. A respondent who disagrees most strongly with the idea that men are better suited for politics than women was expected to score 0.97 higher on the five-point walkout support measure than someone who agrees strongly. The association with the wifely control measure is smaller. Those who agree most with the statement were expected to score 0.34 lower on the support for the walkout scale than those who reject the idea that husbands should control their wives. Similarly, we found a statistically significant and negative association between the sexism measures and support for increased educational spending and teacher pay, although the wifely control measure fails to achieve significance in the education spending model. Overall, the findings in table 1 support H1 and our argument that public attention surrounding the teacher walkout activated gender attitudes and their symbolic attachment to attitudes on education.
Overall, the findings in table 1 support H1 and our argument that public attention surrounding the teacher walkout activated gender attitudes and their symbolic attachment to attitudes on education.
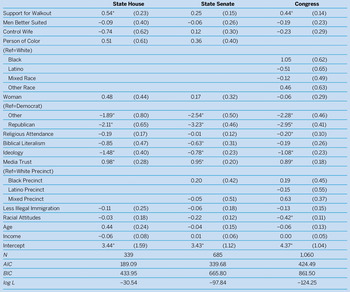
We next explored the relationship among sexism, attitudes regarding the walkout, and voting for Democrats across a variety of offices (H2 and H3). Table 2 presents results from regressions examining the Democratic vote for the Oklahoma House of Representatives, Oklahoma Senate, and US House of Representatives. In each model, we found no evidence that sexism is related to voting for Democrats; therefore, we rejected H2. However, we did find that walkout support is positively associated with voting for Democratic State House and congressional candidates. For example, holding all other variables at their mean or mode, a Republican respondent with the lowest level of walkout support has a 0.35 predicted probability of voting for a Democrat for State House, whereas a Republican respondent who was most supportive of the walkout has a 0.82 predicted probability of voting Democratic. Therefore, we have support for H3: walkout support is associated with voting for Democratic candidates in 2018.
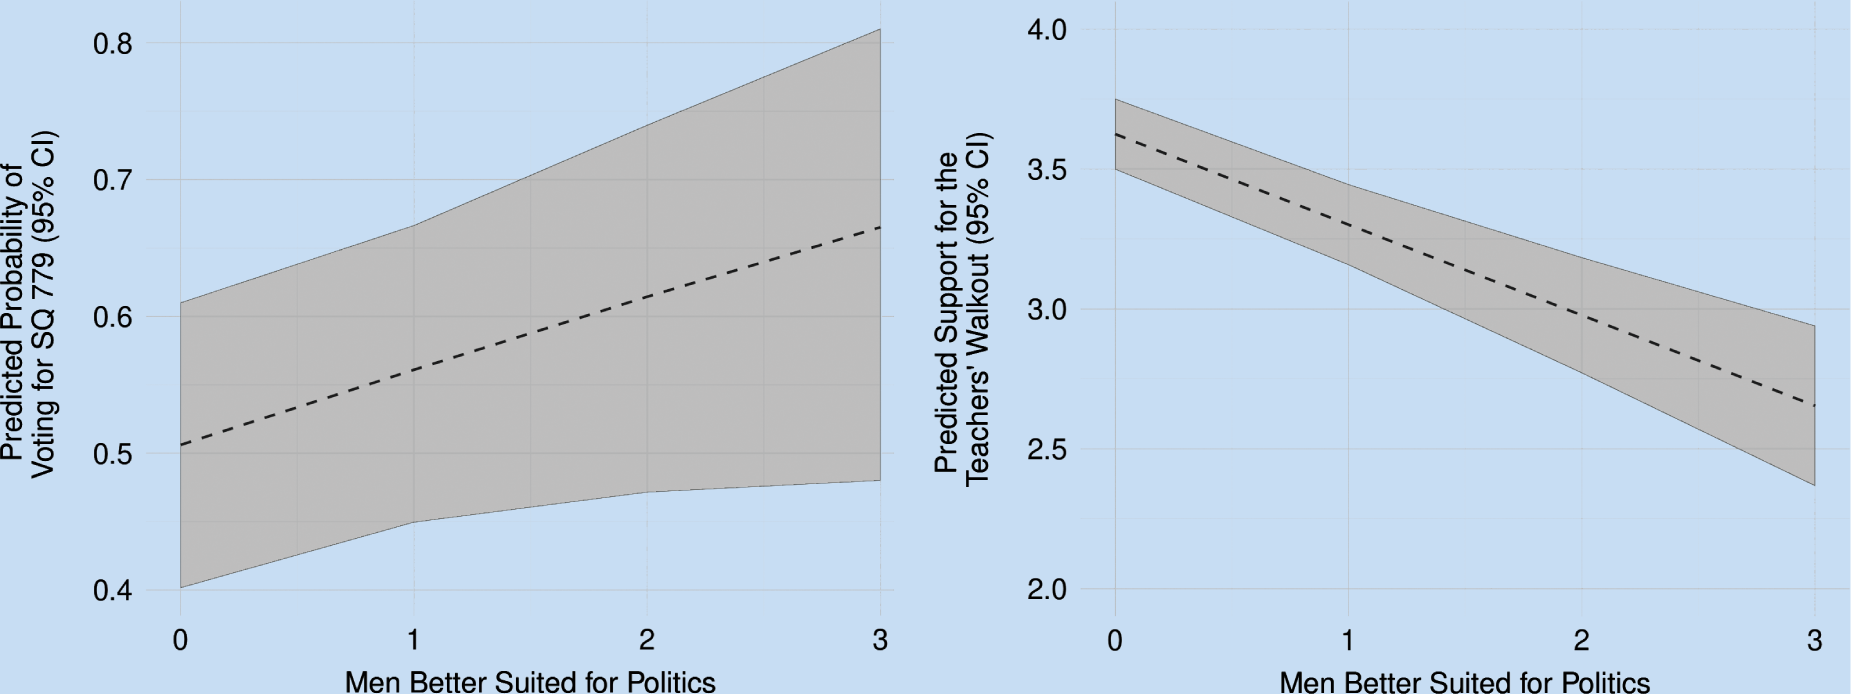
Finally, we compared behavior in 2018 to 2016 to test whether the association between sexism and education attitudes was intensified after the teacher walkout. Table 3 estimates the association between sexism and 2016 vote for SQ 779, which would have implemented a penny sales tax to fund state education spending. Ultimately, SQ 779 was defeated with 59.4% voting against it. It was more popular in Oklahoma City but still failed among our sample with 50.2% voting no. Although table 1 shows that sexism is linked to preferences for educational spending, teacher pay, and support for the walkout in 2018, we found no significant association between sexism and the 2016 SQ 779 vote in table 3. Figure 1 shows the strengths of these associations in 2016 and 2018. Given that much of the debate around SQ 779 focused on the dire need to increase teacher pay and school funding (Wendler Reference Wendler2016), the null result of sexism in 2016 is striking compared to the table 1 models of precisely those policies in 2018. Clearly, sexism is more relevant to education policy preferences, specifically, in 2018 than in 2016, which is evidence in support of our fourth hypothesis.
Sexism and Predicted Support for Education in 2016 and 2018
(1a) Yes Vote on SQ 779, 2016(1b) Support for Walkout, 2018
DISCUSSION
Our evidence suggests that the 2018 Oklahoma teacher walkout helped link gender to education policy preferences. Support for the walkout was associated with Democratic vote choice, and sexism was more strongly associated with education policy preferences in 2018 than in 2016. To be sure, our evidence is observational rather than causal, but our findings support our argument that the teacher walkout increased attention to education and implicated gender.
Our results provide evidence of group implication in education policy. Research shows that education is viewed as a “women’s issue” but, to our knowledge, no other study has shown that gender can be implicated with respect to education policy such that sexism is associated with decreased support for educational resources.
Research shows that education is viewed as a “women’s issue” but, to our knowledge, no other study has shown that gender can be implicated with respect to education policy such that sexism is associated with decreased support for educational resources.
This finding may be surprising to some—after all, education is a public good primarily benefiting children—but it demonstrates the power of group implication. As Winter (Reference Winter2008, 3) argued, “[i]deas about gender and race are salient and easy to grasp, and they include strong emotional and normative implications.” When gender becomes salient to a particular issue, even when the issue is not clearly about gender, how citizens think about gender can be powerfully linked to opinion formation.
Supplementary Materials
To view supplementary material for this article, please visit http://dx.doi.org/10.1017/S1049096520000220.