INTRODUCTION
Maize (Zea mays L.) is a primary staple food crop in West Africa and its importance in the sub-region is rapidly increasing because of its high productivity, wide adaptation and relative ease of cultivation, processing, storage and transportation. These have increased the potential of the crop to combat the food security challenges posed by the population increase in West Africa (Byerlee & Eicher Reference Byerlee and Eicher1971). Maize has a higher yield potential and it is more responsive to fertilizer application than the traditional staple cereal crops in the savanna agroecosystem, sorghum and millet. It is projected that the demand for maize in West Africa will be higher than for rice within the next two decades (Pinstrup-Anderson et al. Reference Pinstrup-Anderson, Pandya-Lorch and Rosegrant1999), because it is cheaper, and easier to cultivate and process. Therefore, increasing maize productivity is a key priority for African agricultural development to reduce poverty and hunger and thus forms the cornerstone of the proposed African Green Revolution (Ejeta Reference Ejeta2010).
During the last two decades, the International Institute of Tropical Agriculture (IITA), in collaboration with the National Agricultural Research Systems (NARS), has developed drought-avoiding, extra-early maize varieties (80–85 days to maturity) that fit the conditions of the savanna agroecology of West Africa. The availability of the extra-early cultivars has significantly contributed to the rapid spread of maize into the savannas, replacing the traditional crops such as sorghum and millet, especially in the Sudan savanna and the northern fringes of the northern Guinea savanna, where the short duration of rainfall had long prevented maize production. These earlier maturing cultivars can be harvested much earlier in the season than the traditional sorghum and millet crops and thus play a very important role in filling the hunger gap in July in the savanna zone, when all food reserves are depleted after the long dry season. Furthermore, there is a high demand for the early (90–95 days to maturity) and extra-early cultivars in the forest zone for peri-urban maize consumers. They provide farmers the opportunity to market the early crop as green maize at a premium price, in addition to being compatible with cassava for intercropping (IITA 1992). Another important advantage of the early and extra-early cultivars is that they provide farmers in various growing areas with flexibility in the dates of planting.
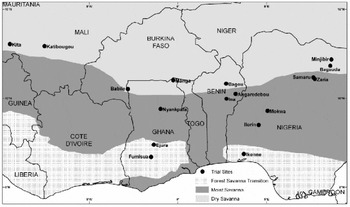
Regional Uniform Variety Trials (RUVT) involving extra-early maturing cultivars have been organized by IITA in collaboration with the NARS partners of West Africa during the last two decades. The RUVT-Extra-early cultivars, which are packaged and dispatched by IITA to collaborators, serve as the vehicle for the exchange of germplasm and cultivars among the NARS of the sub-region. The trials offer the NARS partners the opportunity to select promising cultivars for on-farm testing and release, or for the introgression of favourable alleles into the breeding populations of national maize programmes to broaden the genetic base. Results of multi-location trials in West and Central Africa have revealed the existence of genotype×environment interactions (G×E) (Fakorede & Adeyemo Reference Fakorede and Adeyemo1986; Badu-Apraku et al. Reference Badu-Apraku, Fajemisin, Diallo, Badu-Apraku, Akoroda, Ouedraogo and Quin1995, Reference Badu-Apraku, Abamu, Menkir, Fakorede, Obeng-Antwi and The2003, Reference Badu-Apraku, Lum, Fakorede, Menkir, Chabi, The, Abdulai, Jacob and Agbaje2008; Badu-Apraku & Lum Reference Badu-Apraku and Lum2007). The presence of a significant G×E complicates the selection of superior cultivars and the best testing sites that can be used to identify superior and stable genotypes. This calls for the extensive testing of cultivars in multiple environments over years before cultivars are recommended. During the past two decades recurrent drought, desertification and global warming have considerably reduced the area of agro-ecological zones in West and Central Africa (Fig. 1), such as the rainforest ecology, while the forest–savanna transition zone appears to have become blended into the Guinea savanna (Menkir Reference Menkir and Badu-Apraku2003). It is therefore important that the appropriateness of test locations in the various mega-environments of the sub-region are continuously assessed for the efficient and successful deployment of maize cultivars with high yield potential adapted to the various agro-ecologies for increased adoption by farmers. Furthermore, a protocol on seeds was signed by the Heads of States of Economic Community of West African States (ECOWAS) member countries in 2009, and the West African Catalogue of Plant Species and Varieties (COAFEV) is presently available in the sub-region (FAO 2008). The seed catalogue, which contains the list of varieties whose seeds can be produced and commercialized within the territories of the 17 member countries of ECOWAS, is an aggregate of the varieties registered in the national catalogues of the Member States. The catalogue offers a unique opportunity for the movement of good quality seeds of improved maize varieties and hybrids across the borders of the ECOWAS countries for production and marketing. As a result of this new development in the seed sectors of the ECOWAS member countries and the implications of global warming, desertification and recurrent drought, there is a need for a re-examination of the current mega-environments and the identification of core testing locations in each of the mega-environments in West Africa. This will facilitate the selection of high yielding and stable extra-early cultivars for seed production and marketing across the countries of West Africa.
Locations in the major agro-ecological zones in West Africa used for testing extra-early maize cultivars in the RUVT extra-early from 2006 to 2009.

Several methods are available for the analysis and interpretation of multi-environment trial (MET) data (Yates & Cochran Reference Yates and Cochran1938; Williams Reference Williams1952; Finlay & Wilkinson Reference Finlay and Wilkinson1963; Eberhart & Russell Reference Eberhart and Russell1966; Gollob Reference Gollob1968; Mandel Reference Mandel1969, Reference Mandel1971; Gauch Reference Gauch1988; Zobel et al. Reference Zobel, Wright and Gauch1988; Cornelius et al. Reference Cornelius, Van Sanford and Seyedsadr1993; Crossa & Cornelius Reference Crossa and Cornelius1997; Gauch & Zobel Reference Gauch and Zobel1997; Yan et al. Reference Yan, Hunt, Sheng and Szlavnics2000, Reference Yan, Kang, Ma, Woods and Cornelius2007). Of these statistical tools, the two most powerful for the analysis of MET data are the additive main effects and multiplicative interaction (AMMI) model proposed by Zobel et al. (Reference Zobel, Wright and Gauch1988), Gauch (Reference Gauch1988) and Gauch & Zobel (Reference Gauch and Zobel1997), and the GGE biplot methodology proposed by Yan et al. (Reference Yan, Hunt, Sheng and Szlavnics2000). Several reviews have compared and contrasted AMMI and the GGE biplot with respect to their suitability for G×E analysis (Gauch Reference Gauch2006; Yan & Tinker Reference Yan and Tinker2006; Yan et al. Reference Yan, Kang, Ma, Woods and Cornelius2007; Gauch et al. Reference Gauch, Piepho and Annicchiarico2008; Yang et al. Reference Yang, Crossa, Cornelius and Burgueno2009). Furthermore, since there is no clear biological separation between the two terms G and G×E, the AMMI model does not offer any advantage to the breeder for genotypic and site evaluation when analysing MET data. Another powerful statistical model that addresses some of the disadvantages of AMMI is the GGE biplot. The method is effective for identifying the best performing cultivar in a given environment and the most suitable environment for each cultivar, comparing any pair of cultivars in individual environments, identifying the best cultivars for each environment and mega-environment differentiation, the yield and stability of the genotypes, and the discriminating ability and representativeness of the environments (Yan & Kang Reference Yan and Kang2003; Yan & Tinker Reference Yan and Tinker2006; Yan et al. Reference Yan, Kang, Ma, Woods and Cornelius2007). The decision as to whether location-groups could be considered as mega-environments is based on the consistency of location groupings and of the winning genotypes in the individual location-groups across years (Yan et al. Reference Yan, Hunt, Sheng and Szlavnics2000, Reference Yan, Kang, Ma, Woods and Cornelius2007, Reference Yan, Fregeau-Reid, Pageau, Martin, Mitchell-Fetch, Etienne, Rowsell, Scott, Price, De Haan, Cummiskey, Lajeunesse, Durand and Sparry2010). There has been a limited use of the GGE biplot method for the analysis of maize yield data from METs in West Africa (e.g. by Badu-Apraku et al. Reference Badu-Apraku, Lum, Fakorede, Menkir, Chabi, The, Abdulai, Jacob and Agbaje2008, Reference Badu-Apraku, Fakorede, Lum and Akinwale2009, Reference Badu-Apraku, Ewool and Yallou2010).
The objectives of the present study were to compare the effectiveness of GGE biplot and AMMI analysis for: (i) identifying stable and high-yielding maize cultivars with specific or broad adaptation in West Africa; (ii) validating the existing mega-environments; and (iii) identifying core testing sites within each mega-environment for cultivar evaluation, release and marketing across countries in West Africa.
MATERIALS AND METHODS
The regional extra-early variety trials
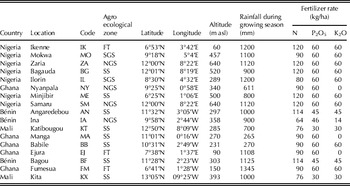
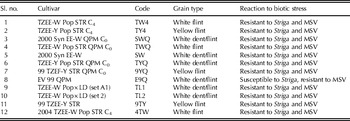
Twelve elite extra-early maturing cultivars comprising seven normal endosperm and five quality protein maize (QPM) cultivars were evaluated from 2006 to 2009 in the RUVT-extra-early trial at 17 locations in West Africa, including seven in Nigeria, five in Ghana, three in Benin and two in Mali (Table 1 and Fig. 1). All cultivars evaluated are Striga tolerant/resistant except for the control cultivar, EV 99 QPM (Table 2). A standard protocol was adopted at each test site during the 4 years. Trials were conducted under rain-fed conditions and were planted when the rains at each experimental site had become fully established. A randomized complete block design with four replications was used for the trial at all sites. A plot consisted of four rows 5 m long, with inter-row spacing of 0 75 m and intra-row spacing of 0 4 m. Three seeds/hill were planted and later thinned to two plants/hill, giving a final population density of 66 666 plants/ha. To optimize crop performance at each site, fertilizer application and pest control were carried out, based on the recommendations for the respective sites in each country.
Description of the test locations for the RUVT of extra-early maturing cultivars conducted in West Africa, 2006–9

* SGS, southern Guinea savanna; NGS, northern Guinea savanna; FT, forest-savanna transition zone; SS, Sudan savanna.
Description of maize cultivars in RUVT extra-early evaluated in West and Central Africa, 2006–2009

The two central rows within each plot were sampled for grain yield and other agronomic traits. A shelling proportion of 800 g/kg (800 g grain/kg ear weight) was assumed for computing grain yields. Grain moisture was measured with a moisture tester from shelled grains from representative ear samples and was subsequently adjusted to 150 g/kg.
Statistical analysis
Combined analysis of variance (ANOVA) across environments was performed on plot means for grain yield using the PROC GLM procedure in SAS (SAS Institute 2002) to determine if the G×E was significant. In the combined ANOVA, environment and replicates were considered as random factors while entries were considered as fixed effects. Subsequently, the data were subjected to GGE biplot analysis to decompose G+G×E (Yan et al. Reference Yan, Hunt, Sheng and Szlavnics2000, Reference Yan, Cornelius, Crossa and Hunt2001, Reference Yan, Fregeau-Reid, Pageau, Martin, Mitchell-Fetch, Etienne, Rowsell, Scott, Price, De Haan, Cummiskey, Lajeunesse, Durand and Sparry2010). The GGE biplots were constructed from the first two principal components (PC1 and PC2) that were derived from subjecting environment-centred grain yield means for each environment to singular value decomposition (SVD). The data used were not transformed (Transform=0), not standardized (Scale=0), and were environment-centred (Centring=2). The biplot was based on environment-focused singular value partitioning (SVP=2) and is therefore appropriate for visualizing the relationships among environments. In cases where relationships among genotypes were desired, the biplots were based on genotype-focused singular value partitioning (SVP=1). The GGE biplot model equation is

where Y ij is the average yield of genotype i in environment j, Y j is the average yield across all genotypes in environment j, λ 1 and λ 2 are the singular values for PC1 and PC2, respectively, ξi 1 and ξi 2 are the PC1 and PC2 scores, respectively, for genotype i, η j1 and η j2 are the PC1 and PC2 scores, respectively, for environment j, ε ij is the residual of the model associated with the genotype i in environment j.
The AMMI analysis was computed using the same mean values to assess relationships among cultivars, environments and G×E. The AMMI model was described by Zobel et al. (Reference Zobel, Wright and Gauch1988), Gauch & Zobel (Reference Gauch and Zobel1988) and Crossa (Reference Crossa1990). This analysis uses principal component analysis (PCA) to decompose the multiplicative effects (G×E) into a number of interaction principal component axes (IPCA). The GGE biplot software Windows application that fully automates biplot analysis (Yan Reference Yan2001) was used for the AMMI analysis. The AMMI model equation (Sadeghi et al. Reference Sadeghi, Samizadeh, Amiri and Ashouri2011) is

where Y ger is the average yield of genotype g in environment e for replicate r, μ is the grand mean, g are genotype mean deviations (mean minus the grand mean), β e are the environment mean deviations, N is the number of SVD axes retained in the model, λ n is the singular value for SVD axis n, ζ gn are the genotype singular vector values for SVD axis n, η en are the environment singular vector values for SVD axis n, θ ge are the interaction residuals, ρ ge are the AMMI residuals and ε ger is the error term.
RESULTS
The results of the combined ANOVA across environments for the 12 cultivars showed that genotype main effect (G), environment main effect (E) and G×E were all highly significant (P<0 001) for grain yield (not shown). The test environments contributed 0 75 of the total variation in the sum of squares for grain yield, while G and G×E sources of variation accounted for 0 03 and 0 22 of the total variation. The contribution of location to the environmental variation was much higher (0 66) than that of years (0 05). As in most multilocational trials in West Africa, the proportion of variation contributed by E was much greater than from the other sources of variation (e.g. Badu-Apraku et al. Reference Badu-Apraku, Abamu, Menkir, Fakorede, Obeng-Antwi and The2003, Reference Badu-Apraku, Ewool and Yallou2010; Badu-Apraku & Lum Reference Badu-Apraku and Lum2007). Of greater interest was the ratio of G over (G+G×E), which was 0 14. Thus, G×E was much greater than G, suggesting the existence of mega-environments for extra-early maize cultivars in West Africa.
GGE biplot analysis of grain yield and stability of extra-early cultivars
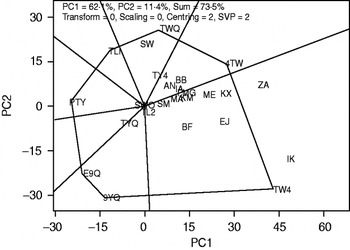
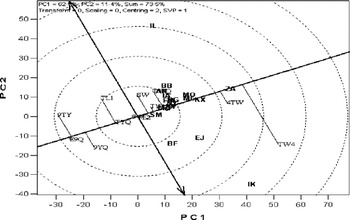
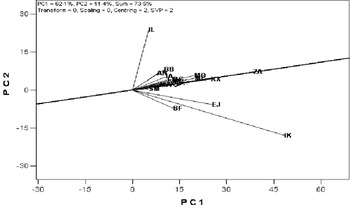
The GGE biplot was constructed by plotting the first principal component (PC1) scores of the genotypes and the environments against their respective scores for the second principal component (PC2) SVD or environment standardization. The PC1 explained 0 62 of total variation in the sum of squares, while PC2 explained 0 11; thus, together they accounted for 0 74 of the G+G×E variation for the grain yield of the extra-early maturing maize cultivars evaluated at 17 locations in four countries of West Africa (Figs 2 and 3).
A ‘which-won-where’ or ‘which-is-best-at-what’ based on a genotype×environment yield data of 12 extra-early maturing maize cultivars evaluated in 17 locations across WA between 2006 and 2009. The data were not transformed (Transform=0), not standardized (Scale=0), and were environment-centred (Centring=2). The biplot was based on genotype-focused singular value partitioning (SVP=2) and is therefore appropriate for visualizing the relationships among environments. Principal component (PC) 1 and PC 2 explained 0 74 of yield variation. See Tables 1 and 2 for the legends.

The ‘mean v. stability’ view of the GGE biplot based on genotype×environment yield data of 12 extra-early maturing maize cultivars evaluated in 17 locations across WA between 2006 and 2009. The data were not transformed (Transform=0), not standardized (Scale=0), and were environment-centred (Centring=2). The biplot was based on environment-focused singular value partitioning (SVP=1) and is therefore appropriate for visualizing the relationships among genotypes. Principal component (PC) 1 and PC 2 explained 0 74 of yield variation. See Tables 1 and 2 for the legends.

The polygon view of the GGE biplot was constructed to show which cultivars performed best in which location (Fig. 2). The vertices of the polygon were the cultivar markers located farthest away from the biplot origin in various directions, such that all cultivar markers were contained within the resulting polygon. This view identified seven cultivars as the markers farthest away from the biplot origin. The vertex cultivar in each sector represented the highest yielding cultivar in the location that fell within that particular sector (Yan et al. Reference Yan, Hunt, Sheng and Szlavnics2000). Based on this, cultivar 4TW was the highest yielding in Babile (BB), Angaredebou (AN), Ina (IA) and Fumesua (FM). Cultivar TW4 was the top-ranking cultivar at Ikenne (IK), Zaria (ZA), Ejura (EJ), Bagou (BF), Samaru (SM), Manga (MA), Kita (KX), Minjibir (ME), Mokwa (MO), Bagauda (BG), Katibougou (KT) and Nyankpala (NY), while cvar TWQ was the highest yielding cultivar at Illorin (IL). Cultivars TL1, 9TY, E9Q and 9YQ were the lowest yielding in all or some of the locations since no environment fell into their sectors. Cultivars TL2, SWQ, TY4, TYQ and SW fell within the polygon, indicating that they were less responsive than the vertex cultivars. This crossover G×E indicated that the target environment could be divided into different mega-environments.
An ideal cultivar should exhibit both high mean performance and stability within a mega-environment. In the average environment coordinate (AEC) of the GGE biplot of grain yield for the extra-early maturing cultivars shown in Fig. 3, the cultivars are ranked along the average-tester axis, with the arrow pointing to a greater value based on their mean performance across all locations. The double-arrowed line separates cultivars with below-average means from those with above-average means. The average yield of the cultivars is approximated by the projections of their markers on the average-tester axis. The arrow shown on the axis of the AEC abscissa points in the direction of higher mean grain yield performance by the genotypes and, consequently ranks the genotypes with respect to mean performance. Based on these interpretations, the cultivars were ranked according to their projections onto the average-tester axis as follows: (TW4=4TW)>(TWQ=TYQ=TY4=SW)>(SWQ=TL2)>(TYQ=TL1)>(9YQ=9TY=E9Q).
In the GGE biplot analysis, the AEC abscissa approximates the genotypes’ contributions to G×E, which is a measure of their instability. The stability of the cultivars is measured by their projection onto the average-tester coordinate (ATC) y-axis double-arrow line. The greater the absolute length of the projection of a cultivar, the less stable it is (Yan et al. Reference Yan, Kang, Ma, Woods and Cornelius2007). Based on this, cultivars TL2 and SWQ were the most stable with an average performance, as they were located almost on the AEC abscissa and had a near zero projection onto the AEC ordinate. This implies that their rankings were highly consistent across locations. In contrast, TW4 was the most unstable and highest yielding cultivar. Cultivar 4TW was among the highest yielding and fairly stable.
Discriminating power and representativeness of the test environments based on GGE biplot analysis
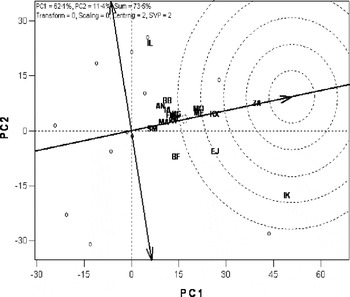
The purpose of test-environment evaluation is to identify environments that effectively identify superior genotypes in a mega-environment. An ideal test environment should be both discriminating of the genotypes and representative of the mega-environment. The discriminating power of an environment refers to its ability to identify an ideal genotype, while the representativeness refers to the ability of a test location to represent the mega-environment (Yan et al. Reference Yan, Kang, Ma, Woods and Cornelius2007). The discriminating power v. representativeness view of the GGE biplot analysis is presented in Fig. 4. Since the AEC abscissa is the average-environment axis, test environments at small angles to the average-environment axis are more representative of the mega-environment than those at large angles to it. Therefore, the cosine of the angle between any environment vector and the average environment axis approximates the correlation coefficient between the genotype values in that environment and the genotype means across the environment (Yan et al. Reference Yan, Kang, Ma, Woods and Cornelius2007). The small circle is the average-environment and the arrow pointing to it is used to indicate the direction of the AEA. The absolute length of the projection from the marker of an environment onto the ATC y-axis is a measure of its representativeness: the shorter the projection, the more representative the environment. In contrast, the absolute length of the projection from the marker of an environment onto the ATC x-axis is a measure of its discriminative ability: the longer the projection, the more discriminative the environment. Based on these requirements, the SM location was the most representative but not discriminating. The IK location was highly discriminating (far away from the origin) but not representative (large projection onto the ATC y-axis). Location IL was the least representative of the mega-environments since it had the largest angle with the AEC abscissa. It therefore implies that IK and IL locations, which had long vectors and large angles with the AEC abscissa, cannot be used in selecting superior genotypes, but can be used effectively in culling unstable genotypes. The ZA location was the most representative and most highly discriminating of the test environments (Fig. 5). This indicated that ZA, located in the Northern Guinea savanna zone of Nigeria and characterized by moderately high rainfall (1120 mm), represented the ideal test location for the extra-early maturing cultivars. This location would therefore be the most appropriate for selecting superior cultivars.
The ‘discriminating power and representativeness’ view of GGE biplot based on a genotype×environment yield data of 12 extra-early maturing maize cultivars evaluated in 17 locations across WA between 2006 and 2009. The data were not transformed (Transform=0), not standardized (Scale=0), and were environment-centred (Centring=2). The biplot was based on genotype-focused singular value partitioning (SVP=2) and is therefore appropriate for visualizing the relationships among environments. Principal component (PC) 1 and PC 2 explained 0 74 of yield variation. See Table 1 for the legend.

The biplot view showing the ranking of the 17 locations in WA based on both the discriminating ability and representativeness of the locations. The data were not transformed (Transform=0), not standardized (Scale=0) and were environment-centred (Centring=2). The biplot was based on genotype-focused singular value partitioning (SVP=2) and is therefore appropriate for visualizing the relationships among environments. Principal component (PC) 1 and PC 2 explained 0 74 of yield variation. See Table 2 for the legend.

The environments with shorter vectors were less informative than those with longer vectors. Based on this information, ZA, KX, IK, EJ, MO, ME and IL had the longest vector lengths and were therefore the most discriminating locations. BG, FM, BF, NY, KT, BB, IA, MA, AN and SM had shorter vector lengths and thus provided little or no information about the genotypes; therefore, they should not be used as test environments. Among the most discriminating locations, ME, MO, KX and ZA were highly correlated in their ranking of the genotypes, indicating that these locations produced similar information about the genotypes. The implication is that some of these locations are redundant and could be dropped to reduce the costs of field evaluation without any loss of information. IK and EJ were highly correlated in their ranking of the cultivars, whereas IL stands alone. An ideal test location should effectively discriminate genotypes and represent their mega-environment (Yan & Rajcan Reference Yan and Rajcan2002). The biplot display in Fig. 5 identified ZA as the ideal location in West Africa and ranked other locations on the basis of their discriminating power and representativeness in the following order: KX, IK, EJ, MO, ME, BG, FM, BF, NY, KT, BB, IA, MA, AN, IL and SM. Assuming that each mega-environment can be effectively represented by 3–4 test locations, based on representativeness and discriminating power, a set of core testing locations can be identified. Thus, the core testing sites for mega-environment 1 comprise IA, AN and BB. Similarly, mega-environment 2 is represented by ZA, KX, IK and EJ, and the third mega-environment by IL.
AMMI biplot of grain yield and stability of extra-early cultivars
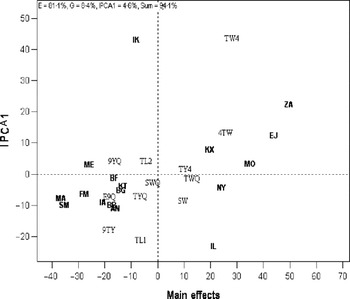
The AMMI biplot with the genotype and environment main effects for grain yield on the x-axis and the IPCA1 scores on the y-axis is presented in Fig. 6. The vertical line is the grand mean for grain yield and the horizontal line (y-ordinate) represents the IPCA1 value of zero. Genotypes close to the horizontal line have small interactions and are considered to be more stable than those further from it. The results of the AMMI biplot analysis of the 12 cultivars evaluated in 17 locations in West Africa showed that E accounted for 0 81 of the total variation in the sum of squares for grain yield, while the G and IPCA1 sources of variation accounted for only 0 08 and 0 05 of the total variation, respectively. A total of 0 94 of the treatment sum of squares were captured by the AMMI biplot, thus making it effective in explaining both the main effects and providing insight into the G×E.
AMMI biplot of grain yield data and the first interaction principal component axis (IPCA 1) of 12 extra-early maturing maize cultivars evaluated at 17 locations across WA between 2006 and 2009. The vertical line is the grand mean, while the horizontal line represents IPCA1 values of zero. See Tables 1 and 2 for the legends.

The biplot revealed large variability among the 17 test locations and the narrow yield range among the 12 cultivars. Cultivars SWQ and TL2 were characterized by IPCA1 scores near zero and therefore had small interaction with the environments and similar grain yield with the grand mean. E9Q, 9YQ and 9TY had similar grain yield response (below the grand mean). In contrast, cultivars TW4 and 4TW had similar grain yield response (above the grand mean) and strong positive interaction with IPCA1 score and thus, the highest yielding cultivars. SW, which was comparable with TY4 and TWQ (above the grand mean), had negative interaction with IPCA1 score, suggesting that important differences exist in the reaction of these cultivars to the different environments. The large positive interaction of TW4 and 4TW with IPCA1 implies that they are probably adapted to favourable environments. In contrast, the negative interaction of SW suggests that this cultivar is likely to be adapted to low-yield environments. The relative closeness of the cultivars TY4 and TWQ, near zero IPCA1, suggest that they have comparable mean grain yields and are similar in their interaction with the different environments, and therefore are the most stable cultivars.
The 12 cultivars evaluated in the present study could be classified into four groups based on the mean grain yield and stability on the AMMI graph (Fig. 6). Group 1 comprised E9Q, TYQ, 9YQ, TL2 and SWQ, which had comparable mean grain yield and were similar in their interaction with the different environments; group 2 consisted of 9TY and TL1; group 3 was composed of SW, TY4 and TWQ, while group 4 consisted of TW4 and 4TW, which were comparable in terms of grain yield and stability. The test locations of the RUVT extra-early could be ranked based on their mean yield on the x-axis of the AMMI graph (Fig. 6). ZA had the highest location mean, while MA had the least. ZA, EJ, MO, YN, IL and KX had location mean above the grand mean, while IK, BG, AN, BB, BF, IA, ME, FM, SM and MA had less than the grand mean. These locations could also be grouped into four: Group A was composed of ME, BF, KT, BG, MA, SM, FM, IA, BB and AN. Group B was made up of ZA, EJ, MO, KX and NY. Group C consisted of IK. Group D was composed of IL. Locations in group A were characterized by negative or zero IPCA1 scores with environment means that were less than the grand means and were therefore classified as low-yield environments. Group B locations had positive or close to zero IPCA scores with environment means above the grand means and were therefore high-yield environments. Both groups, A and B environments, had little interaction with genotypes and would rank the genotypes consistently. The implication is that the two groups of environments provided similar information about the genotypes. In contrast, group C was an environment with a large positive IPCA1 score and location mean below the grand mean and therefore could be regarded as a low-yield environment. Similarly, group D was an environment with a large negative IPCA1 score and a location mean above the grand mean and therefore could be regarded as a low-yield environment. Groups C and D environments had a significant interaction with genotypes and were highly discriminating.
DISCUSSION
Since 1987, RUVT involving extra-early maturing maize cultivars have been organized by IITA in collaboration with NARS partners of WCA for evaluation in a range of environments to select the highest yielding and most-adapted cultivars for further testing and validation in on-farm trials. The combined ANOVA for environments (E), genotypes (G) and G×E interaction were highly significant (P<0 01), suggesting differential responses of the genotypes and the need to identify high-yielding and stable genotypes across the test environments (Badu-Apraku et al. Reference Badu-Apraku, Fajemisin, Diallo, Badu-Apraku, Akoroda, Ouedraogo and Quin1995, Reference Badu-Apraku, Abamu, Menkir, Fakorede, Obeng-Antwi and The2003; Sabaghnia et al. Reference Sabaghnia, Sabaghpour and Dehghani2008; Moghaddam & Pourdad Reference Moghaddam and Pourdad2009). The differential response of genotypes to varying environmental conditions constitutes a major constraint in the identification of superior maize cultivars for narrow or wide adaptation. The presence of a highly significant G×E for grain yield of the extra-early cultivars confirmed the need for the extensive testing of cultivars in multiple environments over years before making cultivar recommendations. The high proportion of the contribution of the environmental main effects and the low proportion of the genotypic main effects to the total sum of squares for grain yield are not surprising since the extra-early maturing varieties included in the RUVT extra-early trials were elite, top-yielding cultivars selected from preliminary observation trials that give them competitive yield levels. These results are consistent with the findings of Fakorede & Adeyemo (Reference Fakorede and Adeyemo1986), Badu-Apraku et al. (Reference Badu-Apraku, Fajemisin, Diallo, Badu-Apraku, Akoroda, Ouedraogo and Quin1995, Reference Badu-Apraku, Abamu, Menkir, Fakorede, Obeng-Antwi and The2003) and Mohammadi et al. (Reference Mohammadi, Amri, Haghparast, Sadeghzadeh, Armion and Ahmadi2009), who reported that the largest proportion of total variation in MET is attributed to environments, whereas G and G×E sources of variation are relatively smaller.
The GGE biplot explained 0 74 of the G+GE, while the AMMI analysis captured 0 13 of the total G + GE, indicating that GGE biplot accounted for more of G+GE variation in grain yield of extra-early cultivars than AMMI graph. These findings are in agreement with those of Yan et al. (Reference Yan, Kang, Ma, Woods and Cornelius2007), who reported that GGE biplot always explains more G+GE than the AMMI graph. In general, the GGE biplot and the AMMI graph produced similar results from the dataset and were useful in interpreting the G×E for grain yield. Both procedures revealed similarities and also the differences among environments in their discrimination of the genotypes, as well as the nature and magnitude of interaction between genotypes and environments. For example, both the GGE biplot and the AMMI graph identified TW4 as the highest yielding cultivar and E9Q as the lowest. The two analyses also provided similar information on the stability of the cultivars. For example, both the GGE biplot and the AMMI graph revealed that TW4 was the highest yielding cultivar, but the most unstable. This suggests that TW4 has specific adaption and can therefore be promoted for adoption in specific locations within the mega-environment.
The GGE biplot and AMMI graph revealed wide diversity among both the locations and the cultivars. The GGE biplot revealed that the locations ZA, IL and IK were very effective in discriminating among the cultivars. The GGE biplot clustered cultivars into seven groups, while the AMMI classified them into four. Yan & Rajcan (Reference Yan and Rajcan2002) defined mega-environment as a group of locations that consistently share the best set of genotypes or cultivars across years. One of the major advantages of the GGE biplot over the AMMI graph is that of mega-environment identification. Three mega-environments were identified by the GGE biplot (Fig. 2), whereas the AMMI graph could not identify any mega-environment. Another advantage of the GGE biplot over the AMMI analysis is that the discriminating power and representativeness view of the former was an effective tool for test-environment evaluation, and facilitated the identification of a minimum set of discriminating and representative core testing sites (Yan et al. Reference Yan, Kang, Ma, Woods and Cornelius2007). The GGE biplot identified the ideal environment as ZA and ranked the environments based on their discriminating power and representativeness. In contrast, the AMMI analysis could not identify an ideal environment or rank the environments. The GGE biplot identified IK in the forest–savanna transition zone, IL in the southern Guinea savanna and ZA in the northern Guinea savanna as key testing sites. The identification of these sites by this statistical tool indicates that they are the best for selecting for high yielding and stable extra-early cultivars in West Africa.
The polygon view of the GGE biplot was superior to the AMMI graph in that it was easier to visualize the ‘which-won-where’ patterns. The results of GGE biplot in Fig. 2 revealed that genotype TWQ was the outstanding cultivar in IL. This information was not vividly displayed in the AMMI graph. The two statistical tools identified SWQ, TWQ, TY4 and TL2 as the most stable cultivars across all environments, suggesting that they have broad adaptation to the growing environments in West Africa. The superior performance of TW4 was not surprising because, apart from its inherent ability to tolerate drought, it also possesses genes for resistance to Striga hermonthica and the maize streak virus.
Yan et al. (Reference Yan, Kang, Ma, Woods and Cornelius2007) identified three types of environments for evaluating cultivars. Type 1 environments have short vectors and provide little or no information on the genotypes and, therefore, should not be used as test environments. Type 2 environments have long vectors and small angles with the AEC abscissa and are ideal for selecting superior genotypes. Type 3 environments have long vectors and large angles with the AEC abscissa and cannot be used in selecting superior genotypes, but are useful in culling unstable genotypes. Based on this classification, IL and IK represented the type 3 environment: they were highly discriminating of the genotypes, but were not representative of the environments of the test locations and therefore may not be used for selecting superior genotypes. However, they could be used in culling unstable genotypes. The GGE biplot identified ZA as the ideal environment, represented by the type 2 environments, which would be appropriate for selecting superior genotypes because of its high discriminating power and representativeness. In contrast, an ideal environment for selecting superior genotypes could not be visualized in AMMI biplot.
The mega-environments identified by the GGE biplot did not follow the agro-ecological zone pattern (Fig. 1) as the locations belonging to forest–savanna transition zone (IK and EJ), southern Guinea savanna (MO), northern Guinea savanna (ZA, SM and NY) and Sudan savanna (MA, ME, KX and BG) were grouped as a mega-environment (Fig. 2). In contrast, the grouping of locations by AMMI graph based on their mean yield and interaction followed the agro-ecology pattern with the exception of EJ (forest–savanna transition), which was grouped together with MO (southern Guinea savanna), KX (Sudan savanna), ZA and NY (northern Guinea savanna). The differences in the grouping of the locations could be attributed to the large variation of environment captured by the AMMI graph which allowed the ‘which-won-where’ pattern to be displayed more accurately for the complex datasets (Gauch et al. Reference Gauch, Piepho and Annicchiarico2008).
An important objective of the present study was to identify core-testing sites for the RUVT extra-early to facilitate the selection of high yielding and stable extra-early cultivars for seed production and marketing across countries of West Africa. Based on the representativeness and the discriminating power of the test environments, a set of core testing locations were identified by the GGE biplot analysis. These were IA, AN and BB for mega-environment 1; ZA, KX, IK and EJ for mega-environment 2 and IL for mega-environment 3. It is proposed that the research facilities at these core testing sites be upgraded for conducting regional trials. This will ensure the collection of reliable data to support the release of improved varieties and hybrids across the borders of the ECOWAS countries for production and marketing based on the seed protocol.
In conclusion, both the GGE biplot and AMMI graph provided similar results in terms of stability and performance of the cultivars and identified 2004 TZEE-W Pop STR C4 and TZEE-W Pop STR C4 as superior cultivars across environments. Cultivar 2004 TZEE-W Pop STR C4 was the most stable. However, the GGE biplot was more versatile and flexible, provided a better understanding of G×E than the AMMI graph and identified Zaria, Ilorin, Ikenne, Ejura, Kita, Babile, Ina and Angaredebou as the core testing sites of three mega-environments. The identified core test locations should facilitate exchange of high yielding and stable cultivars with high probability of being recommended for release and adoption by farmers.
Financial support of USAID and the DTMA Project for this study is gratefully acknowledged. The author is also grateful to the staff of the IITA Maize Program for technical assistance.