Introduction
Rice (Oryza sativa L.) is an important staple cereal crop that supports over half of the world’s population (Seck et al., Reference Seck, Diagne, Mohanty and Wopereis2012). China accounts for 28% of global rice production, but consumes 36% of the nitrogen (N) used for rice production worldwide, leading to low N use efficiency (NUE) and high losses of N to the groundwater (Peng et al., Reference Peng, Buresh, Huang, Zhong, Zou and Yang2010). While rice farms in much of China are typically less than 1 ha in size, rice farms in Northeast China are typically 20–30 ha, which represents large scale farming in China. Northeast China has a cool climate, but rice production in this region is vital for feeding the nation (Pan et al., Reference Pan, Li, Wu and Zhang2003; Li et al., 2011). Over-application and improper timing of N applications is a common problem in China. Because of the difficulty in predicting N fertilizer requirements, farmers often apply higher levels of N than is needed to maintain yield (Yadav et al., Reference Yadav, Dwivedi, Prasad, Tomar, Shurpali and Pandey2000; Ata-Ul-Karim et al., Reference Ata-Ul-Karim, Liu, Lu, Yuan, Zhu and Cao2016). However, this results in low N use efficiency and N loss to the groundwater (Cao et al., Reference Cao, Miao, Wang, Huang, Cheng, Khosla and Jiang2013). Precision N management is a promising strategy to solve this problem by better matching N applications with spatial N demand (Miao et al., Reference Miao, Mulla, Hernandez, Wiebers and Robert2007; Diacono et al., Reference Diacono, Rubino and Montemurro2013; Mulla, Reference Mulla2013).
The DSSAT (Decision Support System for Agrotechnology Transfer) family of crop growth models (Hoogenboom et al., Reference Hoogenboom, Jones, Porter, Wilkens, Boote, Hunt and Tsuji2010) is widely used around the world. This family of crop models has been used to study causes of spatial yield variability and to evaluate the economics of moving from uniform to variable rate management for maize, soybeans and wheat. The strategy originally developed by Paz et al. (Reference Paz, Batchelor, Colvin, Logsdon, Kaspar and Karlen1998) was to calibrate soil properties in grids or zones within a field to minimize the error between simulated and observed yield over multiple seasons. Once the crop model has been calibrated for a field following this strategy, researchers have used the calibrated model to conduct spatial yield gap analysis, evaluate the economic and environmental consequences of precision N management strategies, and estimate the value of moving from uniform to variable rate management (Link et al., Reference Link, Graeff, Batchelor and Claupein2006, Reference Link, Graeff and Batchelor2008; Thorp et al., Reference Thorp, Batchelor, Paz, Steward and Caragea2006; Miao et al., Reference Miao, Mulla, Batchelor, Paz and Robert2006; Paz et al., Reference Paz, Batchelor, Colvin, Logsdon, Kaspar and Karlen1999, Reference Paz, Batchelor and Jones2003; Batchelor et al., Reference Batchelor, Basso and Paz2002, Reference Batchelor, Paz and Jones2003).
The DSSAT models require inputs including daily weather data, soil physical properties, plant cultivar coefficients, and management practices to simulate daily canopy photosynthesis, respiration, biomass growth and partitioning, crop development and yield. The CERES-Rice model included in DSSAT was developed to evaluate the impact of management decisions and climate variability on rice production. The model has primarily been evaluated in warm climates for different crop management practices (Cheyglinted et al., Reference Cheyglinted, Ranamukhaarachchi and Singh2001; Singh et al., 2007; Vilayvong et al., Reference Vilayvong, Banterng, Patanothai and Pannangpetch2012; Yao et al., Reference Yao, Xu, Feng, Lin and Yan2005). It has also been used to evaluate rice management systems under irrigated conditions (Ahmad et al., Reference Ahmad, Ahmad, Tojo Soler, Ali, Zia-Ul-Haq and Anothai2012) and to simulate rice yield under different management practices and variable climate scenarios (Lamsal and Amgain, 2010). Currently, the CERES-Rice model has not been evaluated under cool season rice production found in areas like Northeast China. The specific objectives of this project were to: 1) calibrate the CERES-Rice model for two seasons of N rate experiments conducted in the Sanjiang Plain, China, 2) evaluate the model at the same site for two additional seasons of data, and 3) use the model to estimate the long term economic optimum N rate for this area. The results of this work will lead to the development of methodologies to use the CERES-Rice model to evaluate the economic and environmental consequences of variable rate N management for rice, and lays the foundation for coupling the CERES-Rice model with real-time sensing data to improve variable rate N management recommendations.
Material and methods
Study site description
The study site, Jiansanjiang, is located in the Sanjiang Plain, Heilongjiang province, in Northeast China. This site is an alluvial plain formed by the Songhua River, the Heilong River and the Wusuli River. The climate in Jiansanjiang is a cold temperate continental monsoon climate. The annual average temperature is 1–2°C and the average rainfall is 500–600 mm. The soil type is Albic soil. The annual sunshine is 2300–2600 hours, and the annual frost-free period ranges from 120 to 140 days (Yan et al., Reference Yan, Deng and Chen2002). During the past 50 years, the area has been reclaimed for arable land and is used primarily for paddy rice fields. Due to the small population density in this region, each farmer owns or manages approximately 20–30 ha of cultivated land, making it the leading large-scale rice farming region in China.
Field management
The N rate field experiments were carried out in 2011, 2013, 2014 and 2015 at the Jiansanjiang Experiment Station of China Agricultural University. The soil consisted of wet black clay approximately 20 cm thick. The soil has high organic matter (>4%) and is highly fertile and excellent for agricultural production (Zhou and Liu, 2005). Each experiment consisted of five N rate treatments including 0, 70, 100, 130, and 160 kg N ha–1 in 2011 and 2013 and 0, 40, 80, 120, and 160 kg N ha–1 in 2014 and 2015. The variety planted each year was Longjing 21, which is a 12 leaf variety. Experiments were replicated 3 times. N fertilizer was distributed in three applications: 40% as basal N before transplanting, 30% at the tillering stage and 30% at the stem elongation stage. All treatments utilized urea as the N source. All other field management practices including planting and harvest dates and pest management followed the local recommended practices. Weather data including daily maximum and minimum temperature, rainfall, and sunshine hours were collected from the local weather station.
Plant sampling and measurements
Rice plant biomass samples were collected at the panicle initiation, stem elongation and heading stages and grain yield was measured at maturity. The average tiller number for each plot was measured at the tillering stage. Leaf area index (LAI) was measured several times during each season using the dry weight method described by Bo et al. (Reference Bei, Wang, Chu, Chen and Li2005). Plant samples were separated into leaves, stems and panicles, which were dried in an oven at 105°C for 30 minutes to deactivate enzymes and then dried at 75°C until constant weight and biomass was weighed. Total above ground biomass was measured and total N concentration was analyzed using the Kjeldahl-N method. Nitrogen uptake was calculated from N concentration and total above ground biomass. At maturity, three 1-m2 areas were randomly selected in each plot for grain yield measurement.
Model calibration and evaluation
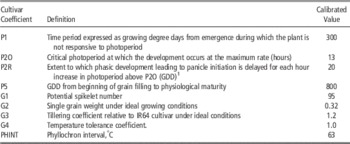
The years 2014 and 2015 were selected for model calibration. Nine cultivar coefficients (Table 1) were estimated in order to calibrate the model for the N management treatments. The CERES-Rice model calibration involved making systematic adjustments to development and growth cultivar coefficients to minimize error between simulated and measured total above ground biomass, LAI and yield. The variables P1, P2O, P2R were adjusted so that the model simulated the correct timing of above ground biomass and LAI, which were measured several times during the season. The PHINT variable was adjusted to give the best fit for peak LAI, which corresponds to a shift from the vegetative to reproductive stage. Coefficient P5 was set to match the period of time between the simulated onset of linear grain growth and measured maturity date. The coefficient G3 was set to minimize error between simulated and measured tillers. Coefficients G1 and G2 were adjusted to minimize error between simulated and measured final yield. After calibration for data collected in 2014 and 2015, the model was evaluated using data collected in 2011 and 2013.
Nine cultivar coefficients in CERES-Rice calibrated for the 2014 and 2015 seasons.

1 GDD is cumulative growing degree days for the period, °C
After calibration and validation, the model was used to estimate the long term optimum N rate for rice in this area. Weather data for 2001–2015 from the Jiansanjiang Weather Station was used to simulate the yield response to 20 different N rates ranging from 0 to 200 kg N ha–1 in increments of 10 kg N ha–1. The marginal net return (MNR) was computed for each N rate by
 $$MNR\,{\equals}\,\Delta \,Yield\,{\asterisk}\,Price\,{\minus}\,Nrate\,{\asterisk}\,Ncost$$
where ΔYield is the simulated difference in rice yield with N applied minus rice yield with 0 kg N ha–1 applied, Price is the price for rice, $0.43 kg–1, Nrate is the N application rate, kg N ha–1, and Ncost is the cost of N, $ kg–1.
Result
Model calibration and validation
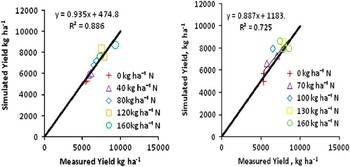
The model cultivar coefficients that gave the best fit between simulated and measured biomass and yield for the calibration years of 2014 and 2015 are shown in Table 1, while simulated and measured yields are shown in Figure 1 (left). The model gave a root mean square error (RMSE) of 400 kg ha–1 and an R2 of 0.89. The model gave good results across two years and five N rates. The cultivar coefficients calibrated for 2014 and 2015 were used to simulate the five N rate treatments for the evaluation years 2011 and 2013. The results of the validation for independent years are shown in Figure 1 (right). The RMSE was 731 kg ha–1 and the R2 was 0.73. These results are consistent with results of other evaluations of the CERES-Rice model in warmer environments (Vilayvong et al., Reference Vilayvong, Banterng, Patanothai and Pannangpetch2012), and indicate that the model was able to simulate N yield response under a cool climate very well.
Relationship between simulated and measured yield for the calibration years 2014 and 2015 (left) and the validation years 2011 and 2013 (right).

Long term optimum N rate
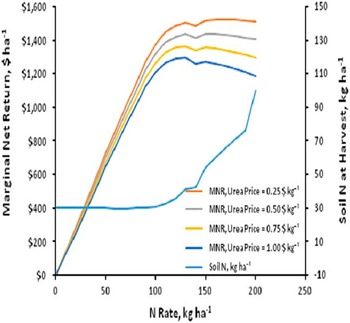
Figure 2 shows the simulated MNR averaged over 15 seasons for four different N prices assuming the value of rice is $0.43 kg–1, which is the long term average value from 2001 to 2015. The results of the simulation gave an optimum N rate across N prices of 120–130 kg N ha–1. The model gave a relatively flat MNR response for N rates above 100 kg N ha–1 for the lowest N price, but the MNR showed a clear maximum value at 120-130 kg N ha–1 for higher N prices. Recent studies indicate that the optimum N application rate in this area is 90–120 kg N ha–1 (Zhang et al., Reference Zhang, Chen and Chen2009). The model results are consistent with those observed from field data.
Simulated marginal net return for different N rates and N prices over 15 seasons (Rice price was $0.43 kg–1).

The simulated amount of N left in the soil increased substantially for N rates higher than 120-130 kg N ha–1. At high N rates and a low N price, farmers do not experience significant economic consequences for applying a higher N rate. However, Figure 2 shows that on average, when a farmer uses 200 kg N ha–1, they leave approximately 100 kg N ha–1 in the soil, which contaminates the groundwater. Currently, there are no economic consequences to the farmer other than the cost of N lost to the soil under higher N application rates. This may explain why the typical practice is to over-apply N.
Simulated annual optimum N rate
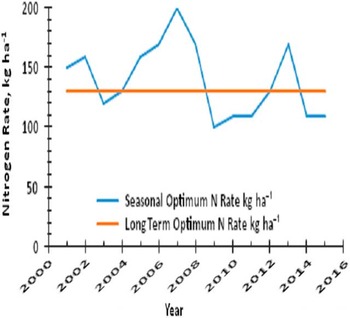
In the analysis shown above, the model was run for 20 different N rates over 15 seasons of historical weather to determine the simulated long term optimum N rate for this area. However, the model can also be used to evaluate the N rate that maximizes the MNR for each individual year. Figure 3 shows the N rate that maximizes the MNR for each year based on a rice price of $0.43 kg–1 and N price of $0.50 kg–1. The optimum N rate for each year varied from 100 kg N ha–1 in 2009 to 200 kg N ha–1 in 2007.
N rates that maximize the marginal net return for rice price of $0.43 kg–1 and N price of $0.50 kg–1.

Conclusions
The goal of this project was to evaluate the ability of the CERES-Rice crop growth model to simulate N response in a cool season climate in Northeast China. The model was calibrated using two seasons of data, and simulated yield was in good agreement with measured yield for five different N rates, giving an R2 of 0.89. The model was tested using two additional years of data with five N rate treatments and gave an R2 between simulated and measured yields of 0.73. The model was used to estimate the long term N rate and 120-130 kg N ha–1 was found to be the rate that maximized the marginal net return, which is consistent with recent data collected in the region. If N price is low, farmers applying high N rates may not experience significant profit loss, but the impact of their N management practice has significant environmental consequences. If N price is high, these farmers lose profits long term by applying N above the optimum N rate of 120-130 kg N ha–1. The CERES-Rice model performed well in simulating rice growth in this cool climate environment. This work lays the foundation to develop methods to use the CERES-Rice model for making real-time estimates of spatial seasonal optimum N rates to support precision N management in this region.