Introduction
Radiocarbon analysis of dissolved inorganic carbon (DIC) in groundwater, surface water and seawater are important for environmental research, particularly in maintaining water resource sustainability (Bretzler et al Reference Bretzler, Osenbrück, Gloaguen, Ruprecht, Kebede and Stadler2011; Cartwright et al. Reference Cartwright, Currell, Cendón and Meredith2020). ANSTO has carried out radiocarbon dating of DIC since 1993, using manually operated CO2 extraction lines based on the system at Woods Hole (McNichol et al. Reference McNichol, Jones, Hutton, Gagnon and Key1994). The manual DIC line has a capacity to handle up to 4 samples daily. Since its inception, thousands of commercial and research samples have been processed with high reliability. The results were published in several journals, including (Meredith et al. Reference Meredith, Cendón, Pigois, Hollins and Jacobsen2012). With an increasing demand and funding from the NSW government and guided by the experience of other labs (Casacuberta et al. Reference Casacuberta, Castrillejo, Wefing, Bollhalder and Wacker2020; Gao P et al. Reference Gao, Xu, Zhou, Pack, Griffin, Santos, Southon and Liu2014; Gospodinova K et al. Reference Gospodinova, McNichol, Gagnon and Shah Walter2016), we have developed an automated DIC extraction line (A-DIC). This system can process 10 samples sequentially without user intervention, significantly enhancing our analytical capacity.
Method
A-DIC is designed for the extraction of CO2 gas from up to 10 water samples automatically. During processing, A-DIC is controlled by a computer. Critical parameters are logged to monitor the process and identify any anomalies. The sample volume can be pre-set from 22 mL to 180 mL. For normal groundwater samples, a 32 mL sample is typically used, sufficient to yield over 1 mgC (milligram carbon) for graphitization. An additional 60 mL sample water is needed for the water loop cleaning pre-extraction, totalling 102 mL per cathode. In cases where the water sample has low DIC concentration, up to 240 mL (180 mL + 60 mL) may be required. Processing each sample takes approximately 40 min, meaning that a batch of 10 samples requires about 6.5 hr and consumes up to 50 L of liquid nitrogen (LN2).
Design of A-DIC
The A-DIC consists of six main sections: 1) Glove Box: Stores and selects water samples. 2) Water Loop: circulates and mixes acid with water in reaction vessel, sparge by He for CO2 extraction. 3) Gas Trapping Line: removes water vapor and SOx gases, then traps CO2 from the He gas. 4) Sample Collection/Storage Unit: transfers and stores CO2 from the CO2 trap. 5) Vacuum Manifold: Evacuates the gas line and collection unit. 6) LN2 Auto-Filling Unit: Fills LN2 into four 1-liter (1 L) Dewars. The system also uses two gases: 1) He: carries CO2 from the reaction vessel to the gas line and is also utilized for flushing the water loop including the reaction vessel. 2) Nitrogen (N2): used for filling and flushing the glove box. The water trap is specially designed to operate in an adjustable temperature range between –110 °C and –60 °C (Yang and Smith, Reference Yang and Smith2013).
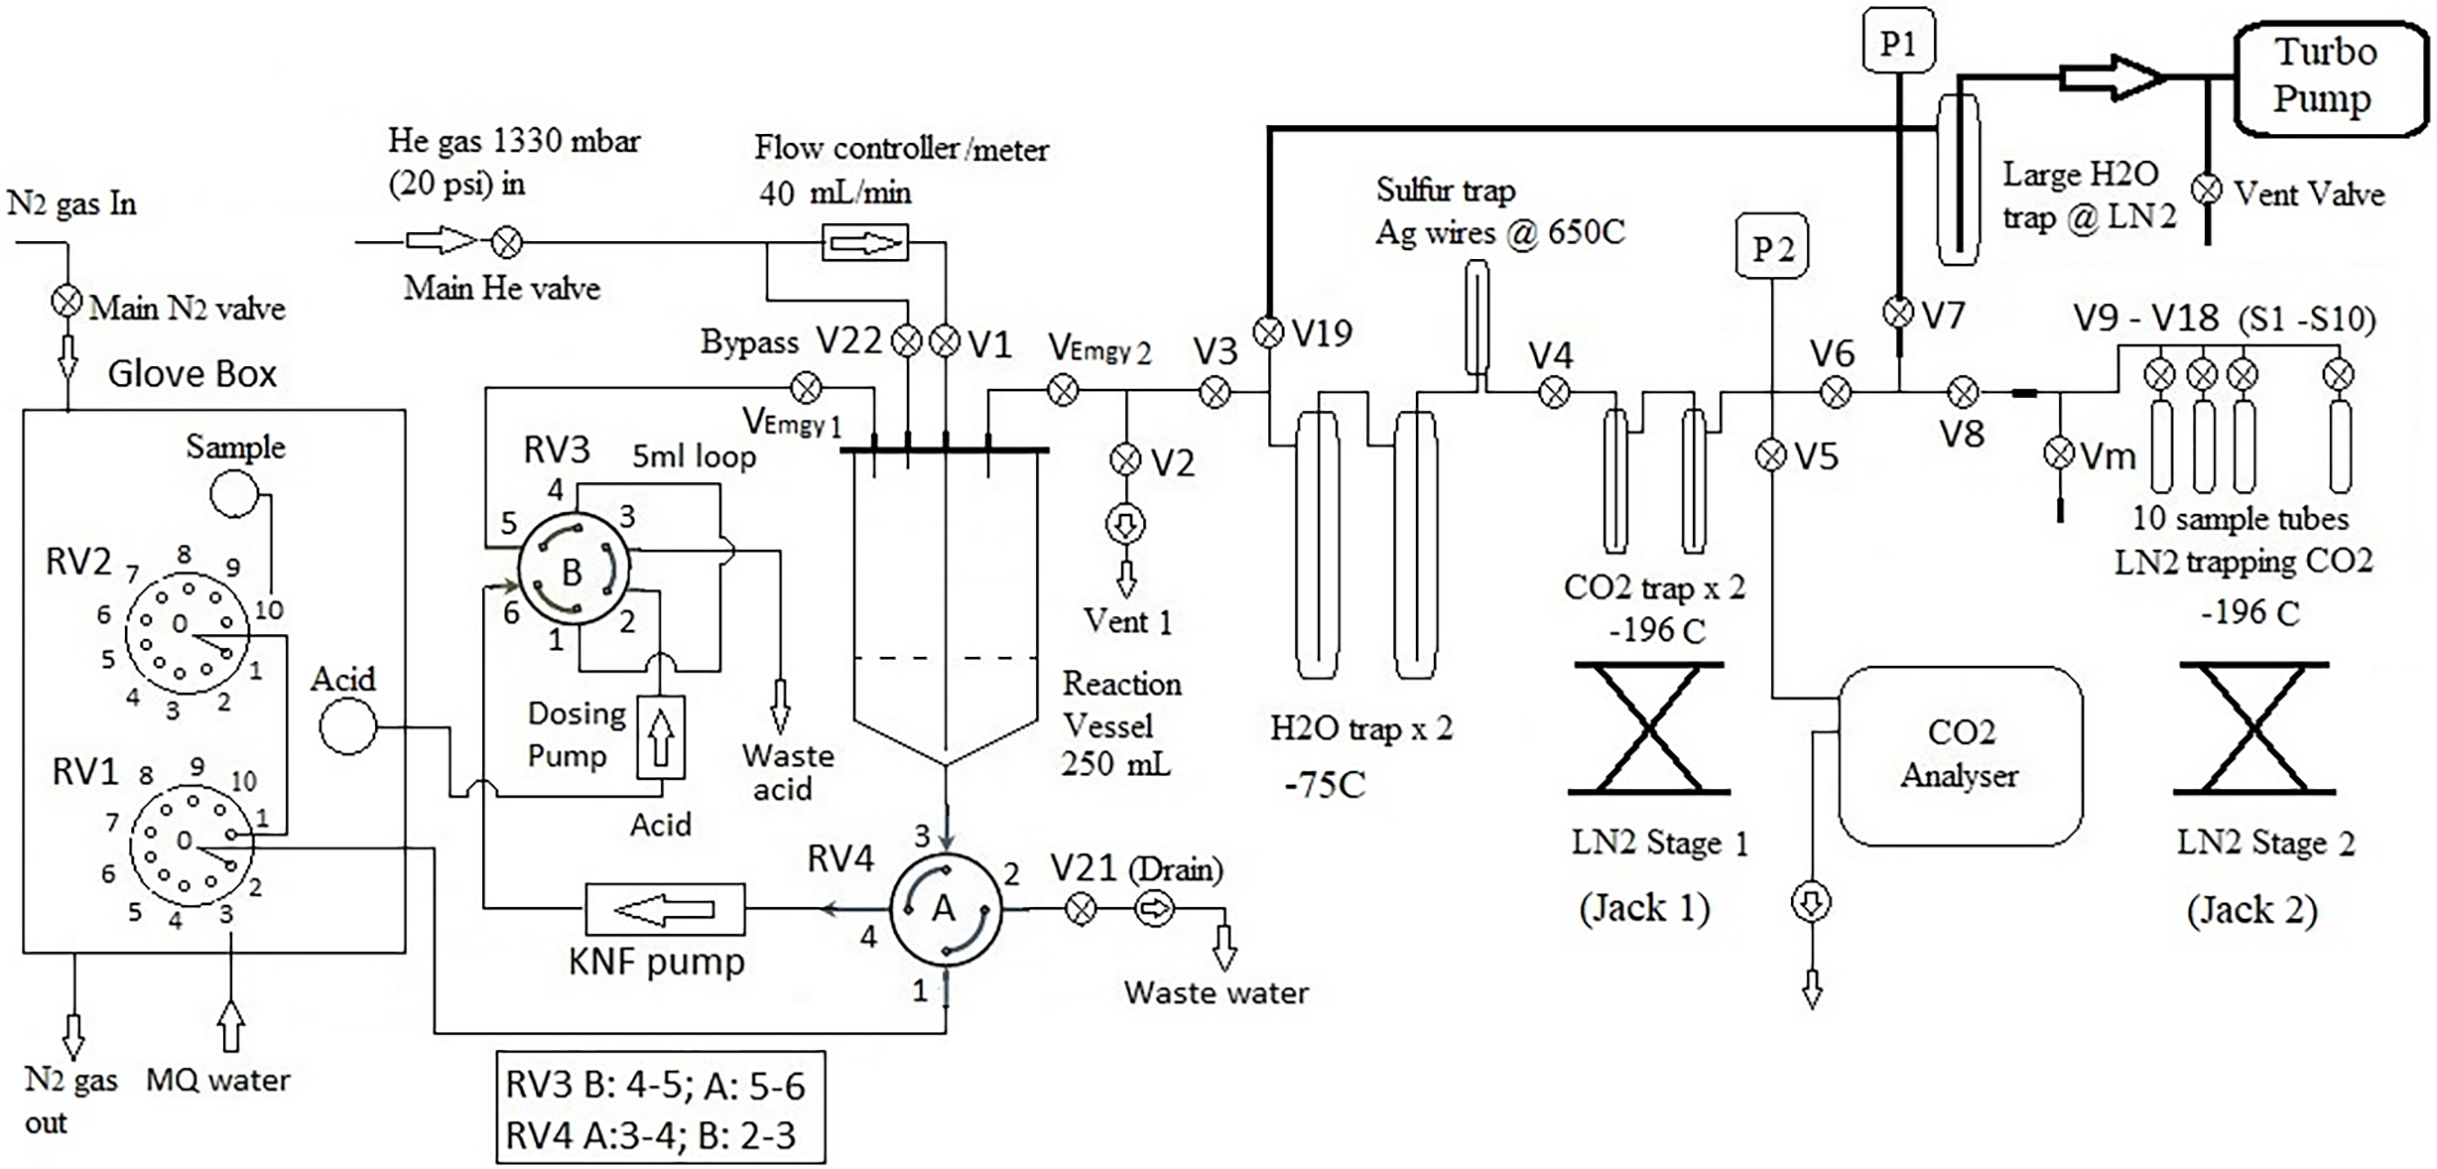
Figure 1a is a schematic diagram of the A-DIC system, featuring a total of 25 computer-controlled valves: 19 gas (Louwers Haniqu) valves (V1-V19), two solenoid valves (V21 and V22), and four rotary (Kinesis Vici) valves (RV1-RV4). Additionally, the computer manages the following components: the water (KNF) pump, the acid pump, two LN2 stages (Jack 1 & 2, up and down), and power switch of Norhof LN2 microdosing system. Data from the CA-10 Carbon Dioxide Analyzer (Sable Systems) and the pressure meter (P2) are recorded by the computer. There are also five manual valves: two emergency valves (VEmgy1 and VEmgy2) are installed on top of the reaction vessel, and Vm is used for sample transfer. The remaining two manual valves are connected to the helium and nitrogen gas sources.
Schematic of the A-DIC line, including Glove Box for water samples, DIC Extraction and CO2 collection. The process and operation are described in the text.

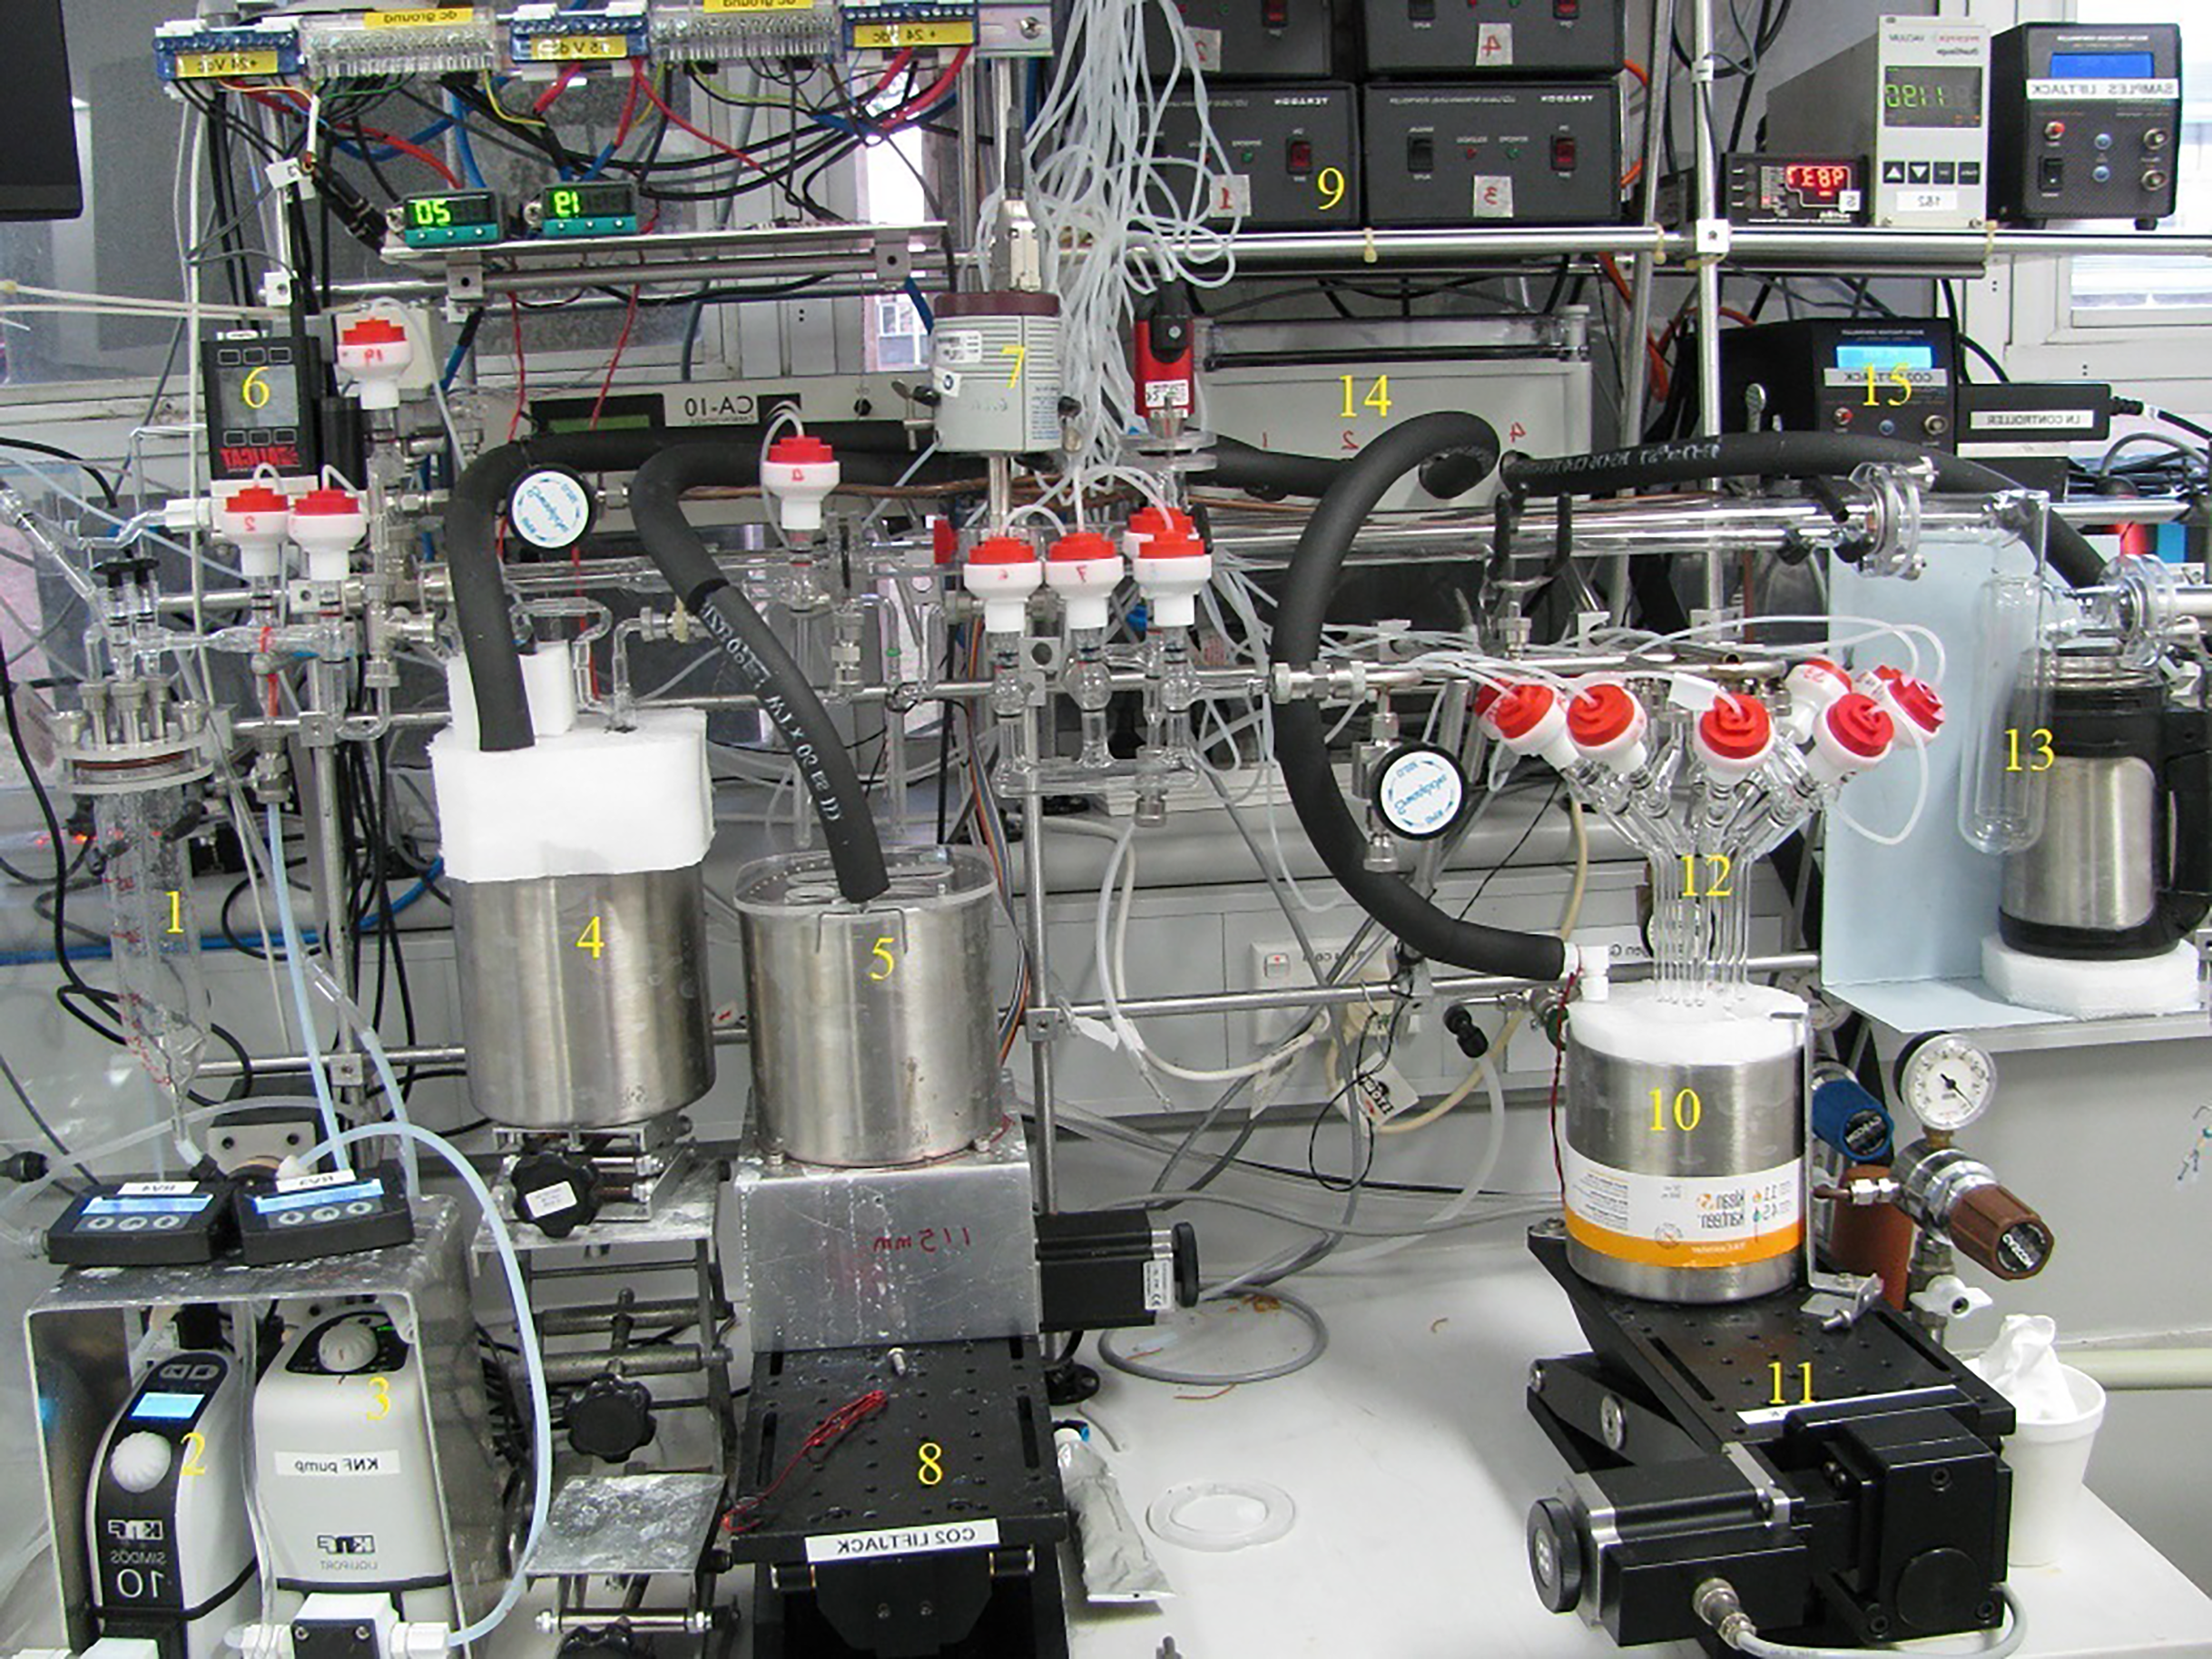
Figure 1b is a photo of the main part of the A-DIC system, highlighting the following components: 1) The reaction vessel, capped by a 40KF stainless steel flange welded with four ¼-inch Swagelok ultra-torr fittings. The bottom of the vessel is connected to a port of rotary valve (RV4) using a flangeless ¼-inch ferrule; 2) acid pump; 3) water pump; 4) LN2 Dewar for water traps; 5) Dewar for dual CO2 traps; 6) flow speed controller; 7) pressure transducer (P2); 8) Jack 1; 9) LN2 solenoid valve controllers for the microdosing system; 10) Dewar for the sample collection unit; 11) Jack 2; 12) ten sample tubes for collecting CO2 gases; 13) large water trap; 14) box containing four LN2 solenoid valves; 15) Jack controller.
Photo of the A-DIC line, including water loop, CO2 gas trapping line and sample collection unit.

Operation of A-DIC
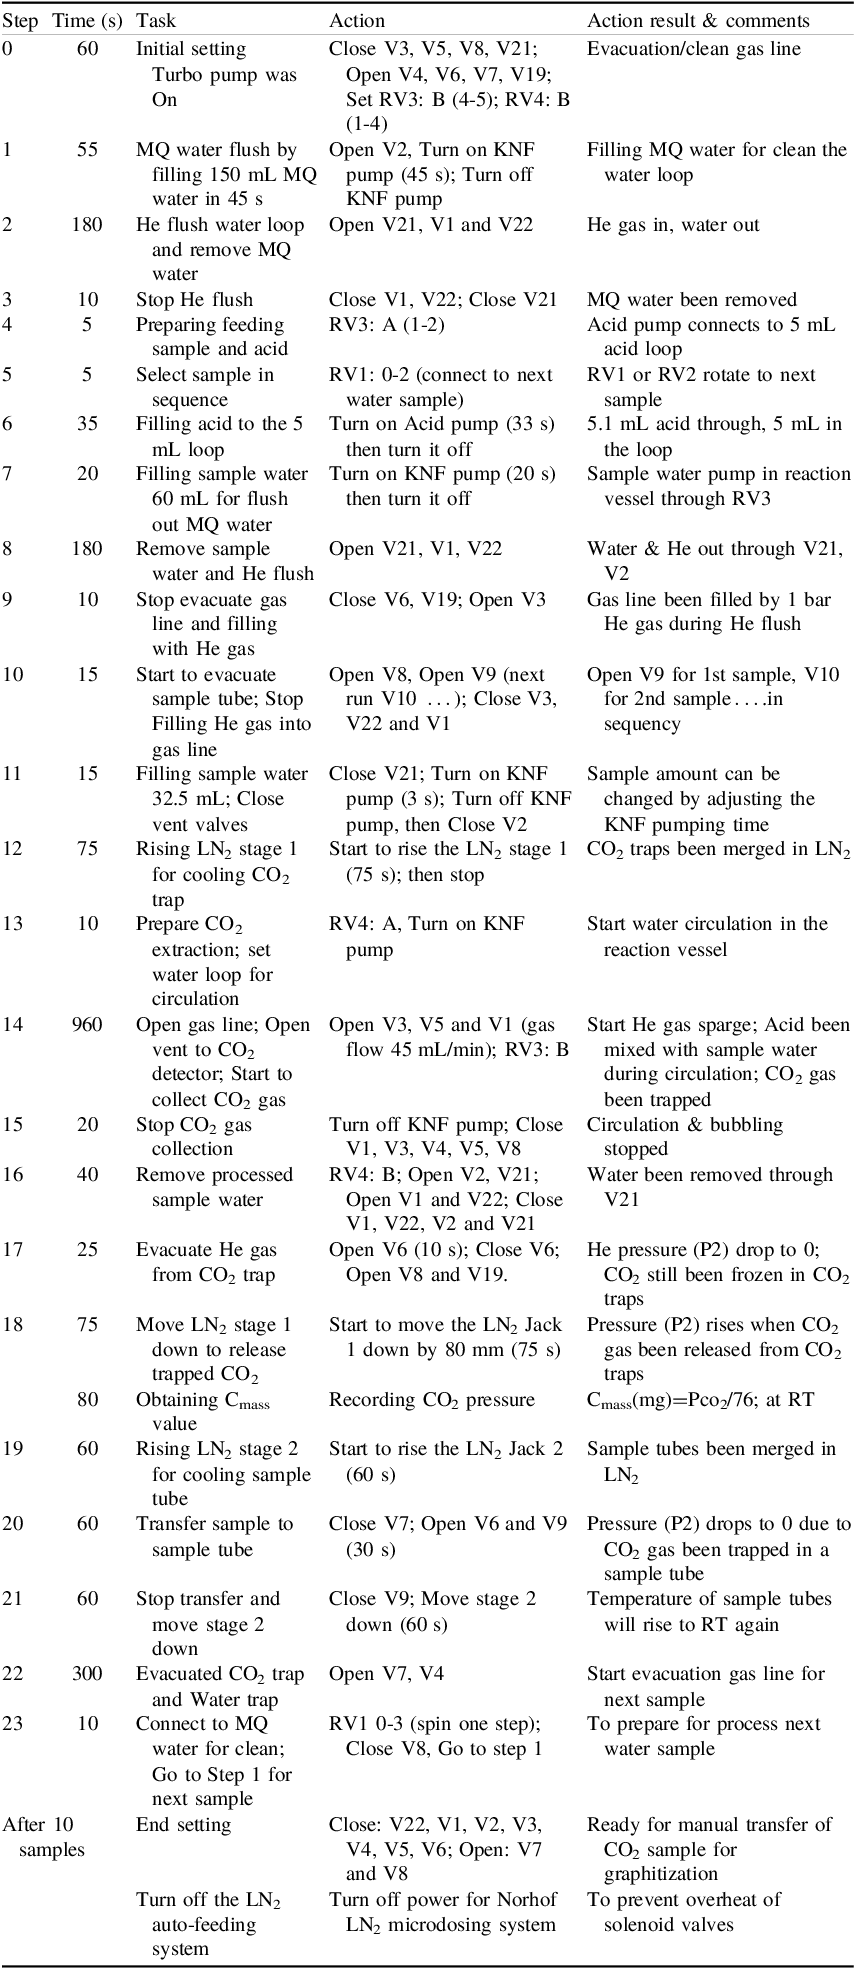
From the left, ten water samples (refer Figure 1a and b), and an acid bottle are stored under a N2 atmosphere inside the glove box during sample processing. Two rotary valves, RV1 and RV2, are used to select samples and Milli-Q™ water within the box. The water loop includes a 250 mL reaction vessel, two rotary valves (RV3 and RV4), and two liquid pumps: an acid pump and a KNF pump for circulating water through the loop and stirring during CO2 trapping. A He gas line is connected to the reaction vessel via a flow controller for CO2 sparging at a flow rate of 45 mL/min or via a bypass (when V22 is opened) for flushing the water loop. The loop is cleaned using He gas flushing and Milli-Q™/sample water washing before processing the next sample. Atop the reaction vessel, two manual valves, typically open, can be manually closed in emergencies to prevent water from being sucked into the gas line. The gas line (between V3 and V8) includes two water traps (–75 °C), a sulphur trap (650 °C) with silver wire, two CO2 traps (–196 °C), a pressure meter (P2) to monitor CO2 collection, and a CO2 analyzer to detect any escaped gas. The sample collection unit accommodates ten sample tubes for storing CO2 samples. Vm is a manual valve used to transfer samples from the tubes into other vessels for graphitization. Both the gas line and sample collection unit are cleaned using a vacuum system comprising a main glass manifold, a vacuum gauge, a large water trap (–196 °C), and a turbomolecular pump. Four 1 L Dewars are employed for water traps, CO2 traps, the sample collection unit, and the large water trap. For sample selection, RV1 and RV2 are connected such that: RV1 links ports 3, 5, 7, and 9 with Milli-Q™ water, while ports 2, 4, 6, 8, and 10 relate to 5 samples; port 1 connect to centre port (0) of RV2. RV2 port 1, 3, 5, 7, 9 connect with Milli-Q™ water; port 2, 4, 6, 8, 10 connect with the 5 other samples. Step by step sample process procedure is present in Table 1.
Stepwise procedure for sample processing

Table 1 Long description
Panel A: The table lists steps from 0 to after 10 samples, detailing tasks, actions, and results. Each step includes specific actions like opening or closing valves, flushing with different substances, and preparing samples. Panel B: The table provides detailed actions such as initial setting, MQ water flush, He flush, stopping He flush, preparing feeding sample, selecting sample, filling MQ water in the loop, filling sample water for flush, removing sample water, stopping evacuate gas line, starting to evacuate sample tube, filling sample water, rising LN2, preparing CO2 extraction, opening gas line, collecting CO2 gas, stopping CO2 collection, removing processed sample water, evacuating He gas, moving LN2, obtaining Cmass, rising LN2, transferring sample, stopping transfer, evacuating CO2 trap, connecting to MQ water, and preparing for the next sample. Panel C: The table includes action results and comments such as evacuation/clean gas line, filling MQ water, He gas in water out, MQ water been removed, acid loop connects, RV1 or RV2 rotate, acid pump, sample water in the loop, sample vessel through RV3, water and He out, gas line filled by He, sample amount can be changed, CO2 traps been merged in LN2, start water circulation, CO2 gas been trapped, circulation and bubbling stopped, water been removed, pressure drop to 0, pressure drop to 0 due to CO2, temperature of sample tubes will rise to RT, next evacuation gas line, prepare for process next water sample, ready for manual transfer of CO2 sample for graphitization, and turn off the LN2 auto-feeding system.
Result
Trapping efficiency
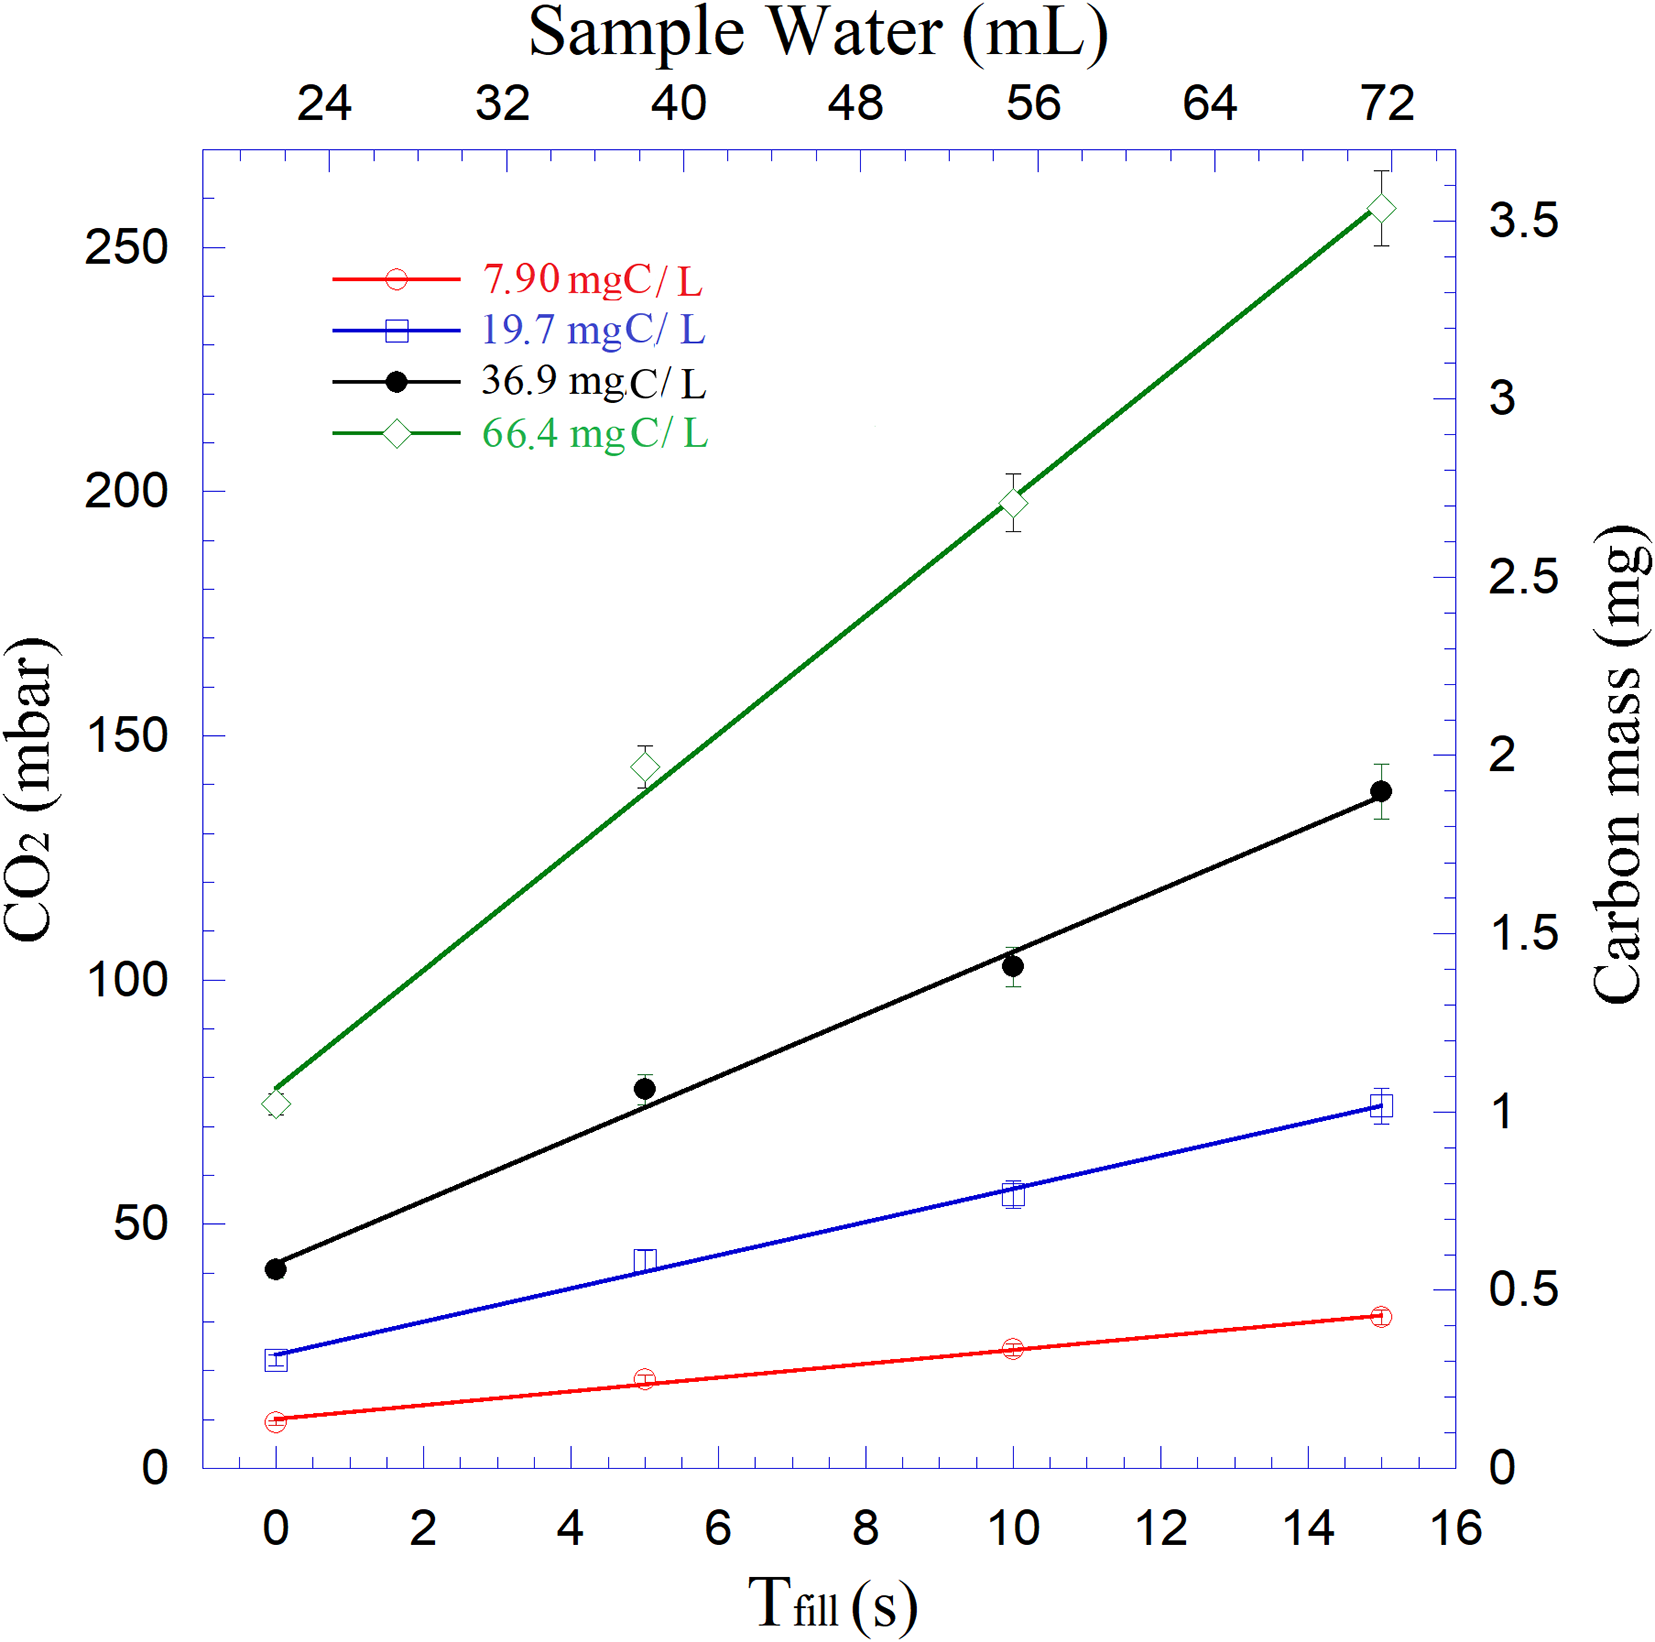
The trapping efficiency of A-DIC was evaluated by capturing CO2 from a sodium bicarbonate (NaHCO3, soda) Milli-Q™ (MQ) water solution. This solution was prepared by dissolving a specific amount of soda into MQ water prior to the efficiency evaluation. Additionally, we also attempted to extract DIC from 150 mL of MQ water, resulting in an undetectable amount of CO2. This indicated that the water had negligible DIC concentration, confirmed it suitable for this study. Given the wide range of DIC concentrations in real groundwater, from 0.5 mgC/L (mg of carbon per liter) to 200 mgC/L, four simulated water samples were prepared with DIC concentrations of 7.9 mgC/L, 19.7 mgC/L, 36.9 mg, and 66.4 mgC/L of water, respectively. The procedure was designed to minimize cross-contamination between samples by flushing the reaction vessel and water loop twice with He gas, once with 150 mL of MQ water and 60 mL of sample water respectively. Simultaneously, the gas line, including water traps, sulphur traps, CO2 traps, and the sample collection unit, are evacuated with a turbomolecular pump to remove water vapor and residual CO2, reducing the background pressure to under 10–3 mbar.
Following the cleaning procedure, the water sample is pumped into the reaction vessel for CO2 extraction. The water quantity is controlled by adjusting the pumping time (T fill ). The pumping speed, measured directly, was 3.33 mL/s. Four samples were tested with different T fill values: 0, 5, 10, and 15 seconds, respectively. Since the water loop had been pre-washed with the water sample, some water remained in the loop. A T fill of 0 indicates that no additional water was added for CO2 extraction other than the residual water. This represents the minimum amount of water (V min ) that can be processed by A-DIC. The test results for these samples, shown in Figure 2, demonstrate a strong linear relationship between pumping times and collected CO2 gas pressures and a consistent CO2 trapping efficiency across different DIC concentrations. Based on linear fitting, V min was determined to be 21.6 mL. Therefore, the equation V(mL) = 21.6 + 3.33 x T fill was used to calculate the total volume of the sample in the water loop.
Experimental data of CO2 pressure, water sample pumping time of 4 water samples with different soda concentration. We also calibrated the relation between CO2 pressure to Cmass. It is Cmass(mg)= P(mbar)/73.0.

System performance
To check for any changes in trapping efficiency during the automated process of 10 samples, we prepared 1.8 L of soda/water solutions with a DIC concentration of 36.1 mgC/L in a large bottle. Following the procedure outlined in Table 1, a total of 10 CO2 samples were collected from this solution by running A-DIC with 10 sampling pipes inserted into the large bottle. During the automated run, CO2 was trapped at –196 °C and released at room temperature. The fill time (T fill ) was 5 seconds, and the trapping time was 16 min. For the reproducibility study, this experiment was repeated with another soda/water solution containing a DIC concentration of 35.7 mgC/L.
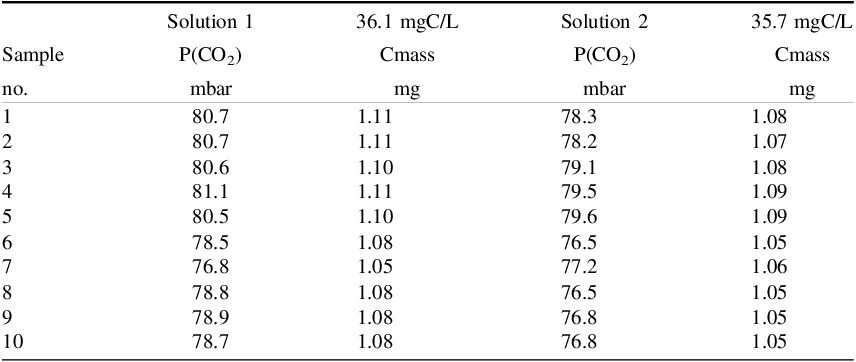
The results of the CO2 yield from these two solutions are reported in Table 2, which shows a consistent CO2 yield. However, it is noted that the partial pressure of CO2 (P(CO2)), for samples 1–5 is approximately 3% higher than for samples 6–10. This difference is attributed to varying lengths of the water pipes; longer pipes used for samples 6–10 added fluid resistance, reducing pump speed under the same pumping power. Consequently, 3% more sample water was processed in samples 1–5 than in samples 6–10. Based on the concentration, water volume, and CO2 pressure, the average CO2 trapping efficiency was calculated to be 80.1%. On the other hand, the average trapping efficiency for the manual line is 94.8%, achieved by extracting CO2 from three soda/water solutions with DIC concentrations of 37.4 mgC/L, 74.8 mgC/L, and 125.6 mgC/L, respectively.
P(CO2) is the CO2 pressure inside the CO2 traps measured by P2 when V4, V5 and V6 are closed and the traps are at room temperature

Table 2 Long description
A table comparing CO2 pressure and carbon mass in two solutions. The table has 10 rows and 7 columns. The columns are labeled as follows: Sample no., Solution 1 P(CO2) in mbar, Solution 1 Cmass in mg, Solution 2 P(CO2) in mbar, and Solution 2 Cmass in mg. The table presents data for 10 samples, showing the partial pressure of CO2 and the carbon mass for each solution. Row 1: Sample no. 1, Solution 1 P(CO2) 80.7 mbar, Solution 1 Cmass 1.11 mg, Solution 2 P(CO2) 78.3 mbar, Solution 2 Cmass 1.08 mg. Row 2: Sample no. 2, Solution 1 P(CO2) 80.7 mbar, Solution 1 Cmass 1.11 mg, Solution 2 P(CO2) 78.2 mbar, Solution 2 Cmass 1.07 mg. Row 3: Sample no. 3, Solution 1 P(CO2) 80.6 mbar, Solution 1 Cmass 1.10 mg, Solution 2 P(CO2) 79.1 mbar, Solution 2 Cmass 1.08 mg. Row 4: Sample no. 4, Solution 1 P(CO2) 81.1 mbar, Solution 1 Cmass 1.11 mg, Solution 2 P(CO2) 79.5 mbar, Solution 2 Cmass 1.09 mg. Row 5: Sample no. 5, Solution 1 P(CO2) 80.5 mbar, Solution 1 Cmass 1.10 mg, Solution 2 P(CO2) 79.6 mbar, Solution 2 Cmass 1.09 mg. Row 6: Sample no. 6, Solution 1 P(CO2) 78.5 mbar, Solution 1 Cmass 1.08 mg, Solution 2 P(CO2) 76.5 mbar, Solution 2 Cmass 1.05 mg. Row 7: Sample no. 7, Solution 1 P(CO2) 76.8 mbar, Solution 1 Cmass 1.05 mg, Solution 2 P(CO2) 77.2 mbar, Solution 2 Cmass 1.06 mg. Row 8: Sample no. 8, Solution 1 P(CO2) 78.8 mbar, Solution 1 Cmass 1.08 mg, Solution 2 P(CO2) 76.5 mbar, Solution 2 Cmass 1.05 mg. Row 9: Sample no. 9, Solution 1 P(CO2) 78.9 mbar, Solution 1 Cmass 1.08 mg, Solution 2 P(CO2) 76.8 mbar, Solution 2 Cmass 1.05 mg. Row 10: Sample no. 10, Solution 1 P(CO2) 78.7 mbar, Solution 1 Cmass 1.08 mg, Solution 2 P(CO2) 76.8 mbar, Solution 2 Cmass 1.05 mg.
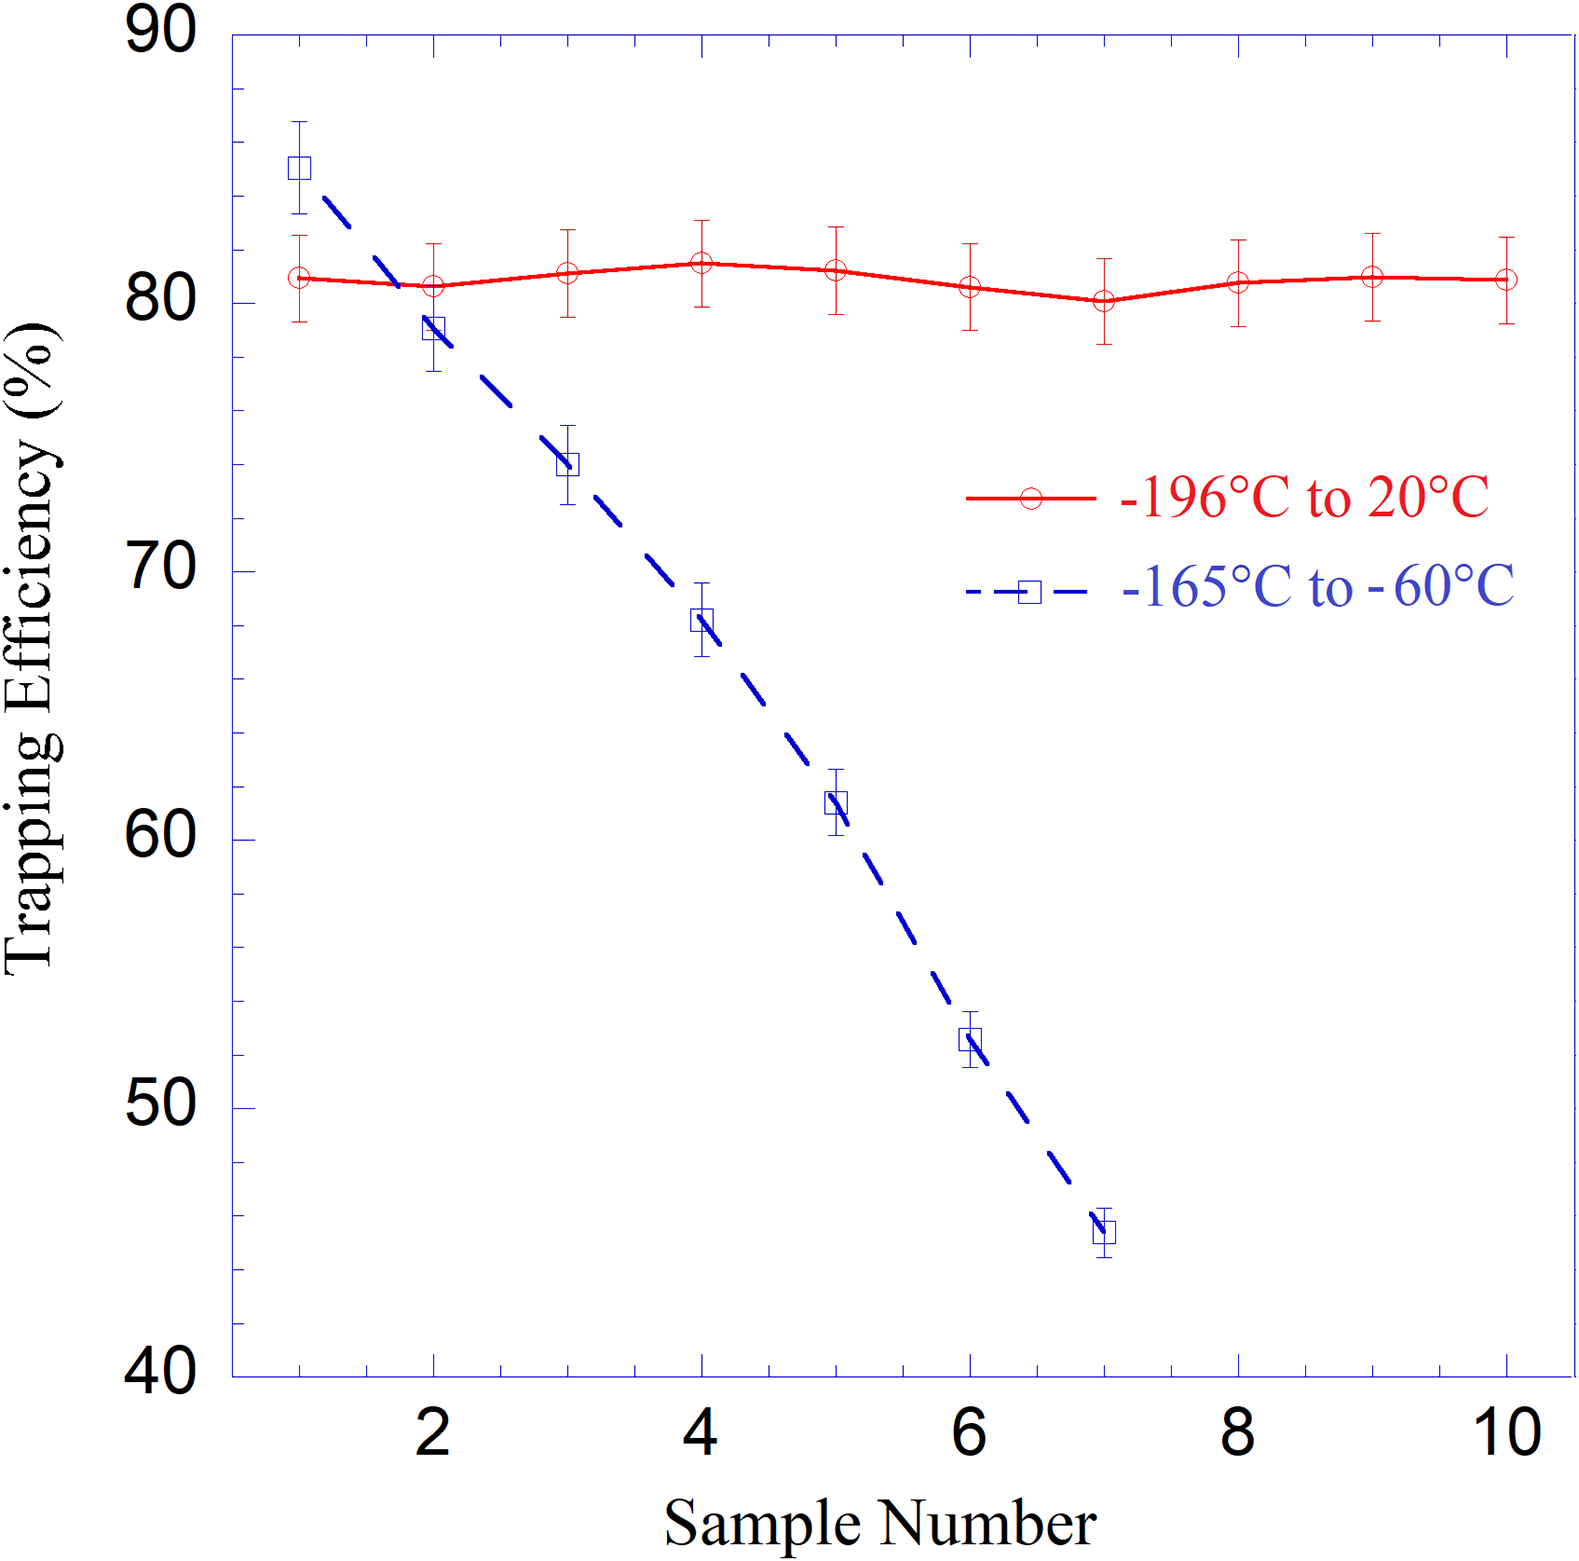
Empirical evidence suggests that a temperature of –165 °C, rather than –196 °C, is optimal for trapping CO2. Therefore, we designed a temperature controller to operate CO2 traps within a range of –175 °C to –60 °C. During automatic processing, CO2 was trapped at –165 °C and released at –60 °C. Figure 3 compares the performance of trapping CO2 at –196 °C versus –165 °C. The results indicate a rapid decline in trapping efficiency with the temperature controller, attributed to residual water vapor freezing at –60 °C. These freezing forms a thin ice layer inside the CO2 trap, which evacuation fails to remove effectively, leading to accumulation and a cumulative decrease in CO2 trapping efficiency. Hence, to ensure consistent trapping efficiency, we still utilize LN2 to freeze CO2 at –196 °C and then completely remove ice in the traps at room temperature (20 °C).
Comparison trapping of CO2 traps work in two different temperature range: trapping efficiency has a consist values (–196 °C to 20 °C); The efficiency drops rapidly (–165 °C to 60 °C).

Graphitization
For CO2 samples from A-DIC with a carbon mass (Cmass) of less than 1.2 mg, they were directly graphitized using the Micro Conventional Furnaces (MCF) (Yang and Smith, Reference Yang and Smith2017) with internal volume of 2 mL. Iron powder was used as catalyst by reducing roughly 1.4 mg high purity (99.995%) Fe2O3 powder within hot finger (6 mm OD, 57 mm L glass tube) at 630 °C, while the cold finger was maintained at –160 °C, under H2 gas (initial pressure 1100 mbar) for 30 min inside the MCF. Once the catalyst preparation was complete and residual gas been evacuated, graphitization can be started. CO2 was converted to graphitize in the presence of H2 gas (initial P H2 = 2xP CO2 +50 mbar in MCF) as the iron powder at 630 °C and the cold finger at –70 °C to remove water. The reaction lasts up to 4 hr depending on the Cmass, achieving a carbon yield >98% across all samples. If Cmass exceeded 1.2 mg, the CO2 samples were split to <1.2 mg using a two-valve gas splitter before graphitization. Water samples underwent manual line processing only once. The extracted CO2 gas was transferred to an evacuated Vycor™ tube containing Ag wire and heated to 900 ºC to remove sulphur prior to graphitization (Hua et al. Reference Hua, Jacobsen, Zoppi, Lawson, Williams and McGann2001) with carbon yield near 100%.
Radiocarbon analysis
The performance of A-DIC was assessed by comparing the percent modern carbon (pMC) values of 8 real Australian groundwater samples (labelled S1-S8) with results from the manual DIC extraction line. Radiocarbon activities for samples were obtained through AMS measurements using two accelerators at CAS: 1) ANTARES 10 MV, operated at a terminal voltage (TV) of 5.2 MV to count 14C4+ ions, can only measuring the ratio for 14C/13C (Fink et al. Reference Fink, Hotchkis, Hua, Jacobsen, Smith, Zoppi, Child, Mifsud, van der Gaast, Williams and Williams2004). 2) VEGA 1MV, with the TV set at 0.6 MV for detecting 14C1+ ions. It can record simultaneously the ratios of both 14C/13C and 13C/12C (Wilcken et al. Reference Wilcken, Hotchkis, Levchenko, Fink, Hauser and Kitchen2015).
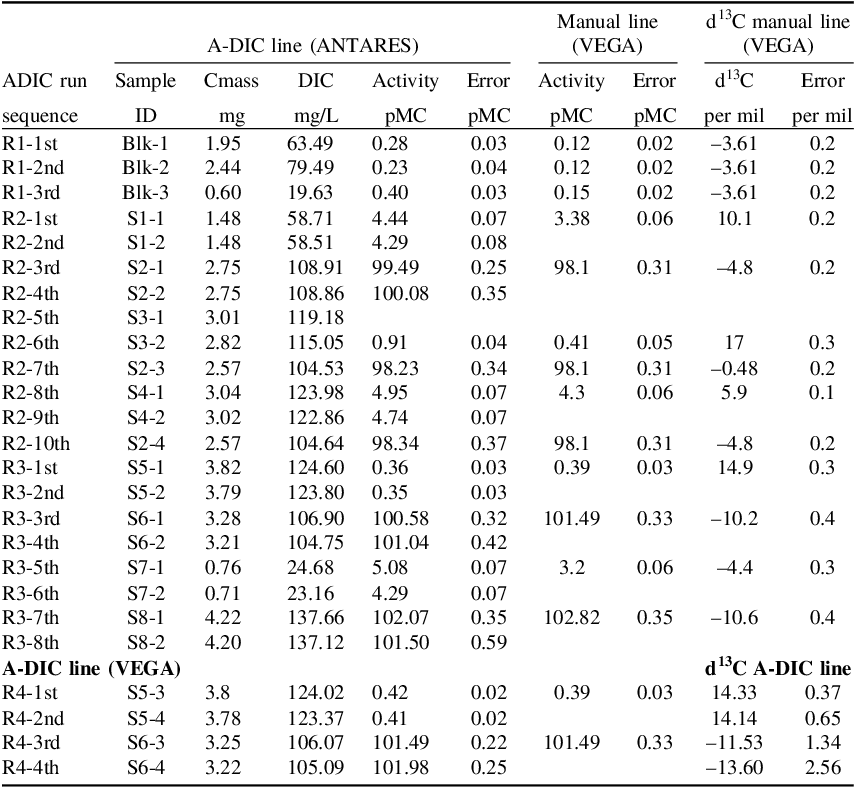
Table 3 summarizes the AMS results from four A-DIC runs, including a blank (14C-depleted) sample and real groundwater samples. In the first run (R1), we evaluated the pMC background for A-DIC using CaCO3 (IAEA C1 marble; recommended value 0.0 ± 0.2 pMC, Rozanski et al. Reference Rozanski, Stichler, Gonfiantini, Scott, Beukens, Kromer and van der Plicht1992) as a blank sample. During the experiments, we manually added a small block (up to 25 mg) of CaCO3 into the water loop through the VEmgy1 valve. The block was held in place by a fine stainless mesh inside the pipe of the water loop and was isolated from air by sealing the valve with a plug. Pure MQ water was used as the “sample water.” During the run, the water loop, including the CaCO3 block, was washed twice with MQ water before the CO2 extraction step. Acid was then mixed with MQ water and circulated in the water loop. The acidic water gradually dissolved the CaCO3 block, releasing CO2 gas inside the water loop. Finally, the CO2 was collected in CO2 traps. For a mass-dependent background calibration, we obtained three CO2 gas samples with different masses of CaCO3 blocks during an automated run.
Results from comparing the carbon extraction and radiocarbon results of the A-DIC line with the Manual DIC line

Table 3 Long description
The table presents results from comparing the carbon extraction and radiocarbon results of the A-DIC line with the Manual DIC line. It includes data from four A-DIC runs, with columns for sample ID, carbon mass, DIC concentration, activity, and error for both A-DIC and manual lines, as well as d13C values and errors for the manual line. The table has 30 rows and 13 columns. Column headers include ADIC run sequence, Sample ID, Cmass (mg), DIC (mg/L), Activity (pMC), Error (pMC) for A-DIC line, Activity (pMC), Error (pMC) for Manual line, d13C (per mil), and Error (per mil) for d13C manual line. Row labels include different sample IDs and their corresponding measurements. Notable trends include varying DIC concentrations and activities across different samples and methods. The table provides a detailed comparison of the radiocarbon results obtained from different extraction methods.
This yielded three values by ANTARES (0.23, 0.28, and 0.40 pMC), allowing us to perform a linear fit of pMC vs. 1/Cmass(mg). The linear fit yielded pMC blk = 0.199 + 0.122/C mass . This equation was used for procedural background correction in samples with pMC < 6, assuming extraneous carbon leaking in from air has a pMC value of 100. For both ANTARES and VEGA measurements, the same IAEA standards, C1 and Oxalic Acid II (OX2, pMC = 134.07 ± 0.18), were applied to minimize the differences in intercomparison pMC values between these two accelerators.
The result for S1-S8, processed by the manual DIC line, including both pMC and δ13C values, are displayed on the right side of Table 3. To test A-DIC’s reproducibility and sample memory, these samples were also processed up to four times by the A-DIC during three automated runs (R2-R4). CO2 samples from R2 and R3 were analyzed by ANTARES. The δ13C correction was based on values from VEGA. Additional four CO2 gas samples were extracted from S3 and S4 during R4 using A-DIC, and after graphitization, they were measured by VEGA for both pMC and δ13C.
The comparison of pMC values for each water sample shows good reproducibility. Modern samples have a strong agreement with pMC values obtained using the manual line. For quasi 14C-depleted (with very low pMC) samples, such as sample S1, A-DIC values tend to be slightly higher than VEGA values. When comparing R3 and R4, both pMC and δ13C values show a close match, indicating that it’s appropriate to correct the ANTARES activity result using the δ13C values produced by VEGA. The analysis also shows no significant isotopic fractionation effect in both pMC and δ13C values when comparing the two set of data.
By comparing pMC values of the following pairs of samples: S2-1 with S2-2, S6-1 with S6-2, and S7-1 with S7-2, we observe an approximate difference of 0.40 pMC, likely due to cross-contamination.
Discussion
The Norhof LN2 microdosing system automatically transfers liquid nitrogen from a 50 L Dewar into the four smaller Dewars through 4 of TERAGON, LC2 LN2 level controller with solenoid valves, sufficient for operating up to 7.5 hr. Thus, the maximum processing time for one sample is 45 min. We noticed a significant amount of LN2 consumption during the transfer to four 1 L Dewars through four pipes, especially due to four large metal solenoid LN2 valves (Gems, D2024-LN2-C303). When the valve opens, the electric current to the solenoid generates substantial heat. After 50 L of LN2 are depleted, this heat can damage the valve if the electrical power has not been switched off. Therefore, we must automatically turn off the power for the system at the end of sample process. There are two ways to preserve LN2: a) reduce the sample processing time and b) decrease the number of splitting tubes.
We also tested the use of a membrane contactor for the extraction of DIC, following the method by (Gospodinova et al. Reference Gospodinova, McNichol, Gagnon and Shah Walter2016). However, the membrane loop’s volume of 45.5 mL is too large for processing groundwater samples with high DIC concentrations. Additionally, acquiring the membrane contactor in Australia is complicated. As a result, we modified the system to operate without the membrane. This modification offers the advantage of variable sample volumes, with a minimum of 21.6 mL. However, there’s a possibility that water could inadvertently be drawn into the water trap and vacuum line.
Louwers Haniqu valves can seize up overnight due to insufficient suction force. To prevent this issue, we must manually unscrew and then screw in each of the 19 valves every morning, ensuring they are functioning properly before running the A-DIC.
To eliminate the memory effect, we experimented with several methods, such as reducing the background pressure of the gas line, increasing the helium gas flushing time, and adding up to 180 mL of MQ water to wash the water loop. However, these efforts did not significantly resolve the issue. This suggests that the cleaning steps are sufficiently effective at removing any residual water from the walls of the reaction vessel and clearing any remaining gas from the trapping gas line. The memory effect is more likely caused by residual water trapped in the dead volumes of the rotary valves. To thoroughly clean them, an additional procedure involving multiple rotations of RV3 and RV4, with MQ water circulating between them, is required. This would complicate the procedure and increase processing time. An alternative solution is to inject acid directly from the top of the reaction vessel, rather than through the rotary valves. The advantages of this change are a simplified cleaning procedure and an adjustable quantity of acid.
The lower trapping efficiency (80%) is primarily due to two factors we observed: 1) During processing, a pulse of CO2 gas is released into the gas line as soon as the acid is added to the water sampler. Residual CO2 gas can be detected by the analyzer, particularly for higher DIC water samples, indicating that the CO2 pulse is not being completely captured by the traps. 2) Longer trapping times lead to higher CO2 yields, up to 45 min. However, the duration is limited by the auto-filling of LN2 and the number of samples to be processed. Increasing the helium gas flow speed could reduce the trapping time, but a higher flow speed results in more CO2 being lost due to the decreased efficiency of the CO2 traps. For the current one-way gas line design, the optimized helium flow speed is 45 mL/min. To increase DIC yield in a shorter processing time, we can convert the “one-way” CO2 trapping line into a “gas loop.” This conversion offers two advantages: 1) the CO2 pulse to circulate through the CO2 traps multiple times for complete trapping, and 2) enabling an increased flow speed to collect more CO2 efficiently.
The following modifications can be made to enhance the performance of the A-DIC system: 1) Replace Louwers Haniqu valves with homemade valves. 2) Simplify the water loop by introducing acid from the top of the reaction vessel. 3) Utilize specially designed valves to replace the two rotary valves (RV3 and RV4). 4) Convert the “one-way” gas line into a “gas loop.” 5) Reduce the sample water selection unit by connecting 10 samples with RV1 and replacing RV2 by a 3-way valve. 6) Refine the process procedure to make it simpler and more efficient.
Conclusion
These early test result indicates that 1) A-DIC can automatically process 10 samples within 6.5 hr. 2) It consistently achieves a trapping efficiency of 80% across a wide range of DIC concentrations. 3) The AMS results show good reproducibility of pMC values obtained on the manual line. 4) Minor cross-contamination issues persist. 5) For low pMC samples, values obtained from A-DIC are slightly higher than those from manual processing. 6) Major modification could be necessary to improve the performance.
Acknowledgments
The construction of the A-DIC line was made possible by funding from the Office of the NSW Chief Scientist and Engineer (OCSE) through the Research Attraction and Acceleration Program (RAAP). We acknowledge the financial support from the Australian Government for the Centre for Accelerator Science at ANSTO through the National Collaborative Research Infrastructure Strategy (NCRIS).