Central-line–associated bloodstream infections (CLABSIs) are a leading cause of healthcare-associated infections in the United States.Reference Dudeck, Weiner and Allen-Bridson 1 – 3 Although nationwide efforts have led to a reduction of CLABSIs, there were at least 31,638 CLABSIs in 2014 among US acute-care hospitals, with an estimated annual cost of $0.6–2.7 billion and a reported mortality rate of up to 25%. 3 – Reference Scott 5 To stimulate further reductions in CLABSI rates, interinstitutional comparisons of healthcare-associated infections are increasingly being used for pay-for-performance measures.Reference Talbot, Bratzler and Carrico 6
CLABSI rates are captured by institutions for comparison and reported to the Centers for Disease Control and Prevention’s National Healthcare Safety Network (NHSN) and are now being used for pay-for-performance measures. The Centers for Medicare and Medicaid Services (CMS) have required CLABSI reporting to the NHSN from inpatient ICUs since January 2011 and from inpatient wards since January 2015. 7 Accurate measurement of CLABSI rates and appropriate risk adjustment are essential for interinstitutional comparisons to have credibility.Reference Talbot, Bratzler and Carrico 6 , Reference Niedner 8 , Reference Steinberg and Coffin 9 Although most concerns about using the NHSN data for pay for performance have focused on subjectivity in applying the CLABSI surveillance case definition to determine the numerator, a re-evaluation of the methodology used by NHSN to calculate the denominator (line days) may be warranted.Reference Sexton, Chen and Anderson 10
The current NHSN surveillance definition of CLABSI uses 1 line day as the denominator for a patient with 1 or more lines present. This definition does not account for multiple concurrent central lines or the number of lumens. The presence of multiple concurrent central lines has been shown to be an independent risk factor for CLABSI, and accounting for multiple central lines in the denominator can substantially reduce the CLABSI rate in high-acuity locations.Reference Concannon, van Wijngaarden, Stevens and Dumyati 11 – Reference Scheithauer, Hafner and Schroder 13 However, other reports have found a more modest impact on CLABSI rates by accounting for multiple lines.Reference Talbot, Johnson, Anders and Hayes 14 It is unclear whether the difference in reported impact on CLABSI rates by accounting for multiple lines reflects (1) differences in practice patterns (2) differences in patient populations including differences in acuity of patients, or (3) accuracy of the line-day determination when electronic systems are used for line counting. We have previously shown the importance for the validating line-day documentation in electronic medical records.Reference Tejedor, Garrett and Jacob 15
Using a robust, validated data set, we sought to further clarify the impact of using the actual number of central lines as the denominator to determine CLABSI rates and also calculate CLABSI rates using the number of lumens on central lines as the denominator. We also explored the types of central lines present and their relative contribution to the total number of line days. Finally, we assessed the association of multiple concurrent central lines with potential surrogates for severity of illness.
Methods
Description of our database, including validation process for the capture of central-line numbers and CLABSIs, have been previously described.Reference Tejedor, Garrett and Jacob 15 Our cohort included all patients with central lines hospitalized at 2 university-owned teaching hospitals from December 2009 to June 2011. We collected the following data for each patient: age, sex, race, dates of admission and discharge from ICU and hospital, date of death (if applicable), facility, CLABSI organism(s), neutropenia on day of CLABSI, and central-line attributes (eg, type, site, lumens, use of silver coated needleless connector, insertion and removal dates if performed during the hospitalization). We did not have access to additional patient-level data. The presence or absence of 1 or more central lines on a given day was ascertained using a previously validated process with a low error rate of <0.05 errors per central-venous catheter (CVC) day maintained throughout the study period.Reference Tejedor, Garrett and Jacob 15 All bloodstream infections were reviewed by 1 investigator (J.S.) and CLABSIs were determined using the standard surveillance definition.Reference Horan, Andrus and Dudeck 16 We excluded bloodstream infections in persons with absolute neutrophil count <500 cells/µL on the day of positive culture and microbiology included in the NHSN definition of mucosal barrier injury laboratory-confirmed bloodstream infection (MBI-LCBI). 17 , Reference See, Iwamoto, Allen-Bridson, Horan, Magill and Thompson 18
CLABSIs were attributed to either ICUs or wards per NHSN methodology. We calculated the CLABSI rates for ICUs and wards using 3 different denominators:
NHSN method: n central lines in 1 patient in 1 day = 1 line day
Multiple line method: n central lines in 1 patient in 1 day = n line days
Lumen method: n lumens among all central lines per day in 1 patient in 1 day = n lumen-days.
CLABSI rates were calculated for each method by dividing the number of CLABSIs by the total number of central-line days or lumen days as appropriate. The number of lines per day and lumens per day while a central line was present was calculated for each admission and stratified by location (ICU vs ward). These were summed to determine the contribution to the denominator for the multiple line method and lumen method. Central lines without lumen data were assumed to have 1 lumen.
We then determined the central-line types for each unique admission and determined the number of days each type was present in each location (ICU vs ward). We classified all central lines into 6 central-line types: tunneled and nontunneled single- or double-lumen peripherally inserted central catheter (PICC); nontunneled nondialysis multilumen CVC; tunneled and nontunneled dialysis/pheresis catheters (dialysis catheters); tunneled cuffed multilumen catheter (cuffed tunneled catheter); introducer catheters and pulmonary artery catheters (introducer); and implanted ports (port). The proportion contributed by each central-line type to the total central-line days using the multiple line method was determined. We then stratified line type days by occurrence during periods when multiple concurrent central lines were present and when only a single line was present to determine the difference in proportion of central-line types during those periods.
We assessed the association of patients with multiple central lines at any point during hospitalization with CLABSI and available patient level data: age, dwell time (days with at least one central line in place), whether any time was spent in an ICU, and whether or not a dialysis catheter was in place at any point during admission. We defined patients as having multiple concurrent central lines if at any point in their hospitalization at least 2 different central lines were recorded on the same day, including if 1 central line was removed but replaced the same day, regardless of insertion and removal site. To account for the latter scenario, we also performed an analysis limited to patients with at least 2 days with concurrent multiple lines. For patients having multiple hospitalizations, only the first chronological admission was utilized for these comparisons.
We summarized categorical variables as frequencies and continuous variables with means and standard deviations. For statistical comparisons, we utilized the χ2 test for dichotomized continuous variables and calculated odds ratios. SAS version 9.4 software (SAS Institute, Cary, NC) was used for all statistical analyses. This study was approved by the Emory University Institutional Review Board with waiver of informed consent.
Results
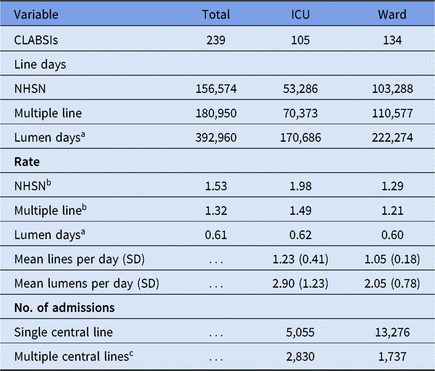
In this study, we identified 18,521 admissions among 11,807 unique patients who had central lines in place for 1 or more hospital day. In total, we included 260,544 hospital days, and a central line was in place for 156,574 NHSN line days, or at least 60% of these days. A central line was in place for 53,286 NHSN line days of 60,670 total ICU days (88% of ICU days) and in 103,288 NHSN line days of 199,874 ward days (52% of ward days). Multiple concurrent central lines for at least 1 day occurred in 2,830 of 7,885 ICU admissions (36%) and 1,737 of 15,013 ward admissions (11%) (Table 1). In total 2,910 patients had multiple concurrent central lines during their hospital stays, at least 778 of these 2,910 patients (27%) had central lines that only overlapped for 1 day. Moreover, 1,618 of the 23,774 central lines (6%) in the dataset were missing the number of lumens.
Number of CLABSIs, Central-Line Days, and CLABSI Rate Using NHSN and Modified Methods

Note. ICU, intensive care unit; NHSN, National Health Safety Network; SD, standard deviation.
a Rate per 1,000 lumen days. 6% of the central lines in the study did not have lumen data recorded.
b Rate per 1,000 line days.
c Patients had multiple concurrent central lines for at least 1 day during admission.
During the study period, 239 CLABSIs occurred: 105 in ICUs and 134 in wards. CLABSI rates in ICUs decreased by 25% when each central line was included in the denominator: 1.98 per 1,000 line days by the NHSN method versus 1.49 per 1,000 line days using the multiple-line method. Ward CLABSI rates decreased by 6% when each central line was included in the denominator: 1.29 per 1,000 line days versus 1.21 per 1,000 line days. The CLABSI rates per lumen were similar comparing ICUs to wards: 0.62 per 1,000 lumen days in ICUs and 0.60 per 1,000 lumen days in wards.
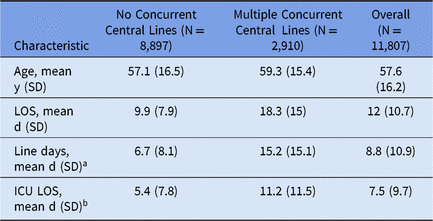
Line type was missing for 68 of 25,393 central lines (0.3%) and ICUs accounted for 354 line days (98%) where line type was missing. PICCs made up the largest proportion of central-line days (33%), followed by multilumen CVCs (28%) and dialysis catheters (16%) (Table 2). Dialysis catheters and introducers were more common during periods when multiple central lines were in place, whereas cuffed tunneled catheters and ports were more common when 1 central line was in place (Table 2). Femoral location accounted for 6% of central-line days and for 13% of central-line days in periods with multiple concurrent central lines. Insertion site was missing for 1.5% of the total 180,950 central-line days. Patients with multiple central lines had a hospital length of stay and ICU length of stay approximately twice as long as patients with only a single line (Table 3).
Percentage of Central-Line Days by Line Type and Line Location

Note. PICC, tunneled and nontunneled single or double lumen peripherally inserted central catheters; CVC, triple and quadruple lumen nontunneled nondialysis central venous catheter; dialysis, tunneled and nontunneled dialysis/pheresis catheters; cuffed, tunneled cuffed nondialysis central lines; introducer, includes sheaths, single-lumen introducer catheters, and multilumen introducer catheters.
Demographics Among 11,807 Unique Patients

Note. SD, standard deviation; ICU, intensive care unit; LOS, length of stay.
a NHSN line-day method.
b Among patients admitted to ICU, N = 6,693 overall, N = 4,245 for patients without multiple central lines, and N = 2,448 for patients with multiple central lines.
The presence of multiple concurrent central lines at any point during hospitalization was significantly associated with age >55 years, having a central line for at least 7 days, admission to ICU, CLABSI event (OR, 5.75; 95% CI, 4.11–8.06), and presence of a dialysis catheter (Table 4). When assessing patients with at least 2 days of concurrent multiple lines, the number of CLABSIs decreased from 97 to 79, and the OR decreased from 5.75 to 5.21 (95% CI, 3.76–7.20).
A Comparison of Patients With Multiple Concurrent Central Line to Patients Without Multiple Concurrent Central Lines

Note. OR, odds ratio; CI, confidence interval; ICU, intensive care unit; CLABSI, central-line–associated bloodstream infection.
Discussion
Using the actual number of central lines as the denominator decreased CLABSI rates by 25% in ICUs and 6% in wards compared to the NHSN method. The modified method for calculating CLABSI denominator using the actual number of central lines more accurately reflects intrinsic CLABSI risk, which increases proportionally with the number of lumens present in the central lines. The impact of the modified method was higher in ICUs because more patients in ICUs had multiple lines, reflecting the higher acuity of care in the ICU compared to the wards. These results suggest that interinstitutional comparison using the NHSN benchmark disadvantages hospitals specializing in high-acuity care, which that, by necessity, have more patients with concurrent lines. These findings may, in part, explain why a disproportionate number of major academic medical centers received penalties associated with hospital-acquired conditions, including CLABSIs, in 2015. 19 Although the NHSN risk adjustment methodology includes hospital size and medical school affiliation, accounting for multiple central lines may provide a more accurate measure of CLABSI risk and improve reliability for interinstitutional comparisons.
This is the first large-scale study exploring lumen days as a method to measure CLABSI rates. Our data show that the risk of CLABSI per lumen day was similar for central lines within and outside the ICU. The reasons for this observation need further exploration as the intensity of accession of lines (not measured) is likely greater in ICU settings. Given that the risk of infection increases with the number of lumens (and central lines), efforts to remove unnecessary lines should be emphasized.Reference Templeton, Schlegel and Fleisch 20 Whether there are any advantages of measuring CLABSI rates per lumen day remains unclear. In addition, given the difficulty in measuring lumen days, using this measure as a denominator may not be a practical goal.
Much of the current national emphasis on CLABSI focuses on the ICU, where the sickest patients in healthcare reside. Our data are consistent with other studies that show that most CLABSIs occur outside of ICUs (60% in our study), 3 , Reference Zingg, Sax and Inan 21 , Reference Marschall, Mermel and Fakih 22 emphasizing the need to extend CLABSI prevention efforts outside the ICU. CLABSI prevention efforts have been demonstrated to be effective in ICUs and can also be adapted to other wards.Reference Seddon, Hocking, Bryce, Hillman and McCoubrie 23 In addition, unneeded CVCs may be more prevalent outside of the ICU.Reference Tejedor, Tong and Stein 24 Given this and the relatively constant risk of CLABSI per lumen, removal of unnecessary lines may be especially important outside of the ICUs.
Using our modified denominator may provide some degree of risk adjustment for more ill patients, and removing unnecessary central lines should be emphasized. Adoption of a denominator accounting for multiple concurrent central lines should not be an unintended or subconscious rationalization to insert or maintain central lines that are no longer clinically indicated, and a balancing measure for concurrent central-line utilization should be considered. These findings should be considered in the context of other efforts to provide risk adjustment using comorbidities or other risk factors that can be extracted from the medical record and may be able to provide more accuracy.Reference Jackson, Leekha and Magder 25 Our method has the advantage of simplicity in only counting central lines, a task that is currently in either manual or electronic workflow for all facilities reporting to NHSN, without the need to extract other data fields for other methods such as comorbidities.
Our study has some limitations. First, in defining patients with multiple concurrent central lines, those who had only 1 central line, but had their central line replaced on any given day would be counted as having multiple central lines on the day of the replacement. However, our findings were not substantially different when using a minimum of 2 days as concurrent multiple lines. Second, because the initial study was not designed to demonstrate a causal relationship of multiple central lines with CLABSI, we could not determine whether a CLABSI occurred before or after a period with multiple concurrent central lines. Third, the study hospitals serve large oncology, transplant, and hemodialysis populations, which may limit the generalizability of our findings. Finally, by assuming that the 6% of central lines with a missing number of lumens had only 1 lumen, we likely underestimated the impact on CLABSI rates per lumen day because individuals in ICUs typically had 1.5 times more lumens than individuals in wards.
In summary, our findings suggest that current NHSN definitions may not sufficiently account for increased CLABSI risk at institutions that perform high-intensity care. The increasing penetration of sophisticated EMRs and entry of line data into these systems has the potential to make retrieval of the actual number of lines feasible. We believe that using the true number of central lines as the denominator would be an improvement over the current method of determining CLABSI rates and would help level the field for hospitals with patients of higher acuity who require multiple simultaneous central lines. Alternatively, these data can be viewed as highlighting another limitation of the current NHSN CLABSI measurement and add support to ongoing efforts to establish alternative metrics such as measuring hospital-onset bacteremia.
Author ORCIDs
Jesse Couk MD, MSc 0000-0002-2467-9519, Jesse T. Jacob MD, MSc 0000-0001-9811-6260
Acknowledgments
We thank Mitchel Klein, PhD, for his mentorship and advice on analytical approach. The content is solely the responsibility of the authors and does not necessarily represent the official views of the National Institutes of Health.
Financial support
JC was supported in part by the National Center for Advancing Translational Sciences of the National Institutes of Health (grant no. UL1TR000454).
Conflicts of interest
All authors report no conflicts of interest relevant to this article.