Introduction
Recently, research in the Internet of Medical Things (IoMT) is gaining attention as a resource for enhancement in medical diagnosis, treatment, and biotelemetry purposes. Nowadays, various IoMT-based devices are being developed for different applications such as noninvasive blood glucose monitoring, blood pressure measurement, heart rate monitoring, insulin pumps, tumor detection, and endoscopy. Currently, 5 G networks are being deployed in many countries. It has potential application for communicating diagnostic reports like high or low blood pressure, glucose level in blood plasma, body temperature, and heart rate. 5 G networks can also be used to implement telemedicine systems efficiently. A multiband antenna can be inserted into the patient’s body or attached over the upper body part to make a biotelemetry system along with medical devices such as biosensors, routers, micro-base stations, and a wide area network for IoMT applications. Diagnostic reports like glucose level in the blood, blood pressure, and heart rate from a radio frequency (RF) sensor imbedded in the human body or wearable on the body can be wirelessly transferred to smart health-care systems [Reference Kaur, Kaur, Toor, Dhaliwal and Pattnaik1]. IoMT-enabled devices can make health-care affordable and approachable for all. It has developed the feature of health care by giving dynamic nature in real-time approach [Reference Ahad, Tahir, Aman Sheikh, Ahmed, Mughees and Numani2]. It supports the patients to take suitable measures in case of serious illness conditions like high and low glucose concentration in blood, high and low blood pressure, brain tumor, and cardiac attack [Reference Sundaravadivel, Kougianos, Mohanty and Ganapathiraju3]. It eases remote sensing check-up facility that reduces the costs. The IoMT has an important role to transform the health-care systems and minimize the cost of medical devices such as RF sensor that provides different bands by using a single antenna. Many wearable medical devices for IoMT and 5 G networks applications in smart health-care structures are being developed, such as RF sensors for noninvasive blood glucose level monitoring, pacemaker for cardiac disease, and diagnostic of brain tumor. In near future, 5 G networks will support operation of the IoMT [Reference Liu, Jia, Zhang and Lu4]. IoMT applications in the 5 G spectrum will result in the development of a smart health-care system [Reference Li5]. The smart health-care system and its main components are depicted in Fig. 1, which is based on the 5 G network.
Schematic view of smart health-care system based on a 5 G network [Reference Ahad, Tahir, Aman Sheikh, Ahmed, Mughees and Numani2].

Advanced medical devices in smart health-care systems are based on many novel ideas of research for implantable and wearable RF sensors [Reference Amjadi, Kyung and Park6]. A wearable medical device such as an RF sensor can have noninvasive monitoring in real-time mode. It can transmit diagnostic information like blood glucose levels, high blood pressure, brain stroke, and cardiac attack to the health-care system, where medical experts are ready for the treatment of patients [Reference Khan, Ostfeld, Lochner, Pierre and Arias7]. An RF sensor is attached in or around the body part to establish a Wireless Body Area Network (WBAN) [Reference Cao, Leung, Chow and Chan8]. The advantages of RF/microwave frequency bands are being utilized in IoMT, wireless communications, satellite communications, and 5 G network applications. By using multiband antenna design, handy medical diagnostic tools like RF sensors for glucose level monitoring and heart rate monitoring devices are also developed. In tumor detectionsystems based on microwave/RF bands, a multiband antenna is used in the wide super-high frequency (SHF) band from 0.5 to 40 GHz for the low depth of access inside human tissues. Development in implantable/wearable technology has resulted in the new design of RF sensors for medical applications such as glucose monitoring [Reference Powar Sharad and Bombale9, Reference Liu, Kandwal, Cheng, Shi, Tobore and Nie10], neural recording [Reference Sharma, Kampianakis and Reynolds11], intracranial pressure monitoring [Reference Shah and Yoo12, Reference Khan, Khan, Rizwan, Sydänheimo, Björninen, Ukkonen and Rahmat-Samii13], and endoscopy [Reference Suzan Miah, Khan, Icheln, Haneda and Takizawa14, Reference Basir and Yoo15]. The key element of a health-care system is an RF sensor, which is used for communicating the RF signal in between the RF sensor and health-care systems [Reference Gao, Hu, Wang and Yang16, Reference Alemaryeen and Noghanian17]. Human tissues are lossy medium for RF/Electro Magnetic (EM) waves, and some of the RF waves are absorbed within human tissues [Reference Basir, Bouazizi, Zada, Iqbal, Ullah and Naeem18]. A novel design of the antenna is needed, which contains low backward radiations and minimum Specific Absorption Rate (SAR) value that results in less harm to the human tissues [Reference Bouazizi, Zaibi, Iqbal, Basir, Samet and Kachouri19]. Biomedical devices are wireless devices; they have a single antenna with multiple band, RF sensors, a transmitter, and a microcontroller unit, which can be attached to the patient’s body or etched on clothing [Reference Al-Sehemi, Al-Ghamdi, Dishovsky, Atanasova and Atanasov20]. It has many issues related to RF sensors design. The design of a flexible antenna with stable characteristics and specified limits of the SAR value are important issues [21–Reference Al-Sehemi, Al-Ghamdi, Dishovsky, Atanasov and Atanasova24]. Design should be compact in size, and it should be smart enough that it can operate in different spectrum using a single antenna design. Multiband designs substitute the application of conventional patch antennas for different resonant frequencies [Reference He, Gong and Gao25–Reference Wang, Zhu, Sun, Shen and Gong27]. The multiband antenna can be designed by unique geometric variation, such as slot cuts on patch and structures on ground plane are the important components in conventional microstrip patch antennas. Recently, several methods to obtain multiband antennas such as subtracting the slots on the patch [Reference Subbaraj, Kanagasabai, Alsath, Ganesan, Panneer Selvam and Kingsly28] and loading of metamaterial-based configurations [Reference Chen and Zhang29, Reference Li and Li30] on the radiating patch are being used. Defective ground structures (DGS) can also be used on the ground plane to cover the multiple bands by a single antenna design. A multiband antenna is designed that covers SHF satellite communication applications [Reference Mishra31]. A rectangle-shaped microstrip patch antenna has been developed to function at a wide range of frequencies, including those used in Intelligent Transport System (ITS) and satellite communications applications [Reference Akrou, Aghzout, Silva and Essaaidi32]. In [Reference Akrou, Aghzout, Silva and Essaaidi32], a compact antenna is designed for use of ground mobile satellite communications for vehicles. In [Reference Ahsan, Islam, Habib Ullah, Aldhaheri and Sheikh33], a square slotted patch is designed for dual-band satellite communication applications. In [Reference Sharma, Kumar Awasthi and Singh34], a monopole antenna having dual-band notch is designed, which is used in satellite communication for X/Ku-band applications. In [Reference Dalmiya and Sharma35], a fractal patch antenna is designed for SHF satellite communication. In [Reference Dawar, Raghava and Asok36], a metamaterial-based miniaturized patch antenna is designed for satellite communication, GPS, and Wireless Local Area Network (WLAN) applications. In [Reference Mishra, Singh, Kumar Singh, Singh and Singh37], a DGS-based ultra-wideband antenna is designed for WLAN applications. A slotted patch antenna that operates in the Ku-band is reported in [Reference Ahsan, Habib Ullah, Mansor, Misran and Islam38]. An oval-shaped ring patch antenna is shown in [Reference Viswanadha and Raghava39]. The antenna described in this study is efficient, has a good impedance bandwidth, and is suited for C/X/Ku/K band satellite communications. In [Reference Reddy and Sarma40], an elliptical ring patch multiband antenna is reported.
A multiband antenna that covers multiple frequency bands, such as C/X/Ku/K wireless communication, is designed in [Reference Yang and Rahmat-Samii41]. In [Reference Ziolkowski, Engheta, Engheta and Ziolkowski42], a poly fractal shape microstrip patch antenna with circularly polarized multiband is proposed. In [Reference Caloz and Itoh43], a triband antenna is proposed. It has achieved circular polarization at multiple resonant frequencies for Bluetooth, WLAN, and ITS applications. The manufactured dipole antenna in [Reference Priyadarshini and Jude44] is mounted to a dielectric substrate that possesses the same electrical properties as human tissue. It is shown that nanomaterial is an ideal material for SAR minimization. For the biotelemetry system, a compact dual-band circular patch antenna is constructed in [Reference Mohamed, Sharawi and Muqaibel45]. The designed antenna covers Industrial Scientific and Medical bands (ISM), Medical Implantable Communication System (MICS), and Med Radio for biomedical applications [Reference Mohamed, Sharawi and Muqaibel45]. For Radio Frequency Identification (RFID) biomedical applications, a small, circularly polarized implanted antenna is developed [Reference Zhang, Liu, Liu and Zhang46]. An RFID antenna for in body measurement is developed in [Reference Zhang, Liu, Liu and Zhang46]. In [Reference Mohamed, Muqaibel and Sharawi47], a small antenna loaded on a superstrate is designed for biomedical applications in the ISM band. In [Reference Mohamed, Muqaibel and Sharawi47], an antenna with a small volume of (25 × 25 × 1.92) mm3 was proposed, which is developed for biomedical telemetry applications. An extremely tiny implanted antenna for biomedical applications is reported in [Reference Zaki, Hamad, Abouelnaga and Elsadek48]. The antenna is fabricated on Roger RO3003 (ε r = 3) with an overall volume of 5 × 5 × 0.26 mm3. The designed antenna operates at a 2.45 GHz resonant frequency with 460 MHz impedance bandwidth and a gain of −22.6 dB observed in human body. The ISM band is used by a circularly polarized implanted patch antenna for biomedical applications [Reference Pal, Mishra and Tripathi49]. The proposed antenna has a compact dimension of 10 mm × 10 mm × 0.5 mm. A novel compact-size implantable circular antenna is proposed in [Reference Ding, Koulouridis and Pichon50]. It provides wireless information and energy transmission at the ISM and Medical Device Radio-communication bands.
The multiband antenna operates in multiple bands, which can be used for IoMT and 5 G applications. In this paper, the discussion about a multiband antenna for IoMT and 5 G networks is divided into five sections. The first section describes the introduction of a literature survey on multiband antenna for biomedical applications. The second section states the methodology of electromagnetic band gap (EBG) structure design on radiating patch antenna. In the third section, antenna design parameters are discussed. In the fourth section, results are discussed. Finally, the conclusion is given in the fifth section.
Electromagnetic band gap structure design methodology
In Fig. 2, a unit cell of the EBG structure with the dimensions 3 × 3 mm2 is depicted. The periodic arrangement of EBG on the ground plane has been realized from the dispersion graph, the reflection phase, and the transmission loss parameters. The current distribution on EBG unit cell is illustrated in Fig. 3. The slit gap of the unit cell construction is the location where the maximum current density is obtained, as can be seen in this figure. This results in a ±180° reflection phase at a particular frequency range.
EBG structure of ground plane unit cell.

Current distribution on EBG unit cell.

By using a reflection phase graph, an electromagnetic property has been determined in Fig. 4. The reflection phase of 180° shows a Perfect Electric Conductor (PEC) and reflection phase of 0° implies a perfect magnetic conductor (PMC) plane.
Band gap of EBG surface with the reflection phase diagram.

In nature, the PMC does not exist. An EBG structure plane has reflection phase changes from +180° to −180° by increasing frequency [Reference Sievenpiper, Zhang, Broas, Alex¨opolous and Yablonovitch51].
The bandwidth of frequency from +90° to −90° in the reflection phase variation matches with the bandgap of the EBG ground plane unit cell. The reflection phase diagram within a particular frequency range is shown in Fig. 4. As shown in Fig. 5, a multiple band of the frequency with transmission loss S 21 of <−10 dB is typically measured as the band gap [Reference Aminian and Rahmat-Samii52, Reference Ali, Subhash and Biradar53].
Band gap of EBG surface with transmission loss graph.

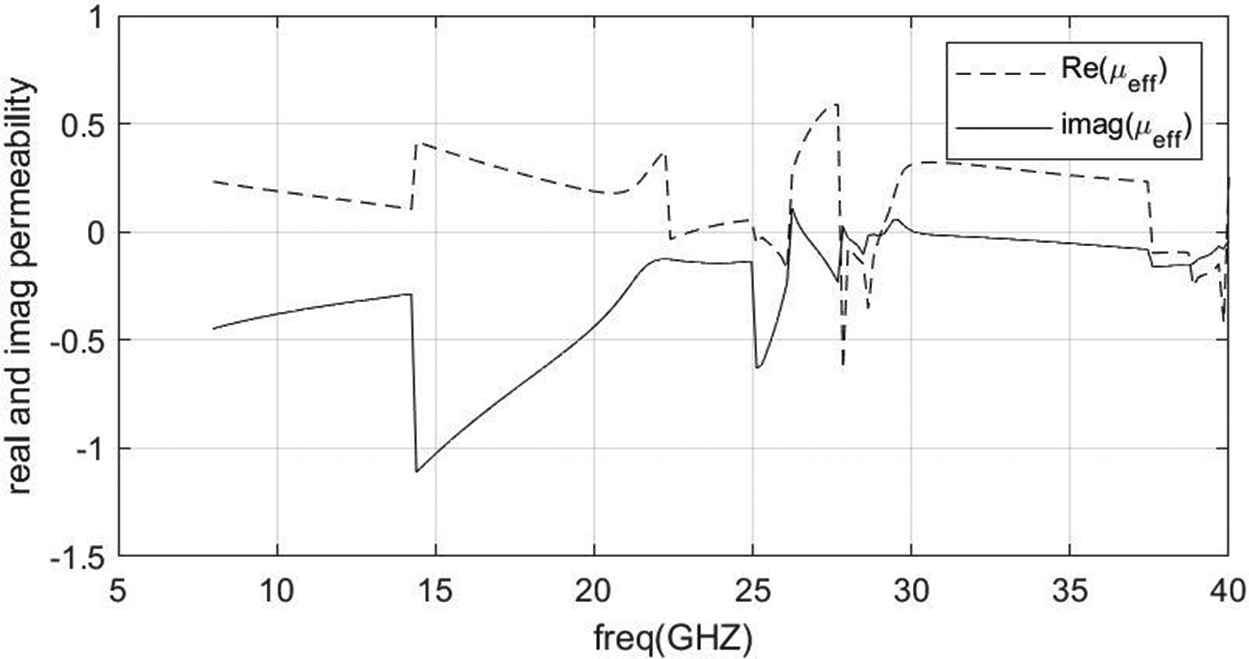
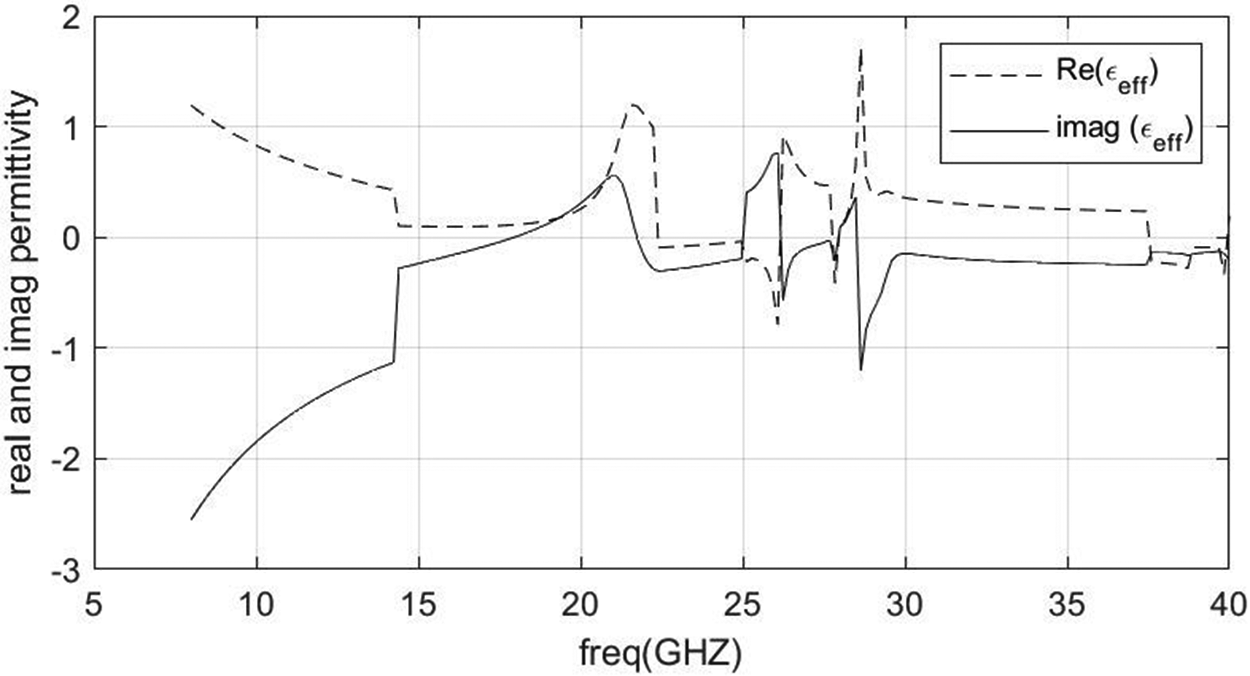
In Figs. 6 and 7, the artificial material parameters such as effective permeability and effective permittivity are shown. These graphs shows that both negative permeability and permittivity bands lie between approximately 25 and 26 GHz, 27 and 29 GHz, and 37 and 40 GHz. This result implies that these particular frequency bands of design unit cell work as an EBG structure. As a result, incident waves experience a zero degree reflection phase shift. Planner periodic structure array has been used on ground plane for surface wave reduction.
Real and Imaginary permeability of design unit cell.

Real and Imaginary permittivity of design unit cell.

According to [Reference Chen, Grzegorczyk, Wu, Pacheco and Kong54], a metamaterial with symmetrical geometry’s effective thickness (d) is measured (in the plane of EM propagation). When the measurement locations are situated close to the periodic arrangement of metamaterial, undesirable modes of higher order are produced, which results in improper effective permittivity and permeability. To get precise S-parameters, the observation nodes must be placed far enough from the metamaterial surface to achieve the dominant mode. The wave impedance and the refractive index in [Reference Chen, Grzegorczyk, Wu, Pacheco and Kong54], electromagnetic wave with normal incidence on a homogeneous surface, have the following correlations with the S-parameters:
 \begin{equation}{S_{11}} = \frac{{{R_{01}}\left( {1 - \,{e^{i2{\rm{N_{eff}}}{k_0}\,d}}} \right)}}{{\left( {1 - \,R_{01}^2{e^{i2{\rm{N_{eff}}}{k_0}\,d}}} \right)}}\end{equation}
 \begin{equation}{S_{11}} = \frac{{\left( {1 - R_{01}^2} \right)\left( {{e^{i2{\rm{N_{eff}}}{k_0}\,d}}} \right)}}{{\left( {1 - \,R_{01}^2{e^{i2{\rm{N_{eff}}}{k_0}\,d}}} \right)}}\end{equation}
 \begin{equation}{R_{01}} = {{{Z_{{\textrm{eff}}}} - 1} \over {{Z_{{\textrm{eff}}}} + 1}},\end{equation}
Effective impedance (Z eff) parameter has been calculated from the values achieved from the waveguide medium as [Reference Chen, Grzegorczyk, Wu, Pacheco and Kong54],
 \begin{equation}{Z_{{\textrm{eff}}}} = \pm \sqrt {{{\left( {1 + S_{11}^2} \right) - S_{21}^2} \over {\left( {1 - S_{11}^2} \right) - S_{21}^2}}} ,\end{equation}
 \begin{equation}{{\textrm{e}}^{i2{N_{{\textrm{eff}}}}{k_0}d}} = {{{S_{21}}} \over {1 - {S_{11}}{R_{01}}}}.\end{equation}
From this value of effective impedance (Z eff), effective permeability (μ eff), effective permittivity (ε eff), and refractive index (N eff) are calculated by following equations [Reference Chen, Grzegorczyk, Wu, Pacheco and Kong54, Reference Szabo, Park, Hedge and Li55]:
 \begin{equation}{\mu _{{\textrm{eff}}}} = {N_{{\textrm{eff}}}} \times {Z_{{\textrm{eff}}}},\end{equation}
 \begin{equation}{\varepsilon _{{\textrm{eff}}}} = {{{N_{{\textrm{eff}}}}} \over {{Z_{{\textrm{eff}}}}}},\end{equation}
 \begin{equation}{n_{{\textrm{eff}}}} = {1 \over {{k_0}.d}}\left\{ {{I_{\textrm{m}}}\left[ {\left( {\ln {{\textrm{e}}^{in{k_0}d}}} \right)} \right] + 2m\pi - {R_{\textrm{e}}}\left[ {\ln {{\textrm{e}}^{in{k_0}d}}} \right]} \right\}.\end{equation}
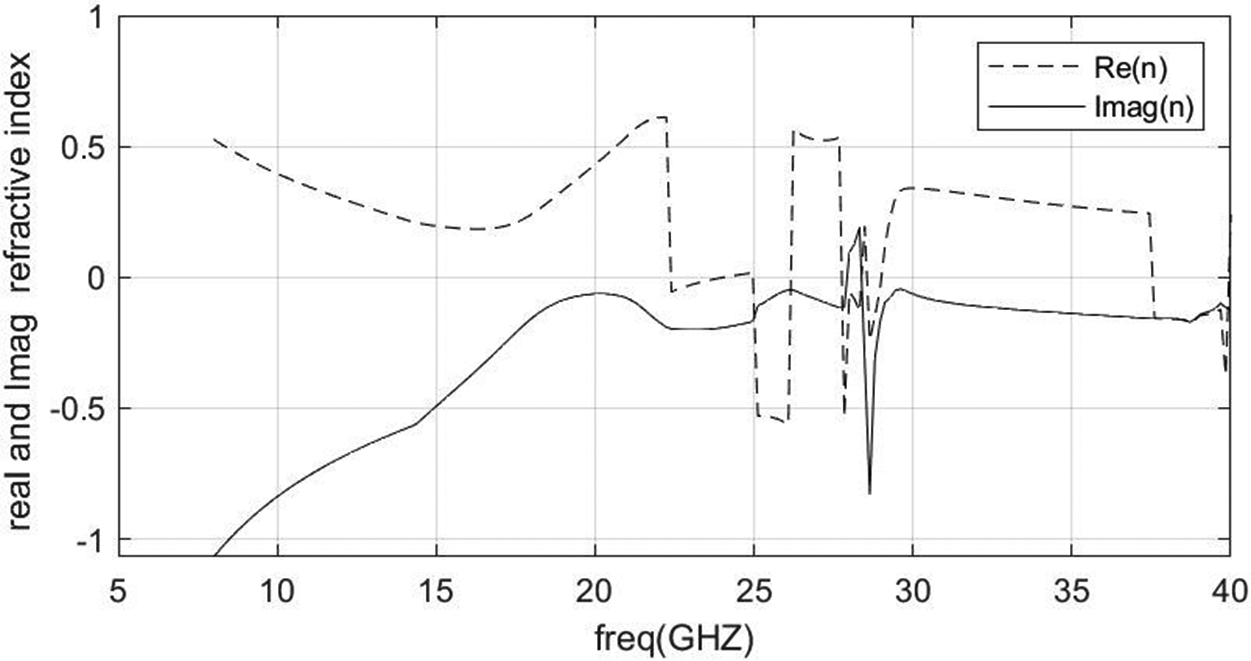
By equations (6)–(8), the complete values of μ eff, ε eff, and n eff have been calculated using MATLAB code. These values are shown in Figs. 6–8, respectively. It can be observed that the value of effective permeability, effective permittivity and refractive index are negative between bandwidth of 25 to 26 GHz, 27 to 29 GHz, and 37 to 40 GHz, respectively. At this particular frequency band, the stop band phenomena is seen for designed unit cell of EBG structure.
Real and Imaginary refractive index of design unit cell.

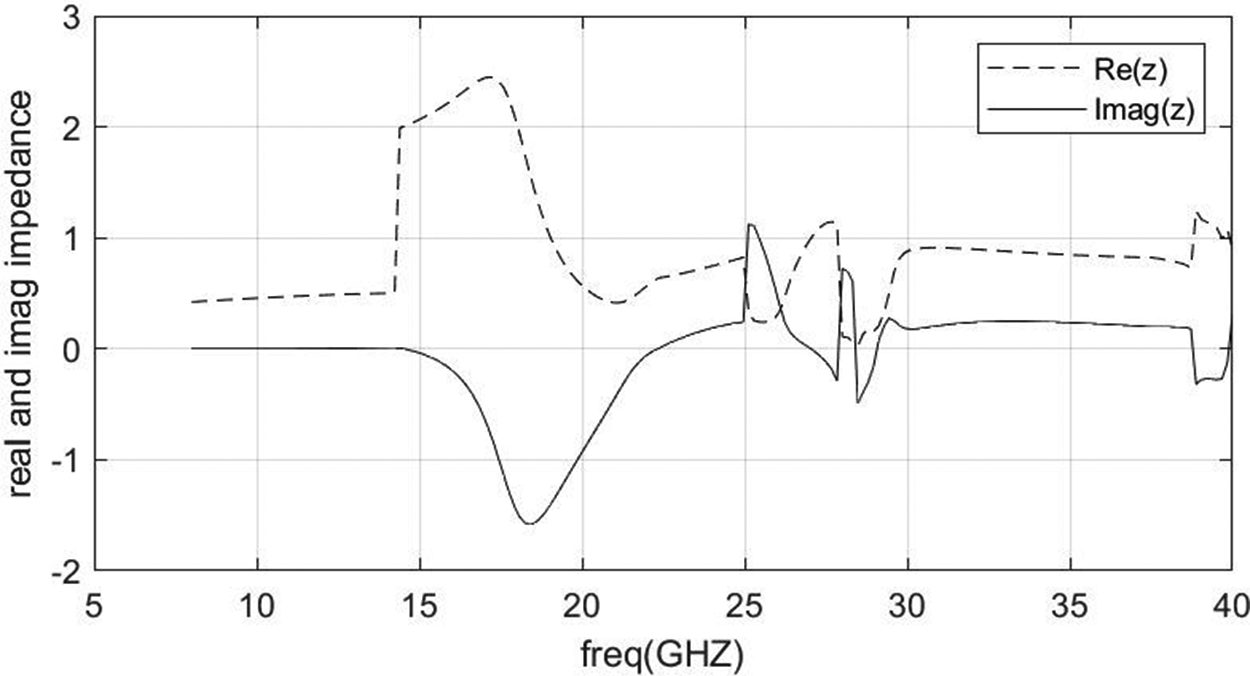
In Fig. 9, the impedance magnitude of the designed unit cell of EBG is shown. It is found to be positive throughout the frequency bandwidth, which implies that a high impedance surface has been achieved. It has high impedance surface for both TE and TM polarization, and this results in minimum surface wave propagation at particular frequency bandwidth. Moreover, the band gap property of EBG for surface wave reduction enhances the peak gain of antenna, minimizes the backward wave propagation, and decreases mutual coupling.
Real and imaginary impedance of design unit cell.

Antenna design and its specification
In this work, an EBG-based truncated patch antenna is simulated, which is illustrated in Fig. 10. The geometry of the truncated patch is designed on the RT/Duroid dielectric substrate with a dielectric constant (ε r) of 2.2, with the height of 1.57 mm, which is depicted in Fig. 10(a). The developed antenna, depicted in Fig. 10(b), has an EBG structure loaded in the ground plane to reduce surface current and improve radiation properties like impedance bandwidth, realized gain, and antenna efficiency. By using HFSS v18 simulation software, the dimensions depicted in Fig. 10 have been optimized. A conventional microstrip line with 50 ohms SMA connector is used for feeding RF power. Fig. 11 displays the lab-fabricated prototype of an antenna. The optimized volume of the fabricated antenna is 20 × 15 × 1.57 mm3. Due to truncation on the corner of a rectangular patch with slot subtract on radiating patch, a good impedance matching has been obtained with the transmission line. The slot is cut of rectangular shape on the radiating patch in a symmetrical manner, which produces capacitive coupling with the periodic structure of EBG on the bottom of the substrate. It reduces current density on the surface of the dielectric substrate, which leads to maximum power radiation in free space.
The simulated geometry of the proposed EBG-based truncated patch antenna: (a) top view and (b) bottom view.

The fabricated design of the proposed EBG-based truncated patch antenna: (a) top view and (b) bottom view.

The gaps between EBG unit cells usually have a very high aspect ratio, and as a result, it introduces a high coupling effect in a capacitor that miniaturized the physical size of the antenna, which is illustrated in Fig. 12. The use of planner periodic EBG structure loading on the ground has led to the propagation of TM0 in planner structure. Due to TM0 propagation, the surface current in the substrate is reduced [Reference Hosseini, Klymyshyn, Wells and Liul56].
Planner periodic EBG structure.

4. Results and discussion
HFSS v18 is used for the simulation of an optimized antenna. First, the patch antenna without loading of EBG structure is simulated in the HFSS tool. The simulated graph of reflection coefficient S 11 (dB) with and without loading of periodic EBG ground structure is shown in Fig. 13. The graph shows that due to the stacking of the periodic structure of EBG on the ground plane, two more bands are available for communication, and impedance matching is improved compared to without loading EBG structure. A good agreement is achieved in the simulated and measured graph of S 11 (dB), which is shown in Fig. 14. Truncated patch antenna with the loading of EBG ground plane are resonating at five different resonant frequencies of 10.4 GHz (BW: 8.5 to 11.66 GHz), 15.68 GHz (BW: 14.5 to 16.9 GHz), 19.68 GHz (BW: 18.9 to 20.3 GHz), 27.2 GHz (BW: 24.2 to 27.84 GHz), and 35.04 GHz (BW: 33.84 to 36.2 GHz), which covers X/Ku/K/Ka/mm-wave bands, respectively. A good impedance matching is obtained with the feed line due to the truncated corner and slot cut on the patch that produces multiple resonant frequencies.
Simulated reflection coefficient S 11 (dB) versus frequency with and without EBG.

Simulated and measured graph of S 11 (dB) with EBG.

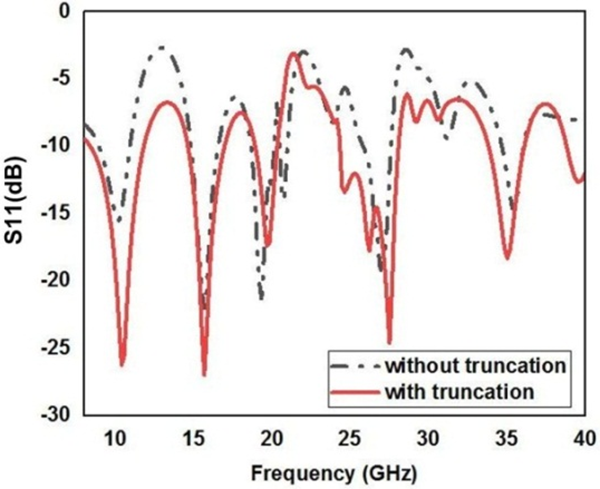
The simulated result of radiating patch with and without truncation on the corner of rectangular patch is shown in Fig. 15. It shows that due to truncation on the corner of the rectangular patch, the impedance matching has improved and bandwidth has also been enhanced.
S 11 graph with and without truncation on the corner of a rectangular patch.

Due to the loading of the periodic structure with a 3 × 4 EBG array on the bottommost of the dielectric substrate, the back lobe is reduced, and a 180° phase shift occurs in the frequency band gap, enhancing the antenna performance. Figure 16 shows the surface current density on the EBG-loaded ground plane and PEC-loaded ground plane at the resonant frequency. The surface current is reduced by loading the EBG structure because of its frequency band gap. Because of the EBG structure’s high impedance and reduced surface wave propagation in the ground plane, the resonant frequency is in the band gap region. It demonstrates that the radiation from the designed antenna has enhanced in the intended direction.
Surface current density (a) with EBG and (b) with PEC.

Due to the loading of the EBG structure on the ground plane, the radiation efficiency is enhanced, which is shown in Fig. 17. It is observed that by loading of the EBG ground plane, the average radiation efficiency increases from 55% to 75%.
Radiation efficiency graph with and without loading of EBG ground plane.

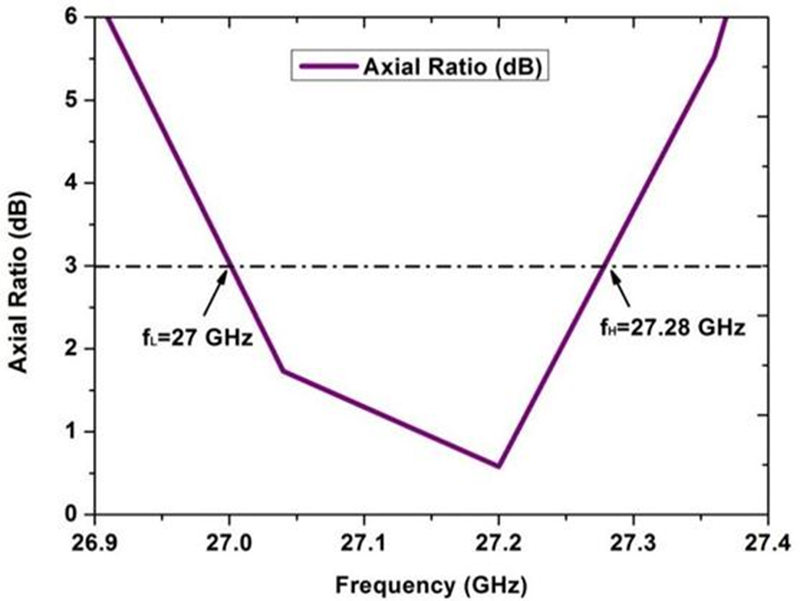
Figure 18 shows the current distribution on the radiating patch and EBG ground plane. It implies that the transmission line and edges of the rectangular slot have a maximum current density, which leads to good impedance matching in multiple bands of frequencies. On the other hand, the current distribution on EBG-loaded ground plane shows maximum current flow along the radiating patch, which leads to good impedance matching with the transmission line and reduces surface wave on the dielectric substrate. In the proposed antenna design, circular polarization is obtained at the resonant frequency of 27.2 GHz ranging from 27 to 27.28 GHz, which is illustrated in Fig. 19. The designed antenna has an axial ratio of <3 dB, which shows the circular polarization. A circularly polarized antenna radiates EM waves in every dimension, which is required for receiving data at the receiver point. The realized peak gain of the fabricated antenna concerning frequency is illustrated in Fig. 20. In Fig. 20, the antenna shows a maximum peak gain of 4, −4, 6, 8.5, and 2.5 dBi at 10.4, 15.68, 19.68, 27.2, and 35.04 GHz resonant frequencies, respectively.
Surface current distribution (a) on radiating patch and (b) on EBG ground plane.

Simulated result of axial ratio at 27.2 GHz.

Simulated and measured gain of proposed antenna at multiple resonant frequencies.

Figure 21(a) and (b) shows that by loading EBG on the ground plane, the gain of the antenna has improved from 2 to 8.5 dB at 27.2 GHz resonant frequency and the axial ratio also improved, which achieves the circular polarization from 27 to 27.28 GHz frequency band.
(a) Gain of antenna with and without EBG and (b) axial ratio of antenna with and without EBG.

In Fig. 22, radiation pattern at multiple resonant frequencies are shown. The magnitude of electric field intensity on radiating patch in the field plot implies that the proposed antenna is working at multiple resonant frequencies. It shows that the truncated point in the rectangular patch has maximum radiation intensity. The radiation pattern shows that the proposed antenna is a directional antenna that can be used for point-to-point wireless communication including long-range connectivity applications between two devices.
Simulated and measured radiation pattern at (a) 10.4 GHz, (b) 15.68 GHz, (c) 19.68 GHz, (d) 27.2 GHz, and (e) 35.04 GHz.

Polarization is the orientation of the electric field. Co-polarization is the desired polarization, and orthogonal to polarization is cross-polarization, which is undesired. The electric field of co-polarization defines the signal strength, and cross-polarization defines the undesired noise signal. Co- and cross-polarization in the E-plane and H-plane are shown in Fig. 23. It has been observed that approximately symmetric with some directionality, E-H field with low co-polarization magnitude has been realized in H-plane. It shows the radiation pattern in pass bands between multiband frequencies. The motive of the field pattern is to determine that the proposed design essentially covers a multi bandwidth. The electric field pattern is almost same as the pattern of the dipole antenna. The cross-polarization increases at a certain magnitude with higher frequencies due to a wide area of radiation. The cross-polarization is less than −10 dB in H-plane, which is desired for radiation purposes in wireless communication for biotelemetry applications.
Simulated and measured co-cross-polarization in E- and H-planes (dB) at (a) and (b) 10.4 GHz, (c) and (d) 15.68 GHz, (e) and (f) 19.68 GHz, (g) and (h) 27.2 GHz, and (i) and (j) 35.04 GHz.

The proposed antenna can be used as an RF sensor device for monitoring blood glucose levels non-invasively. Fig. 24 shows that by loading the thumb as a superstrate on top of the radiating patch, there is a remarkable frequency shift. This shift is measurable, and using a single-pole cole-cole model, the shift in resonant frequency can be used for calibrating glucose levels directly.
Measurement setup for glucose level monitoring by loading of thumb on radiating patch.

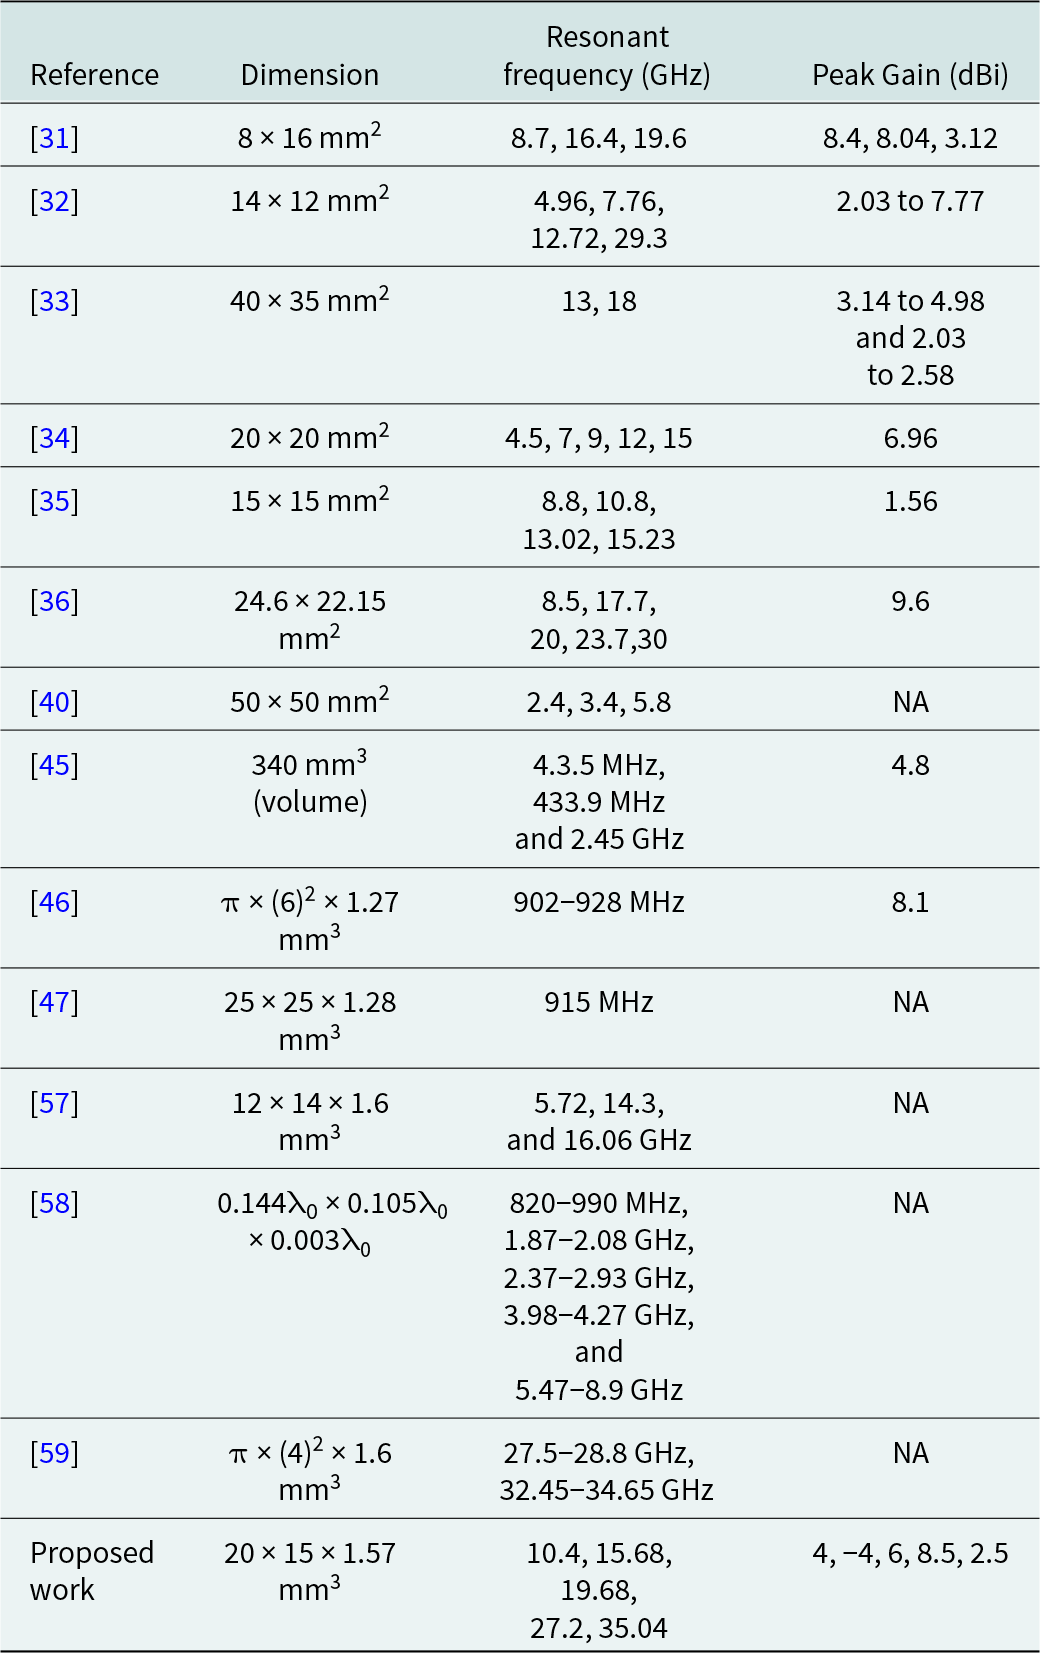
Finally, the proposed work is compared with other reference work as shown in Table 1. This shows that the proposed work gives better results than reference papers.
Comparison of the parameter of proposed design with other referenced paper

Conclusion
In this paper, an EBG ground structure-based truncated patch antenna has been proposed. It has a compact volume of 20 × 15 × 1.57 mm3. The proposed multiband antenna has a good gain over a wide frequency range. The designed antenna has average radiation efficiency of 75% throughout the wide frequency range. In the proposed antenna design, the current density on the surface is minimized due to the loading of electromagnetic bandgap at the bottom of the dielectric substrate. It results in maximum RF/EM radiation in free space. The designed truncated antenna has a peak gain of 8.5 dBi at 27.2 GHz resonant frequency. It covers 24.2 to 27.84 GHz bandwidth, which is allocated to 5 G networks. By loading the electromagnetic bandgap structure, the fundamental parameters of the microstrip patch antenna such as impedance matching, bandwidth, and radiation efficiency have been enhanced. The proposed design has a novel structure having multiple bands at 10.4 GHz for X-band, 15.68 GHz for Ku-band, 19.68 GHz for K-band, 27.2 GHz for Ka-band, and 35.04 GHz for the mm-Wave band. The designed multiband antenna can be used for telemetry applications in IoMT and 5 G networks, as well as disease detection and diagnostics in order to improve the health-care system.
Financial support
This research received no specific grant from any funding agency, commercial, or not-for-profit sectors.
Competing interests
The authors report no conflict of interest.

Saurabh Raj has received his B.Tech degree in Electronics & Communication Engineering from Galgotias College of Engineering and Technology, Greater Noida, Uttar Pradesh, Technical University Lucknow in 2012. He has completed his degree (M.Tech) from BBDNIIT, Lucknow, in 2015. He has completed his Ph.D. from Electronics & Communication Engineering Department from Motilal Nehru National Institute of Technology Allahabad in 2022. His research interests include antenna design for biomedical applications and wireless communication.

Piyush Kumar Mishra has received his B.Tech degree in Electronics and Communication Engineering from Uttar Pradesh Technical University, Lucknow, India, in 2014. He has completed his Master degree (M.Tech) in Electronics Engineering from University of Allahabad, India, in 2019. Currently, he is a research scholar in the Electronics and Communication Engineering Department at Motilal Nehru National Institute of Technology Allahabad, Uttar Pradesh, India. His research interests include antenna design for biomedical applications.

Vijay Shanker Tripathi was born in Gorakhpur (Uttar Pradesh) in 1965. He has completed his Ph.D. from Electronics & Communication Engineering Department from Motilal Nehru National Institute of Technology Allahabad in 2007, M.E. in Digital Systems from Motilal Nehru National Institute of Technology Allahabad in 1999, and B.Tech in Electronics and Telecommunication Engineering from the University of Allahabad in 1988. He is currently the Professor in the Department of Electronics and Communication Engineering, Motilal Nehru National Institute of Technology Allahabad, Prayagraj, and Uttar Pradesh, India. He has authored or co-authored over 60 research papers in international/national journals/conference proceedings. His research interests include RF Circuits and Systems, Antenna, SDR, and Non-Invasive RF Sensors.