I. INTRODUCTION
A trend that is developing in recent years is the requirement for mobile RF frontends to accommodate several RF transmission standards. From a power amplifier (PA) perspective, multi-standard signal transmission at frequencies of 2.4 GHz (802.15.1) up to 5.725 GHz (802.11.x) requires broadband amplifiers such as e.g. traveling wave amplifiers (TWAs). The TWA principle, first introduced by Percival [Reference Percival1] and Ginzton et al. [Reference Ginzton, Hewlett, Jasburg and Noe2], was at the beginning envisaged for circuit realizations by means of vacuum tubes, discrete inductors, and capacitors. Ayasli et al. [Reference Ayasli, Mozzi, Vorhaus, Reynolds and Pucel3] and Beyer et al. [Reference Beyer, Prasad, Becker, Nordmann and Hohenwarter4] developed the original equations set further for the accommodation of the structural conditions that arise when implementing TWAs in GaAs FET technology. With the high substrate resistance of GaAs, the parasitic losses associated with the inductors could be neglected and the dominant loss factor reducing the RF gain versus frequency was the input gate source resistance R gs. Given this background, the developed equation sets were satisfactorily adequate to predict the achievable gain bandwidth product (GBW) of TWAs.
With the rise of CMOS integration as the major circuit technology nowadays, this, unfortunately, is no longer the case. Parasitic series and parallel losses associated with the integrated inductors significantly influence the overall circuit behavior. This is particularly true for TWA architectures, which heavily rely on integrated inductors to approximate the input and output transmission lines.
In this work, we propose a practical analytical solution for TWA architectures that incorporates the dominant loss factors of CMOS integrated inductors. A discrete transmission line model is presented that comprises resistive, capacitive, and inductive effects occurring in CMOS TWA realizations. Based on this model, the associated transmission line damping factor and phase constant are calculated and used for the derivation of the small signal gain. The RF gain is then weighted with the reductions due to non-ideal matching conditions at the input and output port versus frequency.
Section II will present details of the amplifier design and the derivation of the RF gain function, and treats the impact of the different loss factors on the transmission line. The overall architecture will be discussed and an analysis presented that explains the instrumental self-resonant effect of the DC supply coil in order to decouple the DC path RFwise. Section III compares the analysis, simulation, and measurement results. The work ends with a comparison with the state-of-the-art and the conclusion.
II. CIRCUIT ANALYSIS AND DESIGN
Figure 1 shows a schematic drawing of the TWA. The TWA structure creates a discrete transmission line approximation for the input and output lines by using the transistor input and output capacitances C gs and C ds together with in-series-connected inductors. Additional parallel capacitances C x in the output line compensate for the smaller C ds values and help achieve balanced phase velocities through all signal paths from the input to the output, assuring constructive RF signal addition. The circuit is realized in 180 nm IBM CMOS technology. The implemented design employs a cascode gain cell, which offers superior amplification in comparison to common source gain cells. The reason why the number of gain cells is chosen as 4 will be explained later. The DC supply path is realized through the inductor L DC. Figure 1, however, omits the series and parallel losses of the integrated inductors, which are a result of the finite metal conductivity and the capacitive coupling to the substrate, respectively.
Schematic representation of the realized TWA structure.

Figure 2 shows an inductor equivalent model including the dominant parasitics in the oxide and substrate layer, C ox, C si, and R si. The resulting parallel impedances Y p to the ground are calculated in equation (1) and transformed into a better manipulating form for later derivations (2). The component values for the applied inductors in the input and output lines were determined using Cadence. The S-parameters of the parasitic IBM model were matched to the S-parameters of the proposed model in the desired frequency range from DC to 10 GHz. The resulting component values are displayed in the Appendix:


Inductor model including parasitic losses.

Equations (3) and (4) show the obtained equivalent components for an adapted cascode model. For the output side of the cascode, C ds and R ds, respectively, G ds are derived for the accustomed MOSFET small-signal representation. For the input side, the serially connected components R gs and C gs are transferred in a parallel representation  and
 :


Simultaneously, the transconductance  remains no longer real but also contains a complex part. The parameters can be read out directly from a Cadence Y-parameter simulation. The results are valid for negligible Y 12 values, being the case for cascode gain cells. The values, simulated with Cadence and shown in the Appendix, are saved as solution vectors from DC to 10 GHz for the complex valued calculations in Matlab and result in a steady-state solution for the frequency range considered.
Figure 3 depicts the derived small signal model for the discretized input and output transmission line elements, omitting the complex transconductance. Adding the components up results in the elements L si,o, R si,o, C pi,o, and G pi,o as derived in the following equations:


Complete small signal model for the discrete transmission line components in the input and output line.

These equivalent circuits for the input and output lines are the same as those used for the well-known telegraph equation. The complex propagation constant γg,d for the telegraph equation can be calculated by (9); the damping factor and phase constant of the lines can then be derived by extracting the complex square root as shown in (10). The complex roots generally yield four results ±α g,d±β g,d. Being only interested in the absolute values α g,d and β g,d, the solution is unambiguous:


Having derived  , α d,g, β g,d, Z d and Z g and knowing the number of stages n, the equation for the RF-gain G presented by Ayasli et al. [Reference Ayasli, Mozzi, Vorhaus, Reynolds and Pucel3] can be applied, written down, slightly adapted for the complex transconductance, in the following equation:


Equation (12) ideally postulates an infinite number of stages n to approximate the transmission line by discrete line elements. Four elements are considered sufficient to assume idealized transmission line approximation conditions. Furthermore, equation (12) assumes perfect matching conditions and does not consider power reflections that occur with non-ideal matching. By determining S 11 and S 22 from a Cadence simulation, the RF gain G can be weighted correspondingly by transforming the S 11 and S 22 values into the percentage of transmitted RF power and thereby reduced gain as shown in the following equations:


Another important aspect is how much RF power is lost into the DC supply path. Determining the complex impedances Z DC and Z L with Cadence, shown in Fig. 4, the RF power into the DC path and to the load can be calculated by


Equivalent model for DC supply connection.

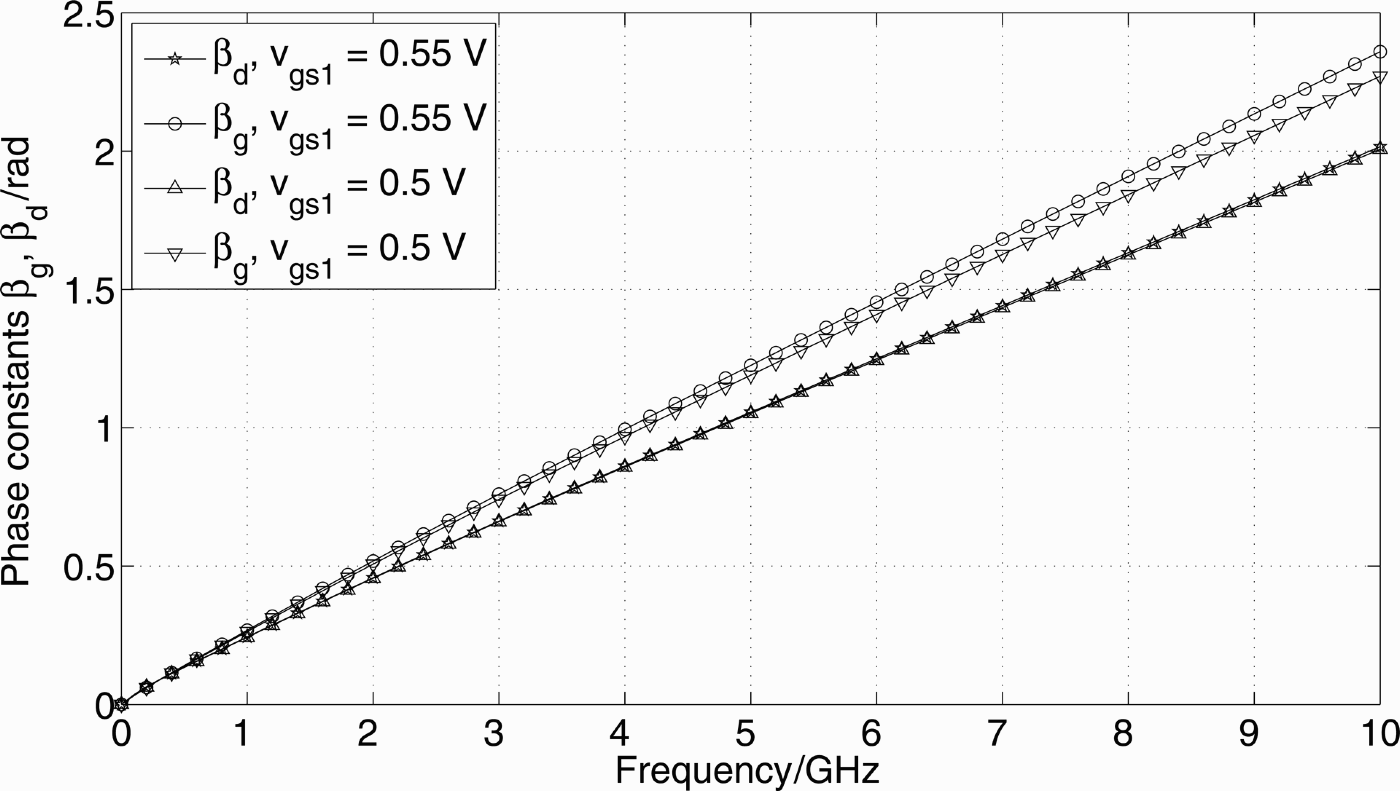
Figures 5 and 6 show the analyzed values for the damping factors α g, α d and phase constants β g, β d of the input and output transmission lines. The values shown were extracted for the cascode gain cell applying gate bias voltages V gs1 of 0.5 and 0.55 V, V gs2 of 2.0 V, and V dd of 2.4 V as well as the extracted parasitic inductor components. For the inductors in the input and output line being almost of the same size, two things are worth noting. Both α g and α d increase significantly for high frequencies, as the capacitive coupling effect on the substrate gets more pronounced for higher frequencies. Although α g exceeds α d by 20% at 10 GHz, due to the stronger damping impact of  versus G ds, the strong damping of the output line shows how significant the no longer negligible impact of the parasitically loaded inductors is. The phase constants of both lines differ by 14% at 10 GHz, due to C pi being larger than C po but still small enough for constructive RF signal addition.
Analyzed damping factors α g and α d.

Analyzed phase constants β g and β d.

Figure 7 depicts simulated S 11 and S 22, obtained with Cadence, and Fig. 8 depicts the simulated versus calculated RF gain. Shown are the analysis results with and without matching impact (12), (16) as well as the Cadence simulation. One can see the close resemblance and, additionally, the gain reduction due to the degrading port matching conditions for high frequencies.
Simulation port matching S 11 and S 22.

Analysis and simulation S 21, Analysis basic obtained with (12), Analysis weighted obtained with (15).

Figure 9 displays the influence of a  variation on S 21 as well as the applied
 values, depicted as a resistance
 for better legibility. It can be seen that
 barely influences the low-frequency gain, being very small. For high frequencies, however,
 has a visible impact, if the values are decreased from the original obtained component value for the cascode.
Analysis of the G gso influence on S 21, V gs1 = 0.55 V.

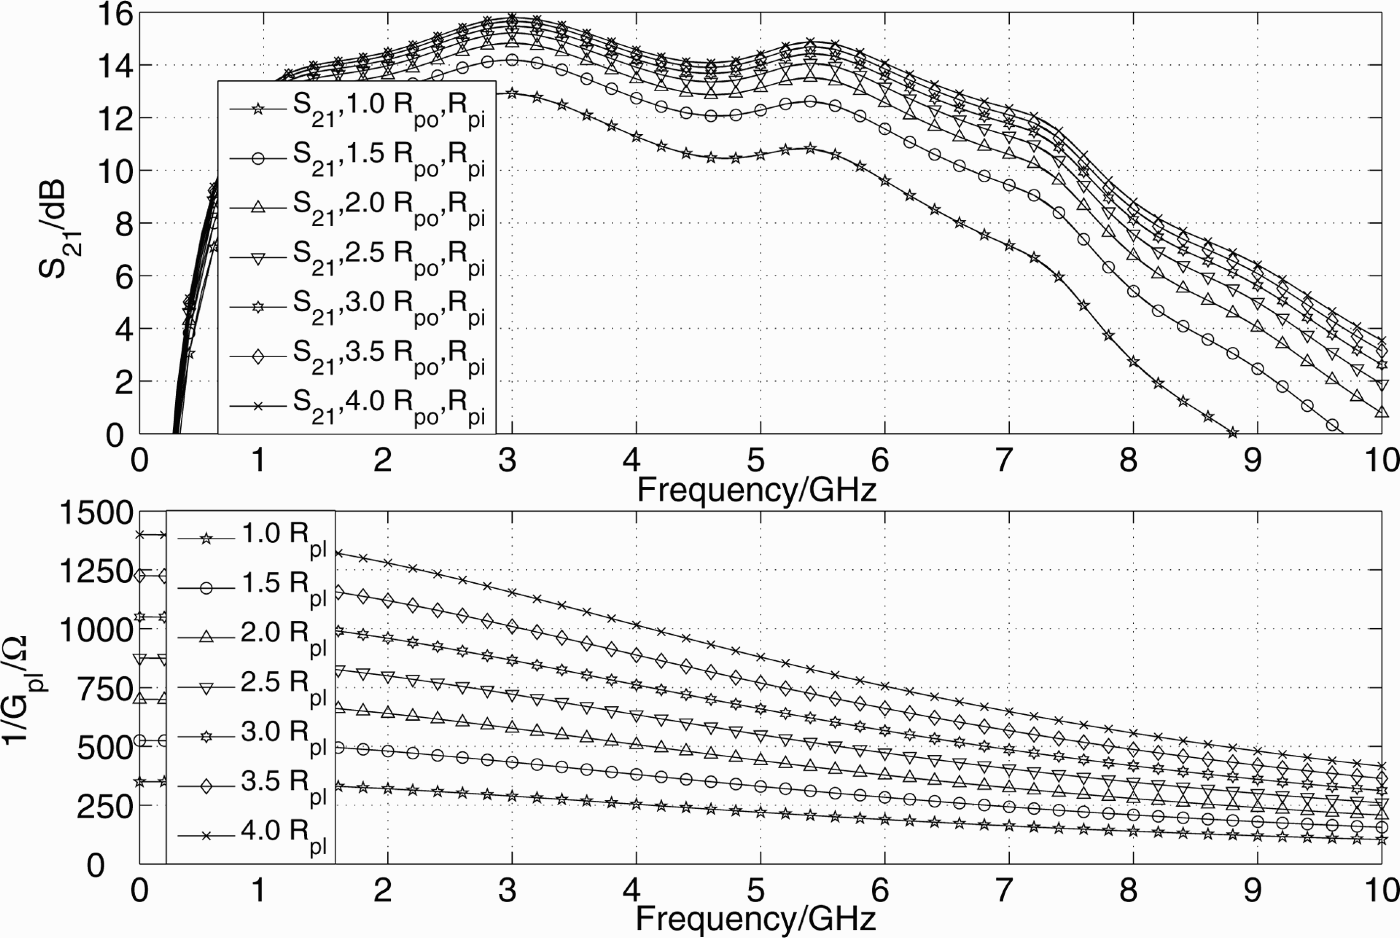
Figure 10 shows the influence on S 21 if G pr and G pl are simultaneously swept for the input and output lines. A much more pronounced impact both for low and high frequencies can be seen when compared to the  impact. G pl and G pr are both approximately of the same size, also for the input and output lines, and G pl, shown in the lower subplot of Fig. 10, attains the same low resistance values as
 . Therefore, G pl and G pr influence the RF gain approximately four times as strongly as
 . This illustrates to which point the CMOS integrated inductor losses affect the TWA design.
Analysis G po and G pi influence on S 21, V gs1 = 0.55 V.

The upper subplot of Fig. 11 displays the calculated RF power split into the DC supply path and towards the load according to (16) and (17) and the lower subplots display the corresponding resistances and reactances, obtained with Cadence. Most of the RF power is directed towards the load, as the self-resonance effect of the DC inductor acts as an RF block from around 4 GHz onward. From DC to 4 GHz, the Z DC resistance is small in comparison to the real part of Z L, and insignificant RF and DC real power is lost.
Analysis of RF power split into DC supply and load.

Figure 12 illustrates the variation of S 21 versus frequency if the number of stages is swept in (12). Depending on the frequency, different numbers of stages result in maximum S 21. At low frequencies, the substrate coupling has little influence and adding stages leads to higher amplification. For high frequencies, however, RF power is increasingly lost into the substrate. Based on the results shown in Fig. 12, Fig. 13 shows the optimum number of stages for maximum RF gain versus frequency. Up to 6.5 GHz, four stages or more provide maximum S 21 values, whereas beyond that smaller numbers are advantageous. As a tradeoff for the highest gain over the whole frequency range from 1 to 8 GHz, four stages have been chosen, as the RF gain degrades rapidly for a larger number of stages from 6 GHz onwards.
Analysis S 21 for differing number of stages, V gs1 = 0.55 V.

Analyzed optimum number of TWA gain stages.

The realized layout is illustrated in Fig. 14. The integrated series inductors are optimized for minimum parasitic loss by using pattern ground shields. They are arranged to alleviate mutual coupling and realize a ground plane that minimizes parasitic inductances towards the gain cells to avoid inductive source degeneration and thereby reduced RF gain.
Realized TWA layout, 1.45×1.0 mm2.

III. RESULTS
An Anritsu 37000D NWA, an NRP Rhode & Schwarz Z-55 power meter, an Agilent 86100C Infiniium DCA oscilloscope, an Agilent 8257D signal generator, a SUESS PM8 probe station PM8, and GGB probes were used for measurements.
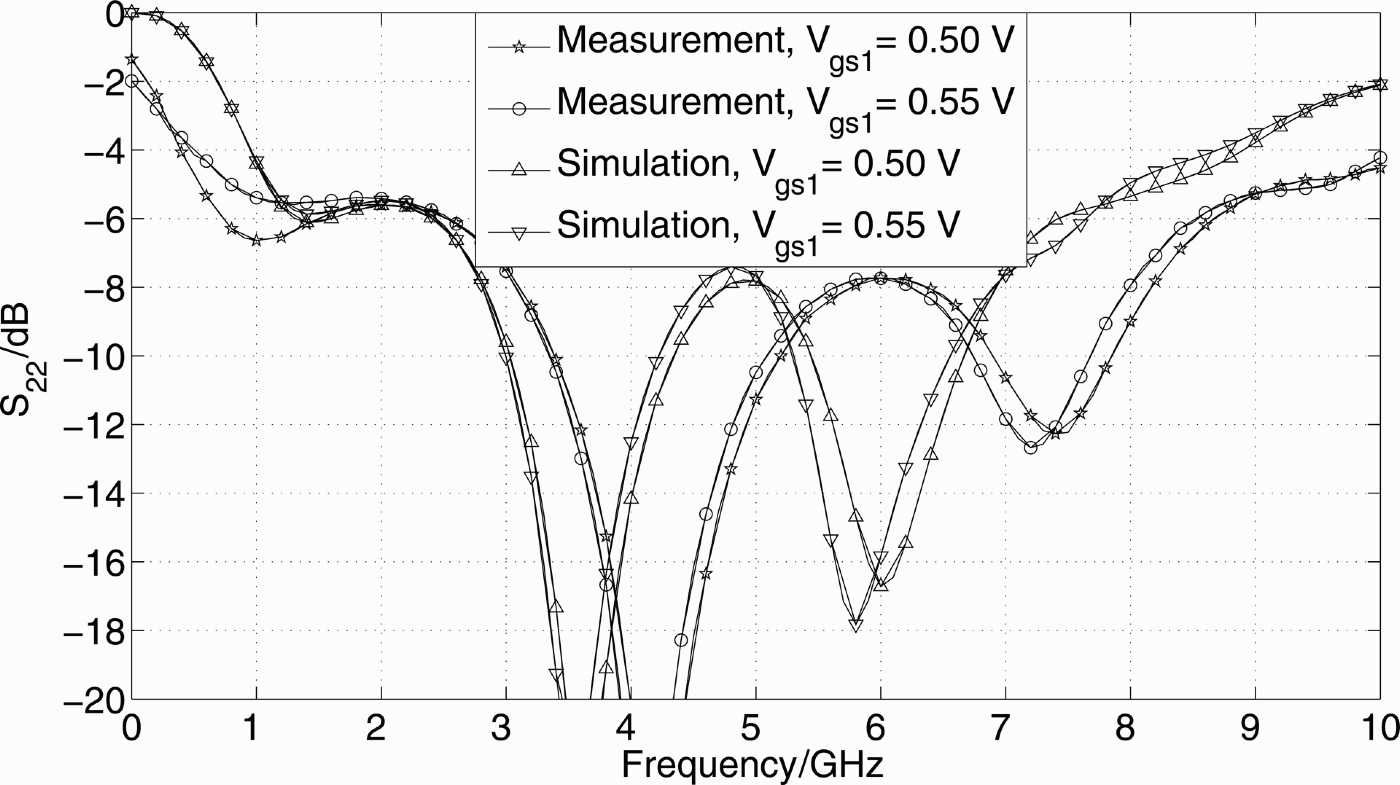
All simulations and measurements are obtained for V dd of 2.4 V and a gate voltage V g2 of 2.0 V, equivalent to a gate source voltage V gs2 of 0.67 V. Figures 15 and 16 show simulated and measured S 11 and S 22.
Measured and simulated S 11.

Measured and simulated S 22.

The matching pattern is maintained, although the matching peaks are slightly shifted to higher frequencies. Improved high-frequency matching is measured, which is the main reason for the improvement of the measured versus simulated RF gain at high frequencies, shown in Fig. 17.
Measured, simulated, and calculated S 21.

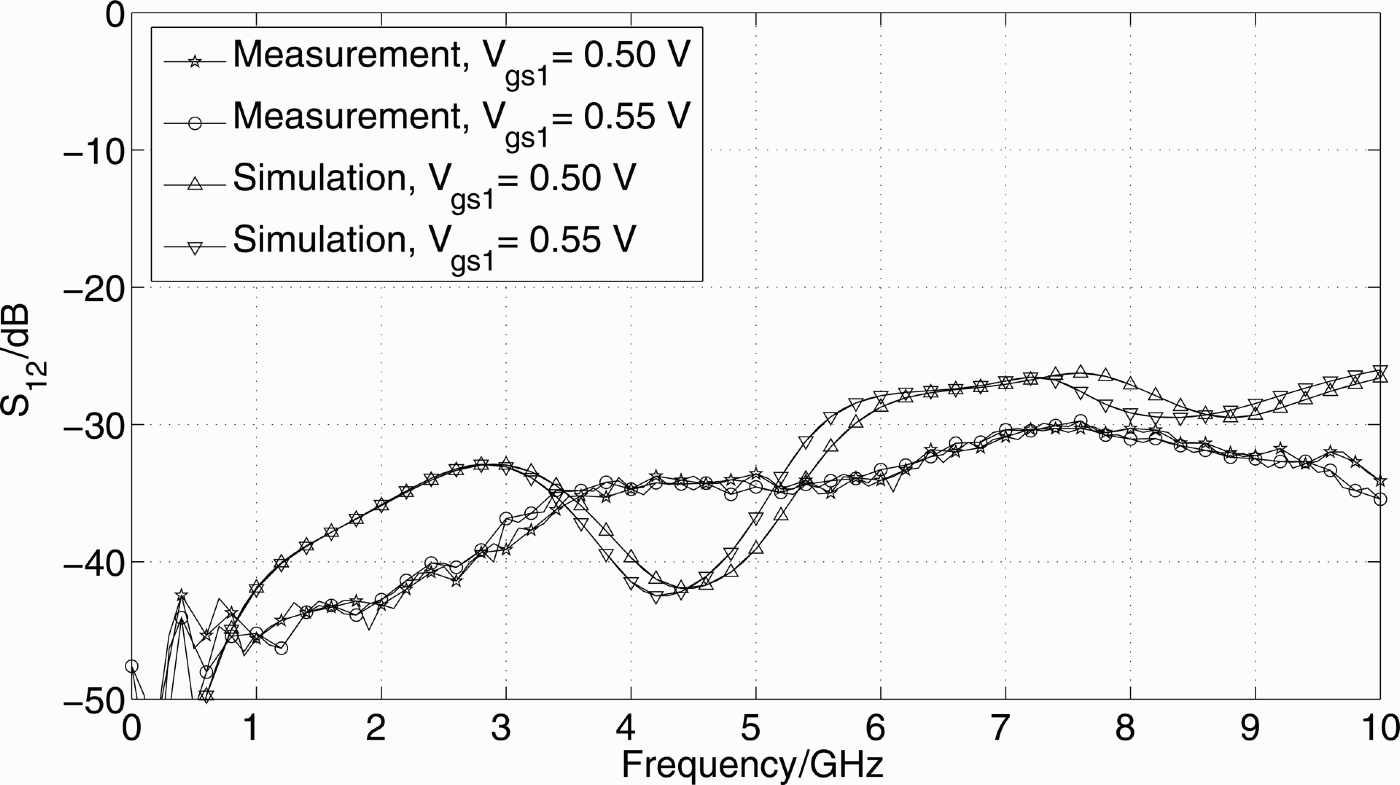
For V gs1 of 0.5 V, S 21 larger than 8 dB up to 7 GHz is measured. For V gs1 of 0.55 V, which results in higher g m, measured S 21 reaches values greater than 10 dB until 7 GHz. Figure 18 displays simulated and measured S 12. A certain discrepancy can be observed; however, the general trend holds and values below −30 dB are measured.
Measured and simulated S 12.

Figures 19 and 20 show the simulated and measured compression point P 1 dB and the associated PAE for 2.4 and 5.5 GHz. Highest P 1 dB values and efficiencies are obtained for the lower gate bias voltage V gs1 of 0.5 V. At 2.4 GHz, a P 1 dB of 16.9 dBm and a PAE of 19.6% are measured, while at 5.5 GHz, P 1 dB equals 16.6 dBm and PAE attains 13.9%. The measurement results are in close accordance with the Cadence layout extraction simulations.
Measured and simulated P 1 dB and PAE at 2.4 GHz.

Measured and simulated P1 dB and PAE at 5.5 GHz.

The two-tone test measurements resulted in OIP3 values at 2.4 GHz of 24.1 and 24.0 dBm for a V gs1 of 0.5 and 0.55 V. At 5.5 GHz, the corresponding measured OIP3 results amounted to 20.8 and 18.6 dBm.
IV. COMPARISON WITH STATE-OF-THE-ART
Comparing TWAs with each other is challenging, as they are optimized for differing bandwidths, S 21, P 1 dB, efficiencies, and supply voltages, using different technologies such as GaAs, CMOS, BiCMOS, or SOI. The work of Sewiolo and Weigel [Reference Sewiolo and Weigel5] comes closest to the optimizations targeted here. It applies a four-stage bipolar common source tapered architecture to a V dd of 5 V and achieves a gain of 9 dB up to frequencies of 12 GHz. However, a P 1 dB of 14 dBm and a PAE of around 9% are obtained at the cost of high V dd. The work of Grewing [Reference Grewing, Winterberg, van Waasen, Friedrich, Li Puma and Wiesbauer6] can also be used for comparison. Although Grewing achieved a satisfying RF gain greater than 10 dB up to 7 GHz, the P 1 dB of 3.5 dBm and the PAE of 2.25% he obtained are substantially less than the values attained here. To the knowledge of the author, the present work is the first to present a new methodology for assessing all the dominant loss contributions of integrated inductors in TWA designs. Furthermore, very competitive measurement results for a medium supply voltage of 2.4 V have been achieved, as can be seen from the obtained P 1 dB and efficiency values (Table 1).
Comparison with state-of-the-art.

V. CONCLUSION
By expanding the present TWA theory with the calculation of the parasitic substrate losses in CMOS integrated inductors, an enhanced RF gain prediction accuracy for integrated CMOS TWAs is achieved. Hence, an efficient circuit and inductor optimization is possible. The concept has been verified by a design example of a 1–8 GHz TWA for multistandard applications, realized in 180 nm CMOS technology that exhibits a lossy substrate. A comparison of the analysis, Cadence simulation, and measurement results shows very good agreement among them.
ACKNOWLEDGEMENT
The authors would like to thank the EU Commission for funding the project RESOLUTION [Reference Ellinger, Eickhoff, Gierlich, Huettner, Zieroff and Wehrli8] within the Sixth Framework Programme, which has made this research possible.
APPENDIX
The resulting component values are displayed in Table 2.
Numerical result vectors from DC to 10 GHz containing the extracted component values.

 Joerg Carls (S'07) was born in Bad Schwalbach, Germany, in 1979. He received his diploma degree in electrical engineering in 2005 from the Swiss Federal Institute of Technology, Zurich (ETHZ). After working in Strategic Consulting, he started as a Ph.D. student at the ETHZ in March 2006 and continued his research work at the Chair of Circuit Design and Network Theory at the Dresden University of Technology since September 2006. His main research interests lie in the field of highly efficient low-voltage power amplifiers in CMOS. He is developing the RF transmitter frontend in the framework of the European Union (EU)-funded project RESOLUTION.
 Frank Ellinger (S'97-M'01-SM'06) was born in Friedrichshafen, Germany, in 1972. He graduated in electrical engineering (EE) from the University of Ulm, Germany, in 1996. He received MBA and Ph.D. degrees in EE from the ETH Zürich, Switzerland, in 2001, and habilitation degree in high-frequency circuit design from the ETH in 2004.
Since August 2006, he is full professor and head of the Chair for Circuit Design and Network Theory at the Dresden University of Technology. Mr. Ellinger is responsible for several projects funded by the EU. From 2001 to 2006, he has been head of the RFIC design group of the Electronics Laboratory at the ETH, and project leader of the IBM/ETH Competence Center for Advanced Silicon Electronics at IBM Research in Rüschlikon. He is mainly engaged in the design of high-speed analogue integrated circuits for wireless and optical communication.
In the time frame between 2005 and 2006, he served as an associated editor for the IEEE Micowave and Wireless Component Letters. He has published more than 100 refereed scientific papers, most of them IEEE journal contributions, and three patents. He authored the book “Radio Frequency Integrated Circuits and Technologies”, which has been published in March 2007 by Springer. For his works he received several awards including the ETH Medal, the Denzler Award of the Swiss Federal Association of Electrical Engineers, the Rohde & Schwarz/Agilent/Gerotron EEEfCOM Innovation Award and a Young Ph.D. Award of the ETH Zürich.
 Yulin Zhang was born in Shanghai, China, in 1977. He started his studies at the Dresden University of Technology, TUD, in 2003 and is currently working on his master's thesis at the Chair for Circuit Design and Network Theory, TUD. His main research interests lie in the field of high-frequency CMOS analog integrated circuit design.
 Udo Jörges was born in Steinach/Thuringia/Germany, in 1952. He graduated in electrical engineering (EE), from the Dresden University of Technology, Germany, in 1975. He received the Ph.D. degree in 1979 and the habilitation degree in EE from the Dresden University of Technology in 1985.
Since 1999, he is an associate professor and since 2006 at the Chair for Circuit Design and Network Theory at Dresden University of Technology. His main research interests are in the fields of circuit theory and the design of analogue integrated circuits.
 Silvan Wehrli (S'07) was born in Zurich, Switzerland, in 1980. He received the M.S. degree in electrical engineering and information technology from the Swiss Institute of Technology of Zurich (ETHZ), Zurich, Switzerland, in 2005. In 2006, he joined the Swiss Federal Institute of Technology, Zürich (ETHZ), Switzerland, and is currently working toward the Ph.D. degree. His research interests are in the areas of local positioning systems and RF circuit design.