

1. Introduction
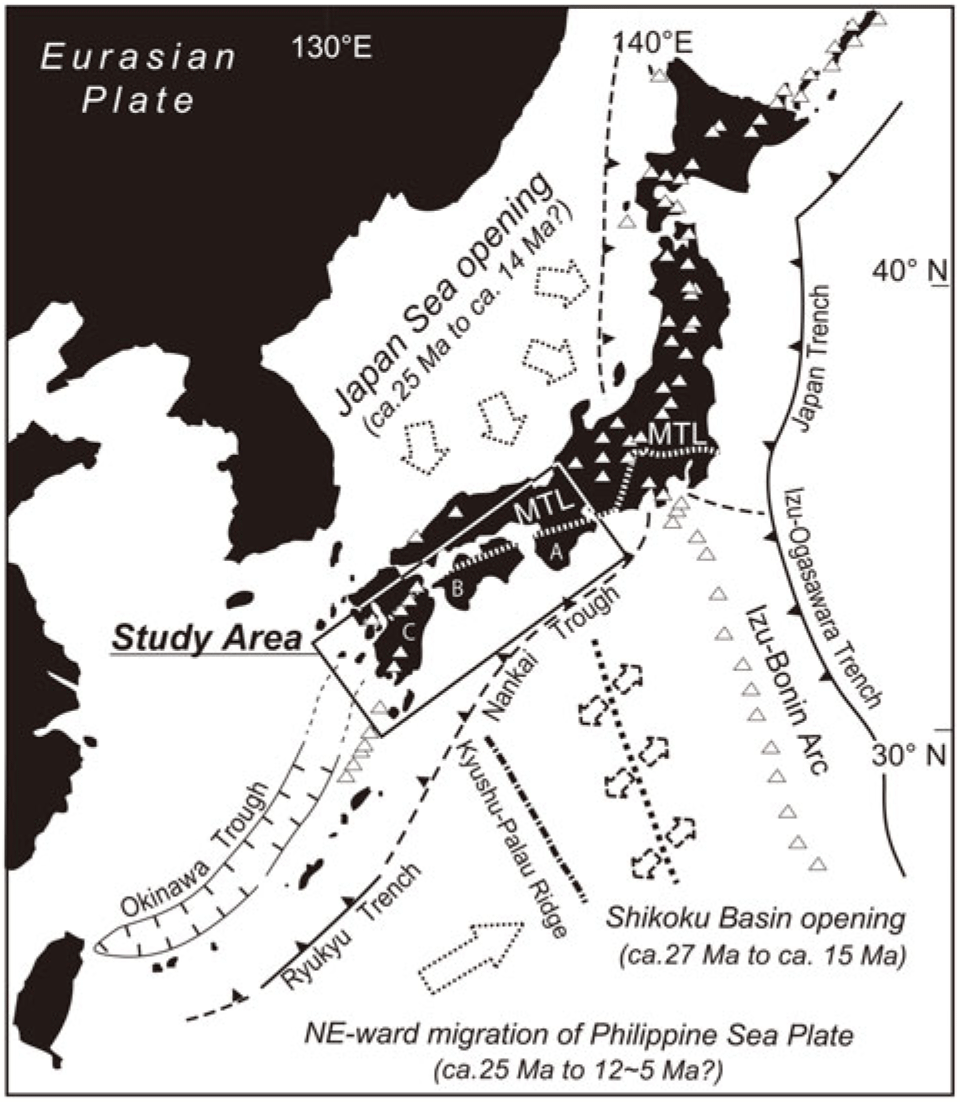
In the SW Japan arc, igneous rocks of Miocene age are distributed in a belt 800 km long and 150 km wide (Figs 1, 2). During middle Miocene time, intensive magmatism took place in a region closer to the Nankai Trench than the Quaternary volcanic front, just behind fore-arc basins that are filled with middle to late Miocene sediments (Fig. 2). Such near-trench magmatism cannot be explained by the conventional model of magma generation in island arc settings (e.g. Tatsumi, Reference Tatsumi1989). Instead, it is commonly thought to form as a consequence of ridge subduction (DeLong et al. Reference DeLong, Schwarz and Anderson1979; Iwamori, Reference Iwamori2000; Kimura et al. Reference Kimura, Stern and Yoshida2005). The ‘blowtorch effect’ related to the rise of asthenospheric mantle through slab windows (DeLong et al. Reference DeLong, Schwarz and Anderson1979) may also have enhanced slab melting by the subduction of a young and hot oceanic plate (Defant & Drummond, Reference Defant and Drummond1990).
Index map showing the tectonic setting of the Japanese Islands and the location of the SW Japan arc (rectangle). Also indicated are Miocene tectonic events including the rapid clockwise rotation of the SW Japan arc related to the opening of the Japan Sea and the clockwise rotation of the Philippine Sea plate. An extinct spreading ridge on the Philippine Sea plate that formed the Shikoku Basin is indicated with dashed lines. Open triangles are Quaternary volcanoes. Localities in the study area: A, Kii Peninsula; B, western Shikoku; C, Kyushu; MTL, Median Tectonic Line.
Outline map of SW Japan showing the distribution of middle Miocene igneous rocks in the near-trench region of the SW Japan arc (compiled from Geological Survey of Japan, 2015). Abbreviations of tectonic features: MTL, Median Tectonic Line; BTL, Butsuzo Tectonic Line; UYTL, Usuki–Yatsushiro Tectonic Line. Abbreviations of igneous bodies: OGRs, Ohmine Granitic Rocks; KARs, Kumano Acidic Rocks; MM, Murotomisaki body; SG, Shingu alkali basalt dike; AS, Ashizuri igneous complex; TG, Tanegashima alkali dolerite dike. Numbers next to igneous bodies correspond to their entries in Table 1. Black triangles represent Quaternary volcanoes. Light grey shading indicates the Setouchi Volcanic Belt.

The origin of middle Miocene magmatism in the SW Japan arc is usually ascribed to the subduction of hot lithosphere of the Shikoku Basin, the product of a spreading ridge in the Philippine Sea plate, because the magmatism is almost coeval with the initiation of Philippine Sea plate subduction, immediately after the opening of the Japan Sea and clockwise rotation of SW Japan (Fig. 1) (Kimura et al. Reference Kimura, Stern and Yoshida2005; Tatsumi, Reference Tatsumi2006). Because spreading of the Shikoku Basin continued until c. 15 Ma (Okino et al. Reference Okino, Ohara, Kasuga and Kato1999), subduction of this spreading ridge and fracture zone system is thought to have taken place at the same time as the magmatism (Maruyama, Reference Maruyama1997; Kimura et al. Reference Kimura, Stern and Yoshida2005). This tectonic interpretation largely depends on the assumption that the proto-Izu–Bonin–Mariana (IBM) arc had arrived near its present position before magmatism began (Seno & Maruyama, Reference Seno and Maruyama1984).
An alternative explanation is that the near-trench magmatism occurred as the trench–trench–trench (TTT)-type triple junction of the Pacific, Philippine Sea and Eurasia plates migrated eastward during the opening of the Shikoku Basin (Marshak & Karig, Reference Marshak and Karig1977). Some plate reconstruction models that emphasize clockwise rotation of the Philippine Sea plate during Miocene time based on the palaeomagnetic evidence favour this model (Hall et al. Reference Hall, Ali, Anderson and Baker1995; Hall, Reference Hall2002; Sdrolias et al. Reference Sdrolias, Roest and Müller2004). Clift et al. (Reference Clift, Carter, Nicholson and Masago2013) provided independent evidence to support the triple-junction migration model: middle Miocene sediments in the accretionary prism of the Nankai Trough contain zircon crystals with wide age ranges, which implies that they were supplied directly from the Yangtze River to the Shikoku Basin. Thus, at that time the Kyushu–Palau Ridge to the west of the Shikoku Basin was not a topographical barrier that prevented direct inflow of sediments through the East China Sea. Kimura et al. (Reference Kimura, Hashimoto, Kitamura, Yamaguchi and Koge2014) interpreted the eastward migration of magmatism in middle Miocene time within the framework of the triple-junction migration model, suggesting that the migration was related to the movement of the proto-IBM arc. However, because of most of their K–Ar ages with a low analytical precision, more precise and consistent age data were needed to trace the development of the SW Japan arc in detail.
In this paper, we present newly obtained zircon U–Pb ages of near-trench felsic rocks in the SW Japan arc. These data were obtained from an elongated area parallel to the trench more than 100 km across and 600 km long. Although Miocene magmatism extends from the Ryukyu arc in the south to the Honshu–IBM arc collision zone, we concentrated on the region between the island of Kyushu and the Kii Peninsula, where the evidence of Miocene magmatism has not been disturbed by later magmatism related to the IBM arc collision.
2. Geological background
2.a. Outline of geology
The SW Japan arc is divided along the Median Tectonic Line into the Outer Zone, on the south side nearer to the trench, and the Inner Zone on the north side (Fig. 2). Quaternary volcanism has occurred almost entirely north of the SW Japan arc except in southern Kyushu. Miocene near-trench magmatism occurred mainly in the Outer Zone and in the Setouchi province, part of the Inner Zone (Fig. 2). The basement of the Setouchi province consists of Jurassic accretionary complexes and Late Cretaceous granitic intrusions (Maruyama, Reference Maruyama1997), and the basement of the Outer Zone consists of Triassic to Cretaceous metamorphic and accretionary complexes. The Shimanto Belt, a Cretaceous to early Miocene accretionary complex formed in cold hydrous fore-arc, is distributed south of the Butsuzo Tectonic Line (Taira, Reference Taira1988), in the southernmost part of the Outer Zone. In Kyushu, the Usuki–Yatsushiro Tectonic Line is regarded as the extension of the Median Tectonic Line, though some researchers have disputed this interpretation based on the distribution of Mesozoic metamorphic complexes (Miyazaki et al. Reference Miyazaki, Ozaki, Saito, Toshimitsu, Moreno, Wallis, Kojima and Gibbons2016).
Miocene near-trench magmatism is classified on the basis of lithology and distance from the Nankai Trench into three provinces, described below and summarized in Table 1.
Summary of geological background of the near-trench igneous bodies in SW Japan analysed in this study

* Reference and individual data are listed in the Supplementary Material (S10) (https://doi.org/10.1017/S0016756819000785). Abbreviations for the analysed samples are as follows: zr, zircon; wr, whole rock; bt, biotite; pl, plagioclase; ksp, K-feldspar; hbl, hornblende.
2.a.1. Setouchi province
In the Setouchi province, the farthest from the trough, sporadically distributed volcanic rocks such as pitchstone, garnet-bearing dacite, and aphyric and glassy andesite compose the Setouchi Volcanic Rocks (Tatsumi, Reference Tatsumi2006). They are characterized by the production of high-Mg andesites, which are presumed to have been formed by the reaction of slab melt with peridotite in the mantle wedge based on their geochemical characteristics (Tatsumi, Reference Tatsumi2006). This assumption is reinforced by the presence of dacites and rhyolites with high Sr/Y ratios and depleted heavy rare-earth element with no or small Eu negative anomaly profiles consistent with slab melting (Shimoda & Tatsumi, Reference Shimoda and Tatsumi1999; Shinjoe et al. Reference Shinjoe, Orihashi, Wada, Sumii and Nakai2007).
2.a.2. Outer zone granitic rocks
The second province, south of the Median Tectonic Line, consists of voluminous felsic to intermediate igneous complexes here called the Outer Zone Granitic Rocks (OZGs). These complexes are mainly isolated plutons and volcano–plutonic complexes, some of which formed large calderas. OZGs closer to the trench have higher K2O contents and alumina saturation indexes (molar Al2O3/(CaO + Na2O + K2O)) than those farther from the trench (Nakada & Takahashi, Reference Nakada and Takahashi1979; Shinjoe et al. Reference Shinjoe, Orihashi, Wada, Sumii and Nakai2007). A regional zonal gradation is recognized from S-type ilmenite-series granites near the trench to I-type ilmenite-series granites away from the trench (Ishihara, Reference Ishihara1977; Takahashi et al. Reference Takahashi, Aramaki and Ishihara1980; Murata & Yoshida, Reference Murata and Yoshida1985). They are described here from east to west.
OZGs in the southern Kii Peninsula include the Ohmine Granitic Rocks (OGRs) and the Kumano Acidic Rocks (KARs) (Fig. 2). The OGRs consist, from north to south, of the Dorogawa, Shirakura, Kose, Asahi, Tenguyama and Shiratani plutons along with many satellite stocks and dikes of granitic to granodioritic composition. Murata (Reference Murata1982, Reference Murata1984) classified the Dorogawa and Shirakura plutons as I-type granites and the others as S-type granites on the basis of their major-element compositions and petrography.
Along the eastern coast of the Kii Peninsula, the KARs extend over an area of ∼600 km2 and overlie early to middle Miocene sedimentary rocks of the Kumano Group. They are composed, in ascending order, of rhyolitic lava (Konogi rhyolite), ash-flow tuff (Owase–Shirahama pyroclastic rocks; Kawakami & Hoshi, Reference Kawakami and Hoshi2007) and a laccolith of porphyritic granite (e.g. Aramaki & Hada, Reference Aramaki and Hada1965; Miura & Wada, Reference Miura and Wada2007). Based on their distribution, the KARs are divided into northern and southern units, and a large (41 × 23 km) trapdoor caldera structure, referred to here as the Kumano caldera, is recognized in the southern unit (Miura, Reference Miura1999). An arcuate pyroclastic dike (Kozagawa dike) is exposed along its southern margin (Mizuno, Reference Mizuno1957; Hoshi et al. Reference Hoshi, Kamiya and Kawakami2013). A caldera collapse structure measuring 20 × 30 km is recognized in the northern unit (Kawakami et al. Reference Kawakami, Hoshi and Yamaguchi2007).
The KARs have peraluminous compositions and commonly contain cordierite and garnet phenocrysts (Aramaki & Hada, Reference Aramaki and Hada1965; Shinjoe et al. Reference Shinjoe, Orihashi, Wada, Sumii and Nakai2007), as in the S-type granites of the OGRs. A large batholith is inferred beneath the KARs and OGRs (Miura, Reference Miura1999; Miura & Wada, Reference Miura and Wada2007) from magnetotelluric evidence of a northward dipping high-resistivity rock mass beneath the Kumano caldera (Fujita et al. Reference Fujita, Ogawa, Yamaguchi and Yaskawa1997), and extends beneath the OGRs where it connects with a deeper resistive body (Umeda et al. Reference Umeda, Uehara, Ogawa, Kudo and Kakuta2003). Another large caldera, the Ohmine–Odai caldera (Sato & YORG, Reference Sato2006), is inferred from the presence of arcuate faults and pyroclastic dikes. It extends NW of the northern unit of the KARs where it overlaps exposures of the OGRs, the Nakaoku dike swarm (Wada & Iwano, Reference Wada and Iwano2001), and the Ohmine dike (Kimura, Reference Kimura1986). Related to the OGRs is the Takamiyama porphyritic granite, intruded along the Median Tectonic Line. Its S-type major-element composition and petrography (Wada & Araki, Reference Wada and Araki1997) makes it an exception to the zonal arrangement of S-type and I-type granites.
In NW Shikoku, the Ishizuchi Group covers a 35 × 10 km area south of the Median Tectonic Line (Yoshida, Reference Yoshida1984). In stratigraphically ascending order it consists of the Takano pyroclastic flow deposits, Kuromoritoge andesite, Saragamine andesite, Yoaketoge altered dacite and Tengudake pyroclastic flow deposits. These are intruded by ring dikes and the central Omogo pluton, an I-type granite. The upper three units are within the circular Ishizuchi caldera, which is defined by a system of arcuate faults c. 7 km in diameter (Yoshida, Reference Yoshida1984; Takehara et al. Reference Takehara, Horie, Tani, Yoshida, Hokada and Kiyokawa2017). In western Shikoku, the Myojinyama-type Acidic Rocks (Tazaki et al. Reference Tazaki, Kagami, Itaya and Nagao1993), felsic intrusions composed of holocrystalline dacite and rhyolite, are distributed along the Median Tectonic Line in lenticular exposures as long as 5 km. Southwesternmost Shikoku contains S-type granitic plutons and some satellite stocks (Fig. 2). The Okinoshima–Kashiwajima pluton, which intrudes Palaeogene rocks of the Shimanto accretionary complex, is subdivided into Tanijiri-type granodiorite and Mojima-type granite (Dai et al. Reference Dai, Tsusue and Honma1993). The Uwajima pluton is composed of biotite granodiorite containing cordierite-bearing and hypersthene-bearing lithologies, although their order of intrusion is unclear (Shinjoe, Reference Shinjoe1997).
In Kyushu, the OZGs include caldera-forming volcano–plutonic complexes in the north and batholithic plutons in the south. In northern Kyushu, the caldera-forming Okueyama and Osuzuyama complexes, among other small plutons, are generally S-type granites on the trench side (Yakushima, Minami–Osumi, Takakumayama, Murasho and Osuzuyama) and I-type granites on the back-arc side (Nakada & Takahashi, Reference Nakada and Takahashi1979). The Okueyama complex is a deeply eroded Valles-type caldera nested within a vertically zoned granitic batholith, and their combined original volume is estimated to exceed 1000 km3 (Takahashi, Reference Takahashi1986 a; Takahashi et al. Reference Takahashi, Tono and Kanamaru2014). Three phases of activity are recognized: formation of the Sobosan cauldron (18 × 13 km) and Katamukiyama cauldron (12 × 6 km), development of andesite/dacite composite volcanoes within the calderas, and formation of the Okueyama cauldron (33 × 23 km), which was preceded by the eruption of the Kunimidake rhyolitic tuff and followed by intrusion of the Okueyama batholith (Takahashi, Reference Takahashi1986 a). The Okueyama cauldron is surrounded by ring dikes of porphyritic granite. The Osuzuyama volcano–plutonic complex is composed of a porphyritic granitic intrusion accompanied by small granite stocks and overlying volcanic breccia and welded tuff, all of which are presumed to be comagmatic and derived from a single magma chamber (Nakada, Reference Nakada1983). In southern Kyushu, the batholithic Yakushima pluton (25 × 20 km) and Minami–Osumi pluton (48 × 15 km) intrude Palaeogene rocks of the Shimanto accretionary complex.
2.a.3. Marginal zone igneous rocks
The third province, Marginal Zone Igneous Rocks (after Takahashi, Reference Takahashi, Taira and Nakamura1986 b), is closest to the Nankai trough and consists of intrusive alkaline and tholeiitic basaltic rocks, with or without accompanying felsic intrusive rocks. Alkaline basaltic rocks are present at three localities (Fig. 2): the Tanegashima alkali dolerite dike on Tanegashima Island south of Kyushu (Taneda & Kinoshita, Reference Taneda and Kinoshita1972), the Ashizuri igneous complex in southernmost Shikoku (Murakami et al. Reference Murakami, Imaoka and Uozumi1989), and the Shingu alkali basalt dikes in north-central Shikoku (Uto et al. Reference Uto, Hirai, Goto and Arai1987). The Ashizuri complex is accompanied by felsic lithologies such as syenite and alkali granite. A tholeiitic gabbro sill 2 km long and up to 230 m thick intrudes the Eocene to early Miocene accretionary complex of the Shimanto Belt at Cape Murotomisaki in SE Shikoku (Akatsuka et al. Reference Akatsuka, Obata and Yokose1999) (Fig. 2), and a tholeiitic gabbro/basalt intrusion accompanies felsic effusive and intrusive rocks at Cape Shionomisaki at the southern tip of the Kii Peninsula (Miyake, Reference Miyake1985). These tholeiitic basalts have mid-ocean ridge basalt (MORB)-like geochemical characteristics and are thought to be the product of a subducted spreading ridge during the waning stage of the opening of the Shikoku Basin (Takahashi, Reference Takahashi, Taira and Nakamura1986 b; Yamaji & Yoshida, Reference Yamaji and Yoshida1998; Kimura et al. Reference Kimura, Stern and Yoshida2005).
2.a.4. Samples
We collected samples from Miocene felsic rocks of the Outer Zone, from the Kii Peninsula to Kyushu, for zircon U–Pb age determinations. Most samples were from OZGs. Samples were collected from the Ashizuri igneous complex and Shionomisaki Igneous Complex of the Marginal Zone Igneous Rocks, and zircon U–Pb ages for the Ashizuri igneous complex have previously been reported by Shinjoe et al. (Reference Shinjoe, Orihashi and Sumii2010). Two zircon-bearing mafic rocks from the Shionomisaki Igneous Complex were also sampled for U–Pb age determinations.
2.b. Geochemistry of felsic rocks of the Outer Zone
This section briefly describes the whole-rock geochemistry of the felsic rocks of the Outer Zone. The SiO2 contents of the felsic rocks range from 65 to 80 wt %, and major oxides are plotted against SiO2 in Figure 3. In these variation diagrams, samples from the Kii Peninsula, western Shikoku and Kyushu plot in almost the same areas, forming broad trends with SiO2 content. Some of the felsic rocks of the Shionomisaki Igneous Complex have low K2O contents that clearly differ from those of the S-type OZGs in the same region (Shinjoe et al. Reference Shinjoe, Orihashi, Wada, Sumii and Nakai2007). Most of the samples have alumina saturation index values greater than 1.0, except for those with relatively low SiO2 content (Fig. 3).
Major-element variation diagrams for the felsic rocks of the Outer Zone. Samples from the Shionomisaki igneous complex include two mafic rocks and a rhyolite. Most of the data points are for the samples used for the zircon U–Pb analysis, but some are for different samples of similar lithology. Data are from Ogasawara (Reference Ogasawara1997), Anma et al. (Reference Anma, Kawano and Yuhara1998), Shinjoe et al. (Reference Shinjoe, Orihashi, Wada, Sumii and Nakai2007) and Shinjoe (unpublished data). A/CNK, Alumina saturation index.

Trace-element evidence that distinguishes four broad tectonic categories (Pearce et al. Reference Pearce, Harris and Tindle1984) shows that nearly all of our samples fall in the field of volcanic arc granites (Fig. 4). The incompatible element profiles of Outer Zone felsic rocks in the Kii Peninsula (Shinjoe et al. Reference Shinjoe, Orihashi, Wada, Sumii and Nakai2007), shown in Figure 5, indicate that the I-type and S-type granites of the OZGs are enriched in large-ion lithophile elements and slightly depleted in Nb and Ta, whereas Ba, Sr and Eu are depleted to various degrees depending on the extent of feldspar fractionation. In the K-poor felsic rocks of the Shionomisaki Igneous Complex, large-ion lithophile elements are only weakly enriched.
Y–Nb and (Y + Nb) – Rb discrimination diagrams (Pearce et al. Reference Pearce, Harris and Tindle1984) showing the classification of felsic rocks of the Outer Zone of the SW Japan arc.

Whole-rock trace-element compositions of selected felsic rocks in the Kii Peninsula (data from Shinjoe et al. Reference Shinjoe, Orihashi, Wada, Sumii and Nakai2007), normalized to normal MORB (Sun & McDonough, Reference Sun, McDonough, Saunders and Norry1989).

OZGs from the Kii Peninsula and Kyushu (Terakado et al. Reference Terakado, Shimizu and Masuda1988) and the Uwajima pluton of SW Shikoku (Shinjoe, Reference Shinjoe1997) have 87Sr/86Sr ratios of 0.7054–0.7066 for I-type granites and 0.7061–0.7093 for S-type granites, and 143Nd/144Nd ratios of 0.51252–0.51260 for I-type granites and 0.51230–0.51257 for S-type granites. These Sr and Nd isotopic compositions are enriched compared to the present bulk Earth; however, these granites have lower 87Sr/86Sr and higher 143Nd/144Nd ratios than the sedimentary rocks of the Shimanto accretionary complex (Fig. 6). It appears that the magma source for these OZGs, even the S-type granites, included a mantle-derived component (Shinjoe, Reference Shinjoe1997).
Sr and Nd isotopic compositions of felsic plutonic rocks in the Outer Zone of the SW Japan arc (data from Terakado et al. Reference Terakado, Shimizu and Masuda1988; Shinjoe, Reference Shinjoe1997).

2.c. Previous geochronological constraints
Previous radiometric dates for the OZGs were mainly determined using K–Ar methods (Shibata & Nozawa, Reference Shibata and Nozawa1967). Shibata (Reference Shibata1978) re-examined some samples with controversial ages and concluded that the OZGs formed at 14 ± 1 Ma. Later researchers have used K–Ar and fission-track methods and obtained generally consistent results (e.g. Sumii et al. Reference Sumii, Uchiumi, Shinjoe and Shimoda1998; Sumii, Reference Sumii2000; Iwano et al. Reference Iwano, Danhara, Hoshi, Sumii, Shinjoe and Wada2007). Previous radiometric ages for the OZGs are presented in Figure 7 and summarized for each igneous body in Table 1. Although most of the ages are concentrated between 13 and 16 Ma, outliers extend from 12 to 22 Ma. This scatter may be the result of excess Ar or Ar loss that affects samples in K–Ar dating. It is noteworthy that all K–Ar ages represent cooling ages. Hence it is crucial to constrain the age of magmatism by zircon U–Pb dating, taking advantage of the higher closure temperatures in zircon, to shed light on the relationship between fore-arc magmatism and clockwise rotation of the SW Japan arc during and after Miocene time.
Probability density plots and histograms of previously reported radiometric ages of the OZGs in the SW Japan arc: (a) Kii Peninsula (from Iwano et al. Reference Iwano, Danhara, Hoshi, Sumii, Shinjoe and Wada2007), (b) Western Shikoku (from Shinjoe & Sumii, Reference Shinjoe and Sumii2001) and (c) Kyushu (from Shinjoe & Sumii, Reference Shinjoe and Sumii2003; Oikawa et al. Reference Oikawa, Umeda, Kanazawa and Matsuzaki2006). Ages were determined by K–Ar or zircon fission-track methods, plus a few obtained by the Rb–Sr whole-rock isochron method.

3. Methodology
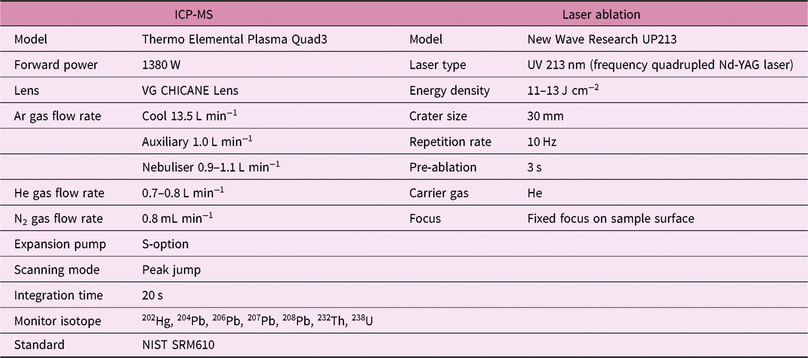
U–Pb ages of zircon were determined using a VG Plasma Quad 3 inductively coupled plasma mass spectrometer (ICP-MS) at the Earthquake Research Institute of the University of Tokyo, connected to a frequency quintupled (λ = 213 nm) Nd-YAG laser ablation (LA) system (New Wave Research UP-213). Details of the analytical protocol, precision and accuracy of the zircon U–Pb dating are presented in Orihashi et al. (Reference Orihashi, Nakai and Hirata2008), and the analytical conditions are listed in Table 2. The ISOPLOT 4.15 program (Ludwig, Reference Ludwig2012) was used for calculation of weighted means, mean square weighted deviations (MSWDs) and probabilities and for plotting data on a Tera–Wasserberg concordia diagram. Replicate measurements of the 91500 zircon standard (n = 333) during this study yielded a 238U–206Pb age of 1051.9 ± 3.3 Ma (weighted mean age ±95 % confidence) and a 235U–207Pb age of 1063.5 ± 2.5 Ma (weighted mean age ±95 % confidence). Deviations from the isotope dilution thermal ionization mass spectrometry (ID-TIMS) data (1062.4 ± 0.4 Ma and 1063.5 ± 0.3 Ma, respectively) reported by Wiedenbeck et al. (Reference Wiedenbeck, Alle, Corfu, Griffin, Meier, Oberli, Von Quadt, Roddick and Spiegel1995) are within 1 %. Replicate measurements of the OD-3 zircon standard (n = 115) yielded a 238U–206Pb age of 32.73 ± 0.22 Ma (weighted mean age ±95 % confidence) and a 235U–207Pb age of 33.44 ± 0.38 Ma (weighted mean age ±95 % confidence), which are consistent with the weighted mean 238U–206Pb age (33.0 ± 0.1 Ma) of multiple-laboratory comparison data (Iwano et al. Reference Iwano, Orihashi, Hirata, Ogasawara, Danhara, Horie, Hasebe, Sueoka, Tamura, Hayasaka, Katsube, Ito, Tani, Kimura, Chang, Kouchi, Haruta and Yamamoto2013) and the ID-TIMS value of 32.72 ± 0.16 Ma reported by Lukács et al. (Reference Lukács, Harangi, Bachmann, Guillong, Danišík, Buret, Quadt, Dunkl, Fodor, Sliwinski, Soós and Szepesi2015).
Summary of LA–ICP–MS operating conditions
4. Results
Our U–Pb analyses emphasized the rims of euhedral zircon grains to determine the magmatic age of the samples. To avoid inclusions and fractures at the analytical points, zircon grains were monitored under a transmitted light microscope during laser ablation. Samples were observed by cathodoluminescence (CL) and backscattered electron images before or after analysis except for some early samples. CL images showing representative zonal structures including both I-type and S-type granitic rocks are presented in Figure 8.
Cathodoluminescence images showing representative zonal structures of analysed zircon grains. (a) I-type granodiorite in western Shikoku (EHI38), (b) welded tuff of the S-type Kumano Acidic Rocks in Kii Peninsula. We conducted LA-ICP-MS analysis mainly on the rim of the zircon crystals to constrain the magmatic age of the samples. Generally, most of the rim of the euhedral zircons of I-type granitic rocks yielded concordant primary magmatic ages, though some grains have dark core in CL images (a). Discordant analytical points (marked ‘d’) were presumed to be affected by common Pb (see Fig. 9). S-type granitic rocks usually contain a considerable amount of inherited zircons. For example, some of the rims for euhedral grains in S-type rhyolitic welded tuff (b) show Mesozoic ages. (c) Euhedral grains with concentric oscillatory zoning (from sample EHI100). These usually yielded concordant magmatic ages (right-hand grain), although some showed discordant results affected by common lead (analytical points marked ‘d’) or concordant older ages (left-hand grain). (d) Euhedral grains with oscillatory zoning rims and homogeneous cores (from sample IuchiWT) yielded concordant magmatic ages. (e) Euhedral grains with thin (<20 μm) rims with oscillatory zoning and intricately zoned cores showing concordant Cretaceous ages (from sample IuchiWT). (f) Euhedral grains showing concentric oscillatory zoning (from sample TKG1) with concordant Permian ages. (g) Anhedral grains with rims with oscillatory zoning yielded concordant magmatic ages (from sample TKG1).

For each rock sample, 23–81 points were measured and weighted means, shown in Table 3, were obtained from five or more concordant 238U–206Pb ages of primary magmatic zircons. Most of the samples comprise many discordant analytical points explained in terms of Pb loss for older inherited grains or contamination of common Pb. In this research, correction of common Pb was not conducted. Hg contamination in the Ar carrier gas is unavoidable in the LA-ICP-MS method, hence highly accurate 204Pb determination is very difficult due to the interference of 204Hg. Common Pb correction using 208Pb/232Th ratio (Anderson, Reference Anderson2002) is also not appropriate in our approach. The analytical method by Orihashi et al. (Reference Orihashi, Nakai and Hirata2008) is used in this study, optimized so that the ablation fractionation is minimized at the 206Pb/238U ratio. Under this analytical condition, error at the 208Pb/232Th ratio in repeated analysis of the standard reached up to c. 15 % (2σ), resulting in analytical errors much larger than those of 206Pb/238U age.
Results of zircon U–Pb ages

* Number of concordant data only includes the primary magmatic zircon population.
Rather than attempting to apply a common-Pb correction, we have used a regression technique, treating our population of analyses as representing mixtures between the common-Pb and radiogenic-Pb components. First, we select only the concordant analysis, then calculate the weighted mean of the 206Pb/238U age for concordant analytical points. Concordant but older inherited zircons in each sample were statistically distinguished from the weighted mean data of primary magmatic zircons. After excluding analytical points of inherited grains, the lower intercept age is determined by regression. If this agrees with the weighted mean of the concordant age of primary magmatic zircons within the error range, and the 207Pb/206Pb ratio of the other end component is close to that of common Pb (Stacey & Kramers, Reference Stacey and Kramers1975), the selected population of discordant points were considered to be affected by common Pb for primary magmatic zircons. The agreement between the lower intercept age and the weighted mean age strengthens the legitimacy of the concordant analytical point judged as ‘primary magmatic zircon’. Lower intercept ages are also listed in Table 3, except for two samples for which an effective regression line could not be obtained due to the poor population affected by common Pb. Tera–Wasserburg diagrams including regression line and plots showing the result of weighted mean calculation for representative samples are shown in Figure 9. Analytical data are listed in Supplementalry Material Tables S3–S11 (https://doi.org/10.1017/S0016756819000785). Plots of the Tera–Wasserburg diagram and weighted mean calculation results for all samples are included in the Supplementary Material S12 (https://doi.org/10.1017/S0016756819000785).
(a–e) Tera–Wasserburg concordia diagrams and plots of the result of weighted mean calculation of 238U–206Pb ages of concordant primary zircons of five representative samples: (a) Dolerite (SP202) of the Shionomisaki igneous complex in Kii Peninsula; (b) S-type rhyolitic welded tuff (IuchiWT) of the Kumano Acidic Rocks in Kii Peninsula; (c) I-type granodiorite (DO3C) of the Dorogawa pluton in Kii Peninsula; (d) S-type granodiorite (UWA6) of the Uwajima pluton in western Shikoku; (e) I-type granodiorite (EHI38) of Omogo pluton in the Ishizuchi Group, western Shikoku. Tera–Wasserburg diagrams in the second row show the enlarged view including the primary magmatic zircon population together with the regression line to estimate the contamination of common Pb. I-type granitic rocks and dolerite (a, c, e) comprise no or a few inherited zircon grains, and the main cause of discordance is presumed to be common Pb contamination. On the other hand, S-type granitic rocks (b, d) contain a considerable amount of inherited zircon grains in addition to grains affected by common Pb contamination. Grey symbols in the plots of the result of weighted mean calculation show the analysis statistically rejected from the calculation. (f) Concordia diagrams of the zircons from an I-type granodirite (IC01) from Ichifusayama in Kyushu. No primary magmatic zircon was found. The concordia diagram in the second row is the enlarged view of the area younger than 200 Ma. Concordia diagrams and plots of the result of the weighted mean of 238U–206Pb ages of concordant primary zircons for all of the analysed samples are presented in the Supplementary Material (S12) (https://doi.org/10.1017/S0016756819000785).

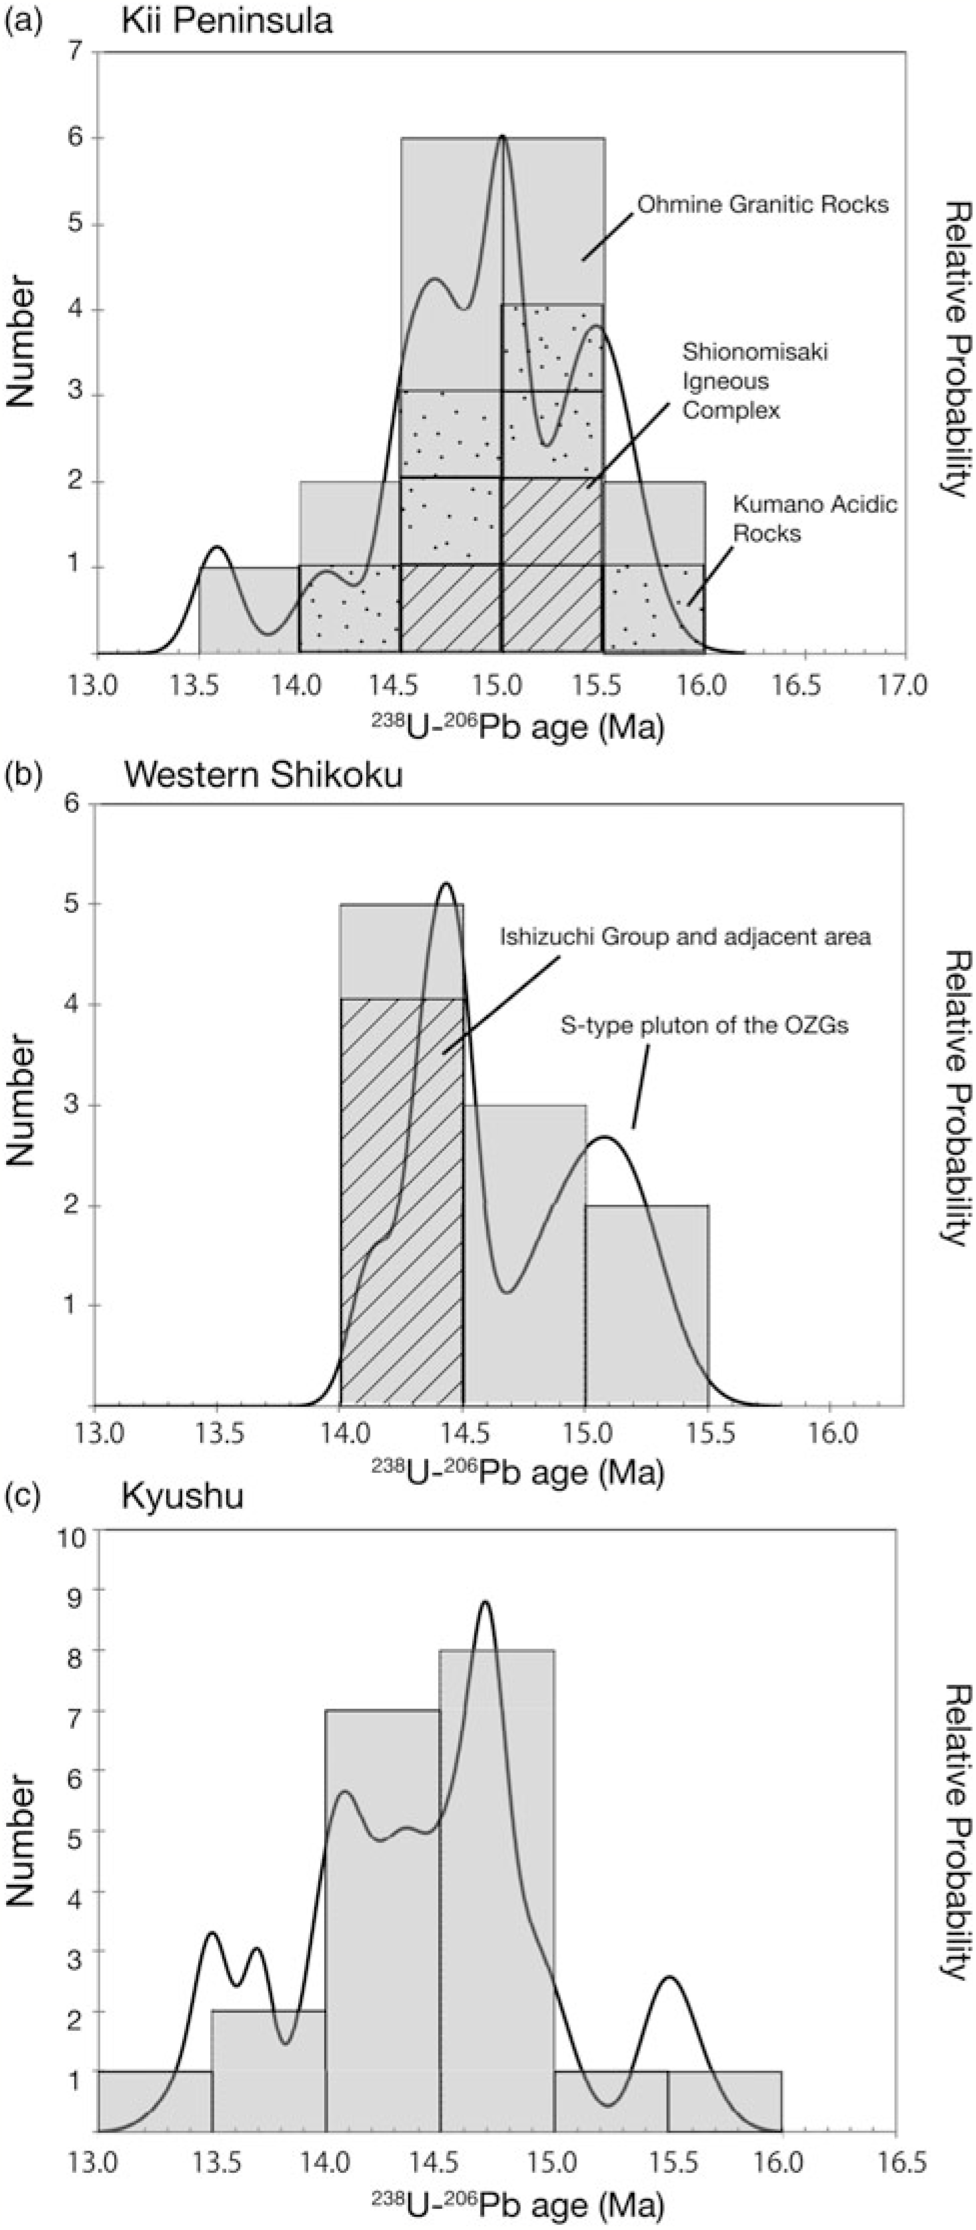
Relative density plots and histograms of 238U–206Pb ages for each region are shown in Figure 10. 238U–206Pb ages of samples from the Kii Peninsula (13.59–15.60 Ma), Shikoku (14.14–15.23 Ma) and Kyushu (13.46–15.56 Ma) are in good agreement. The narrower age range of samples from Shikoku probably reflects the smaller number of data. The distribution of Miocene igneous rocks and the overall results of U–Pb analysis of each region are shown in Figures 11–13.
Probability density plots and histograms of 238U–206Pb ages of the middle Miocene felsic rocks of the SW Japan arc from (a) the Kii Peninsula, (b) western Shikoku and (c) Kyushu.
Outline map of the Kii Peninsula showing the distribution of near-trench igneous rocks and their zircon U–Pb ages. Sample identifications are the same as those listed in Table 3. MTL, Median Tectonic Line.

Outline map of western Shikoku showing the distribution of near-trench igneous rocks and their zircon U–Pb ages. Sample identifications are the same as those listed in Table 3. MTL, Median Tectonic Line. U–Pb zircon ages for the Ashizuri igneous complex are shown for comparison (Shinjoe et al. Reference Shinjoe, Orihashi and Sumii2010).

Outline map of Kyushu showing the distribution of near-trench igneous rocks and their zircon U–Pb ages. UYTL, Usuki–Yatsushiro Tectonic Line. U–Pb zircon ages for the Ohno Volcanic Rocks, a member of the Setouchi Volcanic Rocks, are listed at the top for comparison (Shinjoe & Orihashi, Reference Shinjoe and Orihashi2017).

4.a. Kii Peninsula
4.a.1. Shionomisaki igneous complex
The Shionomisaki Igneous Complex, at the southern tip of the Kii Peninsula, is composed of mafic to felsic intrusive and extrusive rocks (Fig. 14). Our zircon U–Pb analysis for three samples (SP202, SP205 and SP212 in Table 3) yielded 238U–206Pb weighted mean ages of a dolerite, a gabbroic intrusion and a rhyolite lava ranging from 14.61 to 15.38 Ma. Our results refined zircon fission-track ages reported by Hoshi et al. (Reference Hoshi, Iwano and Yoshida2003) that ranged from 13.9 to 15.2 Ma with the exception of a 13.1 Ma felsite dike (Fig. 7).
Lithological map of the Shionomisaki Igneous Complex at the southernmost tip of the Kii Peninsula showing sample localities and U–Pb ages. Zircon fission-track ages (Hoshi et al. Reference Hoshi, Iwano and Yoshida2003) and sample locations are shown for comparison.

4.a.2. OZGs in the Kii Peninsula
238U–206Pb ages were obtained for six samples from the KARs yielded weighted mean ages ranging from 14.48 to 15.51 Ma (Fig. 15). Welded tuff from the Owase-Shirahama pyroclastic rocks (sample IuchiWT) recovered from a borehole that penetrated a laccolith of porphyritic granite of the northern unit into the welded tuff (Kitagawa et al. Reference Kitagawa, Takahashi, Koizumi, Mizuochi, Murase and Kawanishi2009). Granite porphyry sample KUM16, collected from an isolated small peninsula of the southern unit, yielded a weighted mean age that did not overlap with other data within the error range, suggesting that precursory activity occurred there before the majority of the KARs were emplaced.
Lithological map of the Kumano Acidic Rocks in the SE Kii Peninsula showing sample localities and U–Pb ages. Previous dating results are shown for comparison: K–Ar ages are marked ‘1’ (Sumii et al. Reference Sumii, Uchiumi, Shinjoe and Shimoda1998) and zircon fission-track ages are marked ‘2’ (Iwano et al. Reference Iwano, Danhara, Hoshi, Sumii, Shinjoe and Wada2007).

We obtained 238U–206Pb ages of 14.88 ± 0.45 Ma and 14.67 ± 0.26 Ma for tuffite from the Ohmine dike (sample TKG1) and the Nakaoku dike (sample D1), respectively. These are within the age range of the KARs.
238U–206Pb ages of four S-type plutons of the OGRs ranged from 14.99 to 15.60 Ma. The Dorogawa pluton, the northernmost I-type pluton, yielded a 238U–206Pb age of 14.13 ± 0.29 Ma, youngest among the OGRs. Granodiorite of this pluton is characterized by low FeO*/MgO ratios, high Cr and Ni contents, and enclaves of high-Mg andesite-like diorite containing Cr-rich spinel, which suggests that it was derived from a high-Mg andesite magma, as reported for Setouchi Volcanic Rocks (Shinjoe et al. Reference Shinjoe, Shimoda, Fukuoka and Sumii2005). The Takamiyama pluton yielded a 238U–206Pb age of 13.59 ± 0.22 Ma, ∼1 Ma younger than the major igneous activity of the OGRs.
Overall, the 238U–206Pb ages from the KARs and OGRs of the Shionomisaki Igneous Complex are in good agreement except for the two northernmost plutons (Dorogawa and Takamiyama plutons).
4.b. Western Shikoku
We obtained six 238U–206Pb ages from two S-type plutons (Okinoshima–Kashiwajima and Uwajima plutons) in western Shikoku (Fig. 11). In the Okinoshima–Kashiwajima pluton, Tanijiri-type granodorite is intruded by Mojima-type granite (Dai et al. Reference Dai, Tsusue and Honma1993). For Tanijiri-type granodorite (samples OK2C and KAS2) we obtained ages of 14.71 ± 0.45 Ma and 14.99 ± 0.32 Ma, and for Mojima-type granite (sample OK1B) we obtained an age of 14.14 ± 0.18 Ma. Although our results are consistent with the order of intrusion, these ages accord with each other within their 2σ errors. From the Uwajima pluton we obtained 238U–206Pb ages for three samples with different mineral assemblages. The weighted mean ages range from 14.93 to 15.23 Ma and coincide with each other within their 2σ errors.
For the felsic rocks of the Ishizuchi Group, we obtained 238U–206Pb ages of 14.48 ± 0.16 Ma from a rhyolitic welded tuff (sample EHI100) of the lowest horizon Takano pyroclastic flow deposits and 14.35 ± 0.16 Ma from a granodiorite (sample EHI38) of the Omogo central pluton (Fig. 12). For the Myojinyama-type Acidic Rocks, we determined 238U–206Pb ages of 14.37 ± 0.16 Ma and 14.49 ± 0.15 Ma from dacites of the Ishidatami body (sample EHI105) and Myojinyama body (sample EHI205), respectively. These ages coincide with those of the adjacent Ishizuchi Group and previous whole-rock K–Ar ages reported by Tazaki et al. (Reference Tazaki, Kagami, Itaya and Nagao1993) within their 2σ errors.
4.c. Kyushu
All of the analysed samples from Kyushu were collected from OZGs. We selected 21 samples from representative lithologies of 14 igneous bodies (Table 3; Fig. 13). Two older ages (15.48 ± 0.22 Ma and 15.56 ± 0.28 Ma) were obtained from quartz porphyry dikes on Tanegashima and Yakushima islands (Fig. 2), the nearest to the trench. These ages are comparable to the older KARs and OGRs in the Kii Peninsula. The other ages are concentrated within a range of 1.5 Ma (13.46 to 14.93 Ma).
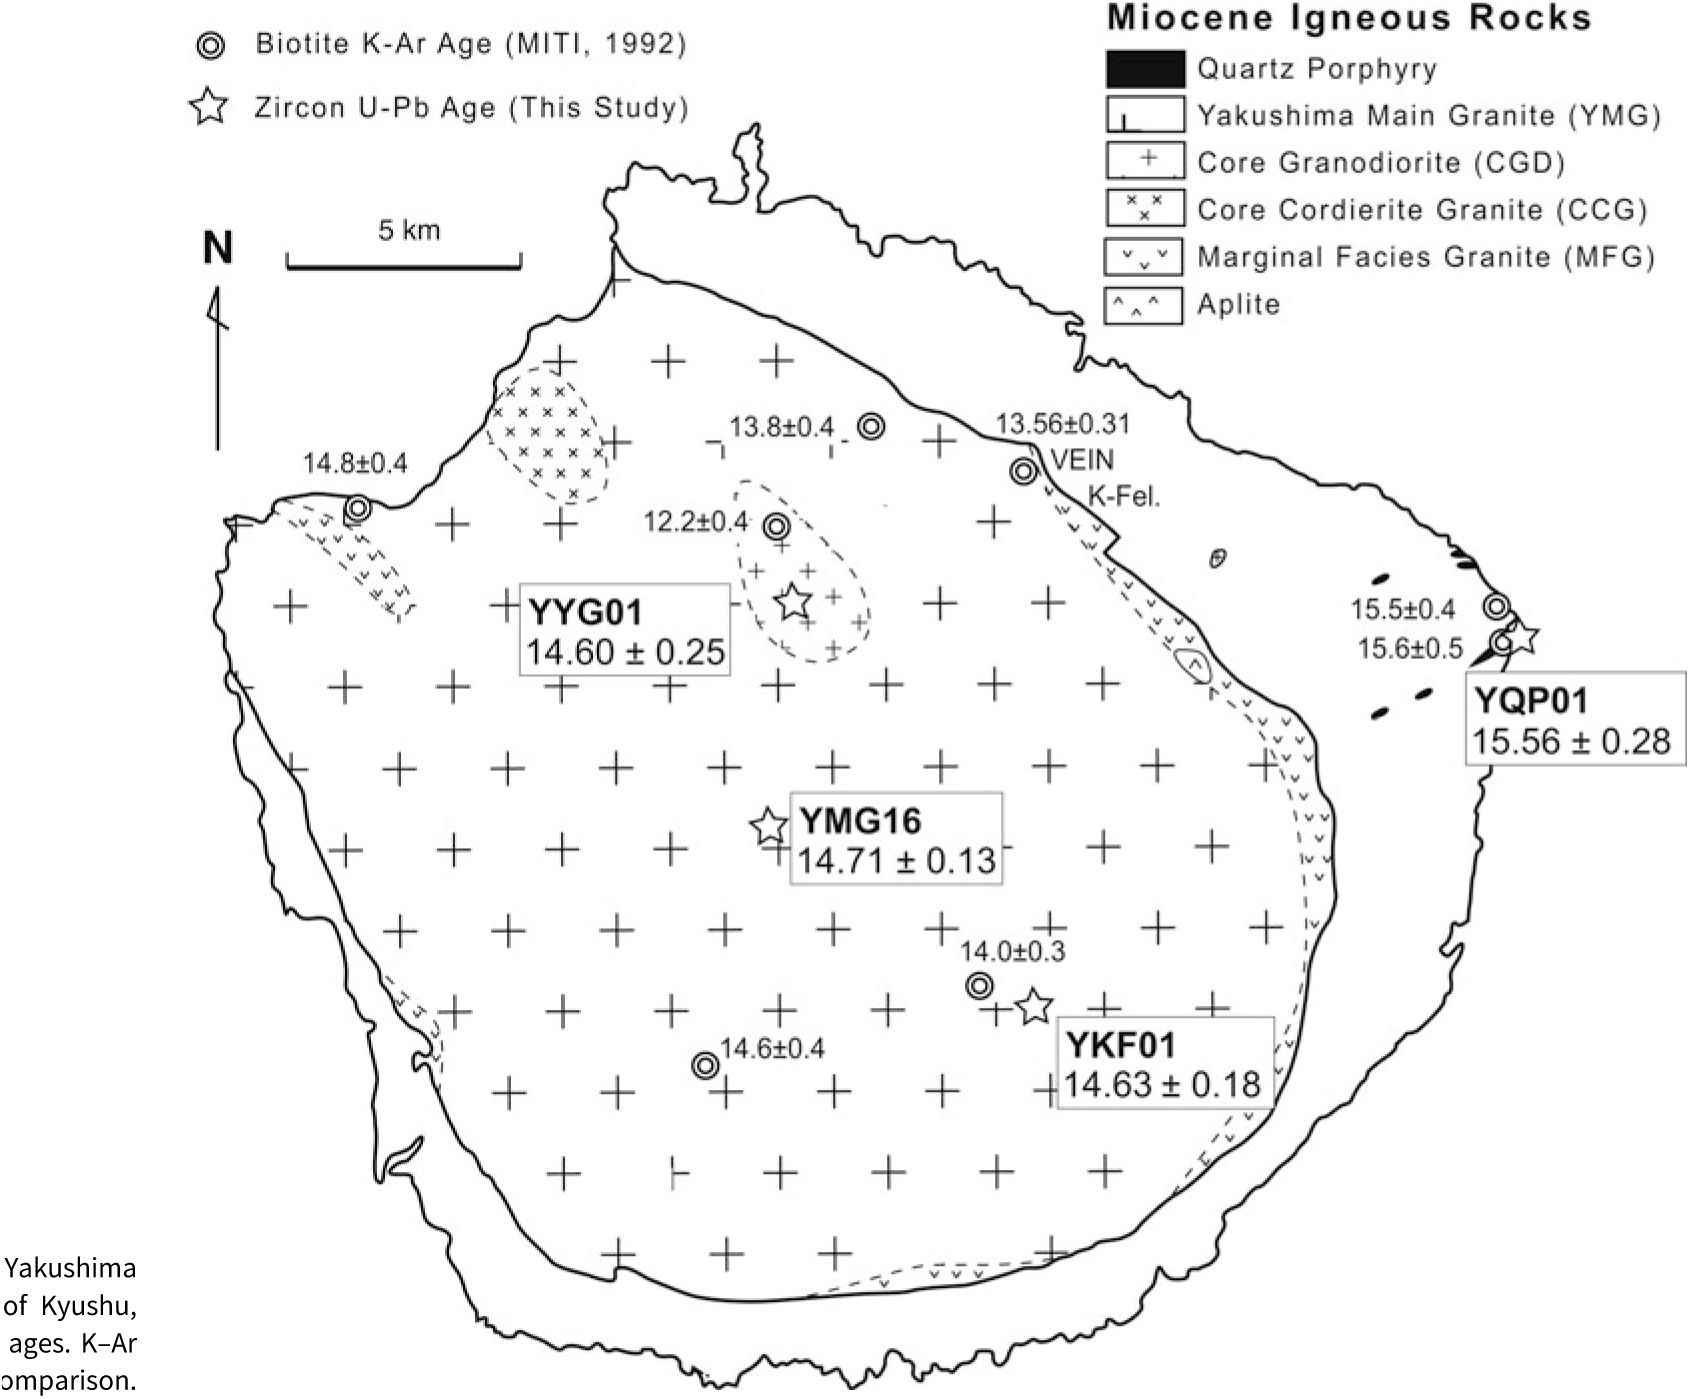
For the batholithic Yakushima pluton, we analysed three zircon samples from the main-facies granite (sample YMG), orthoclase megacrysts (sample YKF) in the same granite, and a cordierite-bearing granodiorite (sample YYG). Although the Sr–Nd isotopic ratio of sample YYG implied strong sediment contamination (Anma et al. Reference Anma, Kawano and Yuhara1998; Kawano et al. Reference Kawano, Anma and Yuhara2007) and the inclusion mineralogy suggested that the orthoclase megacrysts crystallized relatively early (Kawachi & Sato, Reference Kawachi and Sato1978; Anma, Reference Anma, Bouchez, Hutton and Stephens1997), the three results from this pluton coincided with each other within their error ranges (Fig. 16). Two S-type plutons in the Osumi Peninsula of southernmost Kyushu (Minami–Oshumi and Takakumayama) yielded ages of 14.74 ± 0.17 Ma and 14.14 ± 0.31 Ma. Granite samples from the Ichifusayama pluton contained no primary magmatic zircon, only inherited zircons with ages ranging from Jurassic to Proterozoic.
Lithological map of the Yakushima pluton in Yakushima Island, south of Kyushu, showing sample localities and U–Pb ages. K–Ar ages from MITI (1992) are shown for comparison.
Samples from four small plutons in southwesternmost Kyushu (samples SA101A, SA102, SA106 and SA107) yielded 238U–206Pb ages ranging from 14.25 to 14.93 Ma, which refine the previously reported older cluster ages of ∼20 to 22 Ma (Fig. 2) obtained using the zircon fission-track method (MITI, 1985).
From the Okueyama volcano–plutonic complex, we obtained 238U–206Pb ages of 14.09 ± 0.19 Ma for the Sobosan andesite (sample MYA02), 14.00 ± 0.24 Ma for the Kunimidake rhyolitic tuff (sample MYA01), 13.70 ± 0.13 Ma for a granite of the Okueyama batholith (sample MYA03), and 14.28 ± 0.26 Ma for a porphyritic granite of the ring dike (sample MYA05).
From the Osuzuyama volcano–plutonic complex, porphyritic granodiorite stock yielded 238U–206Pb ages of 14.70 ± 0.37 Ma. The youngest ages among the OZGs in Kyushu were obtained for the Shibisan pluton (13.50 ± 0.15 Ma and 13.46 ± 0.30 Ma), the farthest from the trench axis.
5. Discussion
Our U–Pb dates for igneous rocks in the Outer Zone indicate that magmatism was active at the same time along the SW Japan arc from the Kii Peninsula to Kyushu, commencing at c. 15.6 Ma. This finding has implications for the opening of the Japan Sea, migration of the Philippine Sea plate and subduction of young and hot lithosphere of the Shikoku Basin during Miocene time, and the duration of caldera-forming eruptions in the Outer Zone.
5.a. Chronological relationship with the opening of the Japan Sea
Palaeomagnetic studies have established that both the SW and NE Japan arcs underwent rapid rotation in early to middle Miocene time. Early studies proposed that the SW Japan arc rotated clockwise ∼50°, most of the rotation occurring between 16.1 and 14.2 Ma (Otofuji & Matsuda, Reference Otofuji and Matsuda1983, Reference Otofuji and Matsuda1987; Hayashida & Itoh, Reference Hayashida and Itoh1984; Otofuji et al. Reference Otofuji, Itaya and Matsuda1991). Subsequent research has pushed the dates of this rotation back in time. Nakajima et al. (Reference Nakajima, Sawada, Nakagawa, Hayashi and Itaya1990) used K–Ar ages and palaeomagnetic evidence from Miocene rocks in Fukui, in the NE part of the arc, to show that the rapid rotation began at ∼17 Ma and ceased at 15 Ma. Similar evidence for the rotation ending ∼15 Ma was later reported from other sites in the arc (Hoshi et al. Reference Hoshi, Tanaka, Takahashi and Yoshikawa2000; Hoshi & Sano, Reference Hoshi and Sano2013). More recently, Sawada et al. (Reference Sawada, Mishiro, Imaoka, Yoshida, Inada, Hisai, Kondo and Hyodo2013) re-examined the volcanic rocks in the Matsue area on the north side of the arc, originally investigated by Otofuji & Matsuda (Reference Otofuji and Matsuda1983) and Otofuji et al. (Reference Otofuji, Itaya and Matsuda1991), and concluded that the clockwise rotation began after 18 Ma and ceased at 16 Ma, although their conclusion still depended on conventional K–Ar and fission-track dating data with large analytical uncertainties. Hoshi et al. (Reference Hoshi, Kato, Ando and Nakashima2015 a) conducted an intensive palaeomagnetic study of the Mizunami Group in the eastern part of the arc, where depositional ages are well constrained by biostratigraphy, and concluded that rapid clockwise rotation began after 17.5 Ma and largely ceased before 15.8 Ma. The latest compilation by Hoshi (Reference Hoshi2018 a) concluded that the arc rotated clockwise by ∼40° between 18 and 16 Ma. Thus, magmatism in the Outer Zone started immediately after rotation of the SW Japan arc ceased.
Recent radiometric dating of Setouchi Volcanic Rocks, including zircon U–Pb methods, has yielded ages ranging from 15.2 to 13.2 Ma (Tatsumi et al. Reference Tatsumi, Tani, Sato, Danhara, Hyodo, Kawabata, Hanyu and Dunkley2010; Shinjoe & Orihashi, Reference Shinjoe and Orihashi2017). Shinjoe et al. (Reference Shinjoe, Orihashi and Sumii2010) reported zircon U–Pb ages of ∼13 Ma for the syenite and alkali granite from the Ashizuri igneous complex in the Marginal Zone (Fig. 12). Recent 40Ar–39Ar dating of the alkali basalt/dolerite dikes in the Ashizuri, Shingu and Tanegashima complexes has yielded ages ranging from 15 to 12 Ma (Shinjoe et al. Reference Shinjoe, Shibata, Yoshikawa, Orihashi and Sudo2018). Our new data indicate that, in both Kii Peninsula and southern Kyushu, the magmatism started at ∼15.6 Ma. In sum, high-precision radiometric dating shows that all middle Miocene near-trench igneous activity took place just after the opening of the Japan Sea ceased c. 16 Ma.
Since the early suggestion by Nakada & Takahashi (Reference Nakada and Takahashi1979), researchers have connected the origin of Miocene fore-arc magmatism to the subduction of hot lithosphere of the Shikoku Basin. Under that scenario, magmatism in the Setouchi Volcanic Belt, including high-Mg andesites, has been ascribed to the interaction of slab melt with mantle peridotite (Furukawa & Tatsumi, Reference Furukawa and Tatsumi1999; Tatsumi, Reference Tatsumi2006). The results of this study suggest that Miocene fore-arc magmatism, in contrast, was connected to the cessation of the opening of the Japan Sea.
Granitic melts that originate by partial melting of subducted slabs and their accompanying sediments may form and rise to shallow levels, as suggested in the Chile Ridge subduction zone where hot oceanic lithosphere is subducted (Anma et al. Reference Anma, Armstrong, Orihashi, Ike, Shin, Kon, Komiya, Ota, Kagashima, Shibuya, Yamamoto, Veloso, Fannin and Herve2009; Anma & Orihashi, Reference Anma and Orihashi2013; Shin et al. Reference Shin, Anma, Nakano, Orihashi and Ike2015), as illustrated in the SW Japan arc during the incipient stage of subduction of the Philippine Sea plate according to structural, petrological and geochronological studies (e.g. Anma, Reference Anma, Bouchez, Hutton and Stephens1997; Anma & Sokoutis, Reference Anma, Sokoutis, Bouchez, Hutton and Stephens1997; Anma et al. Reference Anma, Kawano and Yuhara1998; Kimura et al. Reference Kimura, Hashimoto, Kitamura, Yamaguchi and Koge2014), and as experimentally demonstrated for subducted sediments (e.g. Patino Douce, Reference Patino Douce1996) and fluids (Iwamori, 1998, Reference Iwamori2000). Such shallow melts or fluids in subduction zones may act as lubricants that decrease friction between the subducting slab and the overriding crust (Anma & Sokoutis, Reference Anma, Sokoutis, Bouchez, Hutton and Stephens1997). Thus, it may have been relatively easy for the crust of the SW Japan arc to move southward as the Japan Sea opened. As the melt or fluid escaped, the plate interface between the hot, relatively buoyant subducting lithosphere of the Shikoku Basin and the SW Japan arc crust would have become locked as the lubricating effect decreased. Perhaps the plutons intruding into the SW Japan arc crust across the plate interface contributed to the locking. Together, these resistive mechanisms may have slowed or halted the southward migration of the SW Japan arc crust and the opening of the Japan Sea.
5.b. Philippine Sea plate reconstruction
Reconstructions of the configuration and motion of the Philippine Sea plate must rely largely on palaeomagnetic evidence, because it lacks active spreading zones or hotspot tracks that can be utilized in global plate circuits (Seton et al. Reference Seton, Müller, Zahirovic, Gaina, Torsvik, Shephard, Talsma, Gurnis, Turner, Maus and Chandler2012). Palaeomagnetic studies indicate that the Philippine Sea plate has moved northward by ∼20° of latitude and rotated clockwise as much as 110° since Eocene time (e.g. Louden, Reference Louden1977; Ali & Hall, Reference Ali and Hall1995; Hall et al. Reference Hall, Ali, Anderson and Baker1995; Yamazaki et al. Reference Yamazaki, Takahashi, Iryu, Sato, Oda, Takayanagi, Chiyonobu, Nishimura, Nakazawa and Ooka2010). Yamazaki et al. (Reference Yamazaki, Takahashi, Iryu, Sato, Oda, Takayanagi, Chiyonobu, Nishimura, Nakazawa and Ooka2010) presented a model in which the Philippine Sea plate rotated 90° clockwise between 50 and 15 Ma, based on palaeomagnetic data of drilled cores from the Kyushu–Palau Ridge and other localities. Wu et al. (Reference Wu, Suppe, Lu and Kanda2016) noted in their compilation of palaeomagnetic data that the major uncertainty in the rotation of the whole Philippine Sea plate arises from the possibility of local rotation of neighbouring plates or blocks at its margins. Since the early work by Seno & Maruyama (Reference Seno and Maruyama1984), most palaeogeographic reconstructions of the Philippine Sea plate have abandoned the anchored slab model that assumes a fixed plate boundary and adopted a retreating-trench model in which the palaeo-IBM arc migrated along the margin of SW Japan as the Shikoku Basin continued to open. There are two variants of this model, one in which the TTT triple junction migrates early and the other in which it migrates late. Emphasizing the clockwise rotation of the Philippine Sea plate, the late migration model (Fig. 17a) involves the northern end of the palaeo-IBM arc shifting eastward from Kyushu to the Izu Peninsula (its present position) from 15 to 5 Ma (e.g. Hall, Reference Hall2002; Sdrolias et al. Reference Sdrolias, Roest and Müller2004; Clift et al. Reference Clift, Carter, Nicholson and Masago2013). However, Okino (Reference Okino1994) reported that the Shikoku Basin has not rotated significantly since 16 Ma, citing palaeomagnetic data from the Kinan seamount chain in the middle of the Shikoku Basin.
Miocene plate configuration models around SW Japan. IBA, palaeo-IBM arc; KPR, Kyushu–Palau Ridge. (a) Late TTT triple junction migration model (e.g. Sdrolias et al. Reference Sdrolias, Roest and Müller2004; Kimura et al. Reference Kimura, Hashimoto, Kitamura, Yamaguchi and Koge2014). The palaeo-IBM arc migrates along the margin from Kyushu to the Izu Peninsula from 15 to 5 Ma during near-trench magmatism in the SW Japan arc. (b) Plate configuration showing subduction of the Pacific plate before the rapid rotation of SW Japan (e.g. Hibbard & Karig, Reference Hibbard and Karig1990). (c) Plate configuration based on the Heike plate hypothesis (Yamaji & Yoshida, Reference Yamaji and Yoshida1998) before the rapid rotation of SW Japan.

Kimura et al. (Reference Kimura, Hashimoto, Kitamura, Yamaguchi and Koge2014) adopted the late migration model when discussing the origin of near-trench magmatism in the SW Japan arc. They presumed that near-trench magmatism produced its variety of petrological characteristics through the combination of the subduction of the active spreading ridge in the Philippine Sea plate, plus its neighbouring hot lithosphere, and the collision of the palaeo-IBM arc. They cited radiometric ages from the SW Japan arc that indicated eastward younging of near-trench magmatism to account for the contribution from the palaeo-IBM arc. However, most of their data were conventional K–Ar or fission-track ages, which represent cooling ages to ∼300 to 250 °C and are subject to significant uncertainty. They also called upon the collision of the palaeo-IBM arc to explain the coastal embayments between capes Ashizurimisaki, Murotomisaki and Shionomisaki. Raimbourg et al. (Reference Raimbourg, Famin, Palazzin, Yamaguchi and Augier2017) investigated the collision of the palaeo-IBM arc with the SW Japan margin by analysing deformation kinematics and by mapping peak palaeotemperatures through Raman spectra analysis of carbonaceous materials in Cretaceous to Neogene sedimentary rocks of the accretionary Shimanto Supergroup. They claimed that the collision of the palaeo-IBM arc took place in early Miocene time, before near-trench magmatism began in the SW Japan arc. They recognized that the heating event and most of the deformation recorded in the accreted unit occurred in early Miocene time, followed by rapid subsidence and deposition of the fore-arc basin sediments.
An alternative model proposes that a narrow wedge-shaped western extension of the Pacific plate north of the Philippine Sea plate was subducting beneath SW Japan before the Japan Sea opened (Fig. 17b; Hibbard & Karig, Reference Hibbard and Karig1990). In this model, the Pacific plate extension was consumed as the trench retreated during the rotation of the SW Japan arc, and the Philippine Sea plate started to subduct in turn. Yamaji & Yoshida (Reference Yamaji and Yoshida1998) proposed that this western extension of the Pacific plate was detached at ∼20 Ma to form the Heike plate, which shared a divergent boundary with the Philippine Sea plate (Fig. 17c). As the Heike plate was subducted beneath the SW Japan arc, the hot trench-subparallel spreading ridge between the Heike and Philippine Sea plates was also eventually subducted beneath the SW Japan arc.
Our U–Pb age data from the Outer Zone show that near-trench magmatism started simultaneously over the 600 km distance from the Kii Peninsula to Kyushu at ∼15.6 Ma. Thus, the IBM arc must have been east of the Kii Peninsula at 15.6 Ma, given that the magmatism arose from subduction of hot Shikoku Basin lithosphere. Our data clearly do not support late migration models in which the TTT triple junction migrated from Kyushu to the Kii Peninsula after 15 Ma (Fig. 17a).
The Heike plate hypothesis (Fig. 17c) can explain the timing and extent of the near-trench magmatism, though a hypothesis based on a completely vanished microplate may be difficult to test. Moreover, if subduction of a trench-parallel spreading ridge did occur, the young hot oceanic plate adjoining the ridge would have been subducted first. This would have triggered near-trench magmatism in advance of the main pulse of magmatism caused by subduction of the spreading ridge. However, no such precursory magmatism has been found in the study area.
Of all these proposed plate configurations, we favour a model involving subduction of the Pacific plate before the rotation of the SW Japan arc (Fig. 17b) because it maintains arc magmatism along the Japanese Islands before the arc began to rotate (Fig. 18a). Wu et al. (Reference Wu, Suppe, Lu and Kanda2016) based their discussion of Philippine Sea plate tectonics on a 3D seismic tomographic model of the subducted slab, which led them to address the Miocene tectonics of the Ryukyu and SW Japan arcs. Their model presumed that the Pacific plate was subducting beneath the SW Japan arc before the arc began its rotation. It also posited that a south-directed subduction zone on the northern edge of the Philippine Sea plate led to the formation of a volcanic arc there, the northern Philippine Sea arc (Fig. 18a). Our model adopts this northern Philippine Sea arc and supposes that it collided with the Ryukyu and SW Japan arcs in middle Miocene time. Although our chronological data cannot directly evaluate the presence of this arc, some geologic evidence in the SW Japan arc margin, such as compressional deformation in the early to middle Miocene Shimanto Belt in Kyushu and Shikoku that is usually interpreted in terms of the late migration model as the result of interactions with the palaeo-IBM arc, may instead be related to the collision of the northern Philippine Sea arc. As the SW Japan arc rotated clockwise, the wedge-shaped extension of the Pacific plate was consumed. Next, the hot Shikoku Basin lithosphere in the Philippine Sea plate began to subduct beneath the SW Japan arc, and widespread near-trench magmatism ensued (Fig. 18b) as the palaeo-IBM arc impinged upon Japan and approached its present position.
Plate configuration model of the SW Japan arc in middle Miocene time. (a) At ∼20 Ma, before the opening of the Japan Sea and rotation of the SW Japan arc, the Pacific plate subducted beneath the entire length of the Japanese islands and formed a volcanic arc well inboard of the trench (arc position from Kano et al. Reference Kano, Kato, Yanagisawa and Yoshida1991, and Hoshi et al. Reference Hoshi, Iwano, Danhara and Iwata2015 b). No magmatism took place near the trench in the SW Japan arc. (b) At ∼15 Ma, clockwise rotation of the SW Japan arc led to consumption of the wedge-shaped section of the Pacific plate and hot lithosphere of the Shikoku Basin in the Philippine Sea plate subducted beneath the SW Japan arc to cause near-trench magmatism (black stars) from Kyushu to the Kii Peninsula starting ∼15.6 Ma. The simultaneous onset of near-trench magmatism over this part of the trench requires that the palaeo-IBM arc was located east of the Kii Peninsula, where its collision with Honshu formed the Kanto syntaxis before 15 Ma (Hoshi, Reference Hoshi2018 b).

The question of when the collision of the palaeo-IBM arc began is a controversial issue (e.g. Kimura et al. Reference Kimura, Hashimoto, Kitamura, Yamaguchi and Koge2014), and models based on late migration of the TTT triple junction depend on a young (<10 Ma) collision (e.g. Amano, Reference Amano1991) as supported by geologic evidence such as collision-related conglomerates. However, a recent review of palaeomagnetic evidence has suggested that the Kanto syntaxis, a deformation structure attributed to the collision of the palaeo-IBM arc with Honshu (Fig. 18b), formed early, between 17 and 15 Ma (Hoshi, Reference Hoshi2018 b). This palaeomagnetic argument is consistent with our radiometric age data indicating that the SW Japan arc began to interact with the subducting Philippine Sea plate before 15.6 Ma.
The origin of near-trench magmas in the SW Japan arc is usually ascribed to the subduction of the Shikoku Basin lithosphere and its active spreading ridge (e.g. Kimura et al. Reference Kimura, Stern and Yoshida2005). Underplating of basaltic magmas from the subducting ridge may have been a heat source for crustal melting in the near-trench region. Additionally, the basaltic magmas may have contributed the mantle-derived component of the felsic magmas that is evident from their Sr–Nd isotopic compositions. Other supporting evidence includes the intrusion of MORB-like tholeiitic basaltic rocks in the Shionomisaki and Murotomisaki igneous bodies near the trench (Section 2.a.3) and the presence of basaltic enclaves in the porphyritic granite of the KARs in the Kii Peninsula (Harada, Reference Harada1961). However, the trench-normal fossil spreading ridge in the Shikoku Basin (the Kinan seamount chain) is now subducting underneath the Nankai Trough at the position of the channel between the Kii Peninsula and Shikoku (Fig. 1; Okino et al. Reference Okino, Ohara, Kasuga and Kato1999). If subduction of this trench-normal ridge was the major heat source of the near-trench magmatism, the centre of magma production should have followed the position of the subducting ridge as it migrated along the SW Japan arc. One such example is the along-arc progression of Cretaceous granitic rocks in SW Japan evident in K–Ar and Rb–Sr ages (Nakajima et al. Reference Nakajima, Sawada, Nakagawa, Hayashi and Itaya1990) and U–Pb ages (Iida et al. Reference Iida, Iwamori, Orihashi, Park, Jwa, Kwon, Danhara and Iwano2015), which has been ascribed to the subduction of the Kula–Pacific ridge. However, no such trend is apparent in our U–Pb ages for the near-trench Miocene felsic rocks in the SW Japan arc.
The uniformity of magmatism ages along the arc might be explained by segmentation of the Shikoku Basin spreading ridge. Okino et al. (Reference Okino, Ohara, Kasuga and Kato1999) showed from the bathymetry and magnetic anomalies of the Philippine Sea plate that this ridge was highly segmented by ∼19 Ma, when the ridge’s spreading direction changed from E–W to NE–SW. Sets of en echelon ridges meeting at the margin of the SW Japan arc might have supplied heat to a wide region along the arc.
Another explanation for the uniform ages of near-trench magmatism is that the mantle wedge was uniformly hot just after the rotation of the SW Japan arc and formation of the Sea of Japan. Although the primary cause of the back-arc rifting is controversial, back-arc basin formation is accompanied by upwelling of asthenospheric mantle, such that temperatures in the mantle wedge are higher than in subduction zones without back-arc basins (Tatsumi et al. Reference Tatsumi, Maruyama and Nohda1990). High-Mg andesites are widely found in the Setouchi Volcanic Rocks, distributed north of the Median Tectonic Line just outside the Outer Zone (Fig. 2). Their genesis has been ascribed to the partial melting of subducted Shikoku Basin lithosphere, subsequent melt–mantle interactions, and equilibration with the uppermost mantle (e.g. Shimoda et al. Reference Shimoda, Tatsumi, Nohda, Ishizaka and Jahn1998; Tatsumi, Reference Tatsumi2006). Melt production from the hot Shikoku Basin slab probably also occurred in the Outer Zone (Orihashi et al. Reference Orihashi, Inagaki, Hirata, Anma and Hirata2000). In areas of the Outer Zone near the trench where bodies of S-type granite predominate, pervasive melting of sediments above the subducting slab must have occurred, as the plate interface is filled with fertile accreted sediments. Metasedimentary xenoliths in the S-type granites record metamorphic conditions close to the solidus of sediment and pressures up to 0.74 GPa (Murata, Reference Murata1984; Shinjoe, Reference Shinjoe1997) that correspond to the depth of the bottom of the large batholith inferred from a magnetotelluric survey in the Kii Peninsula (Fujita et al. Reference Fujita, Ogawa, Yamaguchi and Yaskawa1997; Umeda et al. Reference Umeda, Uehara, Ogawa, Kudo and Kakuta2003). In the area where OZGs are distributed, the mantle wedge might not have been mature enough for widespread mafic to intermediate magnesian magmas to form via slab melt–mantle reactions. However, enclaves of magnesian andesite to dacite have been sporadically reported from OZGs (Nakada, Reference Nakada1983; Shinjoe, Reference Shinjoe1997; Shinjoe et al. Reference Shinjoe, Shimoda, Fukuoka and Sumii2005); thus slab melt interacting with mantle wedge peridotite may have contributed a heat source and mantle-derived components to some of the OGRs (Shinjoe, Reference Shinjoe1997).
6. Conclusions
Our new dataset of zircon U–Pb ages for the middle Miocene near-trench volcanic and plutonic rocks of the SW Japan arc sheds light on the relationship between igneous activities and the tectonic events of the time, including the opening of the Japan Sea and the migration and early subduction of hot young lithosphere of the Philippine Sea plate. Our major findings are listed below.
1. Precursory magmatism, characterized by dike and stock intrusions, started ∼15.6 Ma in both Kyushu and the Kii Peninsula.
2. Most plutonism occurred between 15.5 and 13.5 Ma, in an area 600 km long and 150 km wide.
3. The precursory magmatism ∼15.6 Ma occurred in the region closest to the trench. Youngest plutons are distributed in the region further to the trench.
4. No trends are apparent in U–Pb ages along the length of the arc.
5. All of the middle Miocene igneous activity took place shortly after the opening of the Japan Sea ended at c. 16 Ma.
From these findings, we argue that the extraction of melts from the slab affected the frictional properties on the plate interface and allowed the overriding crust to migrate. Later emplacement of granite plutons from a relatively buoyant hot slab in the near-trench region may have counteracted this change.
Our data also imply that the TTT triple junction between the Japan and IBM arcs must have reached a position east of the Kii Peninsula by 15.6 Ma, because otherwise a clear younging trend from west to east should have resulted from the migration of the spreading ridge in the Shikoku Basin on the Philippine Sea plate, now fossilized as the Kinan seamount chain.
The widespread contemporaneous magmatic activity along the SW Japan arc requires a wide heat source extending parallel to the trench. Our favoured candidates for this heat source include subduction of a trench-parallel ridge such as that which may have once existed between the extinct Heike plate and the Philippine Sea plate, or subduction of a young and highly segmented ridge system on the Philippine Sea plate, that developed by ∼19 Ma as its spreading direction shifted from E–W to NE–SW in addition to the hot wedge mantle condition related to the opening of Japan Sea.
Acknowledgements
This research was financially supported by Grant-in-Aid for Scientific Research from MEXT of Japan (#25400527 and #16K05583), Grant-in-Aid from Fujiwara Natural History Foundation (FY 2014), and the Tokyo Keizai University Research Grant (18-16) to H.S. LA-ICP-MS analyses were supported by the Earthquake Research Institute cooperative research program of the University of Tokyo. A borehole sample of the Kumano Acidic Rocks was kindly provided by Geological Survey of Japan, AIST. We thank Prof. Yutaka Wada (Nara University of Education) for providing a tuffite dike rock sample in Kii Peninsula and field guidance. We also thank Mr Tomoaki Sumii (Geological Survey of Japan, AIST) for guidance in the field of OGRs and KARs and for providing valuable information on the OZGs. We are indebted to Dr Tokomazu Hokada (National Institute of Polar Research) and Dr Masanori Kurosawa (Tsukuba University) for guidance in SEM/CL observations. Revisions by two anonymous referees as well as constructive editorial comments by Professor Yildirim Dilek greatly helped to improve the manuscript.
Supplementary material
To view supplementary material for this article, please visit https://doi.org/10.1017/S0016756819000785.



